3
Project Monitoring System& Control Process
(Ujala Farooq)
•Project Monitoring Information System
•🔹 What is a Project Monitoring System?
•A system to collect, track, and analyze project data
•Helps check if the project is going as planned
•🔹 Structure of the System:
•How data is collected
•How reports are made and used
•Gives important information to help make decisions
16/05/2025
4.
4
Data Collection andReporting
(Ujala Farooq)
•🔹 What kind of data is collected?
•Time: How much work is done on schedule
•Cost: How much money is spent
•Scope: How much of the planned work is complete
•🔹 Why collect this data?
•To create useful reports
•To measure project performance
•To find and solve problems early
•🔹 Types of Reports:
•Status Reports
•Performance Reports
•Forecast Reports
16/05/2025
5.
5
The Project ControlProcess
(Ujala Farooq)
•Step 1: Set a Baseline Plan
•Create a plan for time, cost, and work at the beginning
•Step 2: Measure Progress
•Check how much work is done
•Step 3: Compare Plan vs. Actual
•Compare the current progress with the original plan
•Step 4: Take Action
•If the project is late or over budget, take steps to fix it
16/05/2025
6.
6
Time Performance Monitoring& Tools to Monitor Time
Performance
(Ansa Nadeem)
•Time performance monitoring is the process of tracking how well a project is sticking to its
planned schedule.
•Why is time monitoring important?
•To make sure the project is on track
•Useful Tools:
•Tracking Gantt Chart
•Shows planned vs. actual progress visually
•Control Chart
•Shows if there are any unusual delays
•Milestone Schedule
•Key points in the project with deadlines
16/05/2025
7.
7
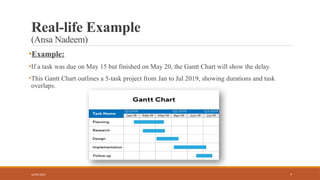
Real-life Example
(Ansa Nadeem)
•Example:
•Ifa task was due on May 15 but finished on May 20, the Gantt Chart will show the delay.
•This Gantt Chart outlines a 5-task project from Jan to Jul 2019, showing durations and task
overlaps.
16/05/2025
8.
8
Benefits of TimeMonitoring
(Ansa Nadeem)
•Helps the team notice delays early
•Better planning and time control
•Improves chances of finishing the project on time.
16/05/2025
9.
9
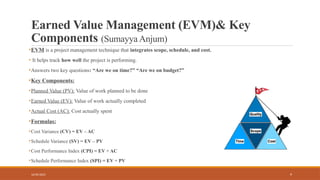
Earned Value Management(EVM)& Key
Components (Sumayya Anjum)
•EVM is a project management technique that integrates scope, schedule, and cost.
• It helps track how well the project is performing.
•Answers two key questions: “Are we on time?” “Are we on budget?”
•Key Components:
•Planned Value (PV): Value of work planned to be done
•Earned Value (EV): Value of work actually completed
•Actual Cost (AC): Cost actually spent
•Formulas:
•Cost Variance (CV) = EV – AC
•Schedule Variance (SV) = EV – PV
•Cost Performance Index (CPI) = EV ÷ AC
•Schedule Performance Index (SPI) = EV ÷ PV
16/05/2025
11
Hypothetical Status Report& Interpretation
(Sumayya Anjum)
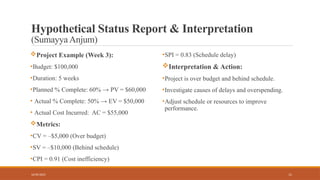
Project Example (Week 3):
•Budget: $100,000
•Duration: 5 weeks
•Planned % Complete: 60% → PV = $60,000
• Actual % Complete: 50% → EV = $50,000
• Actual Cost Incurred: AC = $55,000
Metrics:
•CV = –$5,000 (Over budget)
•SV = –$10,000 (Behind schedule)
•CPI = 0.91 (Cost inefficiency)
•SPI = 0.83 (Schedule delay)
Interpretation & Action:
•Project is over budget and behind schedule.
•Investigate causes of delays and overspending.
•Adjust schedule or resources to improve
performance.
16/05/2025
12.
12
Monitoring Progress withIndexes
(Ayesha Rafiq)
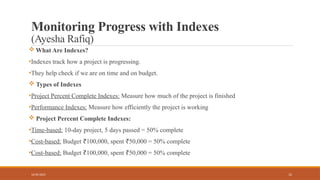
What Are Indexes?
•Indexes track how a project is progressing.
•They help check if we are on time and on budget.
Types of Indexes
•Project Percent Complete Indexes: Measure how much of the project is finished
•Performance Indexes: Measure how efficiently the project is working
Project Percent Complete Indexes:
•Time-based: 10-day project, 5 days passed = 50% complete
•Cost-based: Budget 100,000, spent 50,000 = 50% complete
₹ ₹
•Cost-based: Budget 100,000, spent 50,000 = 50% complete
₹ ₹
16/05/2025
14
Additional Earned ValueRules
(Ayesha Rafiq)
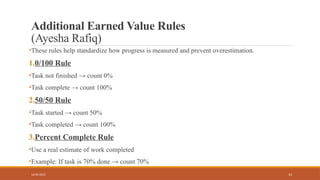
•These rules help standardize how progress is measured and prevent overestimation.
1.0/100 Rule
•Task not finished → count 0%
•Task complete → count 100%
2.50/50 Rule
•Task started → count 50%
•Task completed → count 100%
3.Percent Complete Rule
•Use a real estimate of work completed
•Example: If task is 70% done → count 70%
16/05/2025
15.
15
Forecasting Final ProjectCost
(Wareesha Zaheer)
Forecasting means predicting the total cost of the project at completion.
•Based on current performance data like work progress, cost spent, and schedule.
•Helps avoid unexpected budget overruns.
Common methods of forecasting:
•EAC = AC + ETC (Estimate at Completion = Actual Cost + Estimate to Complete)
•EAC = BAC / CPI (when using Cost Performance Index for future estimation)
•Forecasting is a key part of proactive project control.
16/05/2025
16.
16
Other Control Issues– Technical & Scope Creep
(Wareesha Zaheer)
•Even with a good plan, projects can face unexpected control issues:
1. Technical Performance:
•Measures whether the technical quality and functionality of the product meets project goals.
•For example: Is the software working as expected? Are all features tested?
2. Scope Creep:
•Happens when new tasks or features are added without approval.
•Increases time, cost, and workload.
•It can reduce project quality if not handled early.
16/05/2025
17.
17
Baseline Changes &Data Collection Problems
(Wareesha Zaheer)
Baseline Changes:
•A baseline is the original plan (time, cost, scope).
•Sometimes due to delays or external issues, the baseline needs to be updated.
•Frequent changes make it hard to track real performance.
Problems in Data Collection:
•High cost of data gathering
•Delayed or missing data
•Incorrect or biased data
•Miscommunication between teams
•Poor data = Poor decisions.
16/05/2025
18.
18
Conclusion
•Projects need constantmonitoring to stay on track.
•Tools like Gantt Charts, Control Charts, and Earned Value help measure progress.
•Forecasting tells us future cost and time problems before they happen.
•We must watch out for scope creep, baseline changes, and technical issues.
•Accurate data and regular status reports are key for project success.
•Good control = Better results, timely delivery, satisfied stakeholders.
16/05/2025


![CH-FOUR [Read-Only].pdfVSGSGJHSJAHGHAHHGHGHHH](https://cdn.slidesharecdn.com/ss_thumbnails/ch-fourread-only-260104165416-0d98d015-thumbnail.jpg?width=640&height=640&fit=bounds)