Download to read offline
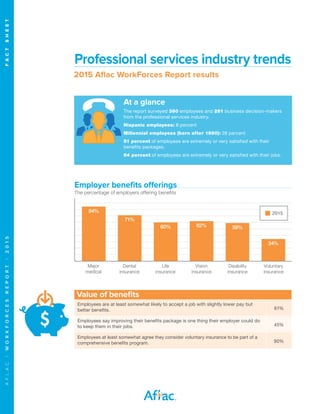
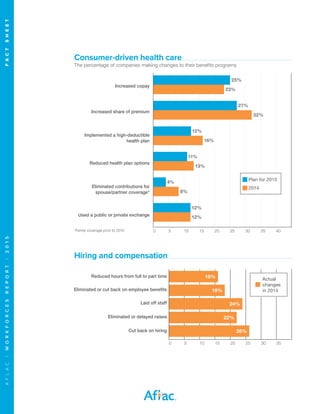
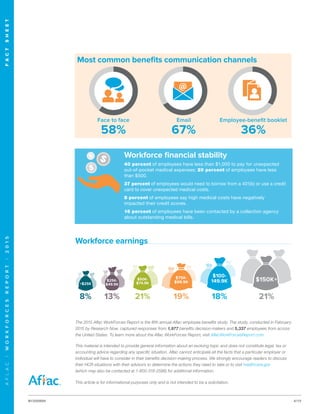

The 2015 Aflac Workforces Report surveyed 380 employees and 261 business decision-makers in the professional services industry, revealing that 51% of employees are satisfied with their benefits, while 61% value improved benefits to retain their jobs. A significant percentage of employers have made changes to their benefits programs in the past year, impacting employee satisfaction and financial stability, with many employees lacking sufficient savings for unexpected medical expenses. The report emphasizes the importance of voluntary insurance as part of comprehensive benefits and provides insights into the communication preferences of employees regarding their benefits.


![Charting a Course for the Future [Infographic]](https://cdn.slidesharecdn.com/ss_thumbnails/preparedfirmsinfographic2015-0163-1-150427155811-conversion-gate02-thumbnail.jpg?width=640&height=640&fit=bounds)


![How To Survive And Thrive In The Era Of Health Reform[1]](https://cdn.slidesharecdn.com/ss_thumbnails/howtosurviveandthriveintheeraofhealthreform1-1344556089601-phpapp01-120809184958-phpapp01-thumbnail.jpg?width=640&height=640&fit=bounds)


