Download as PDF, PPTX
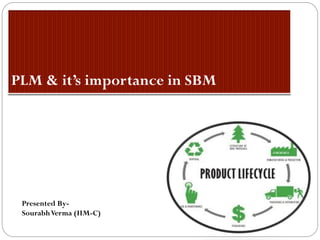


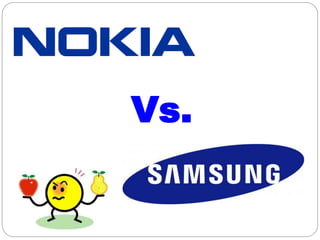
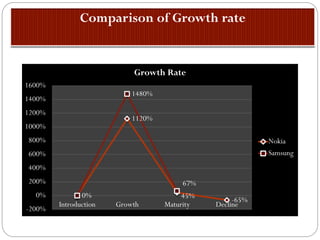
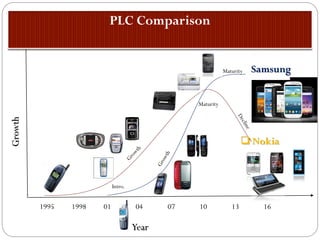
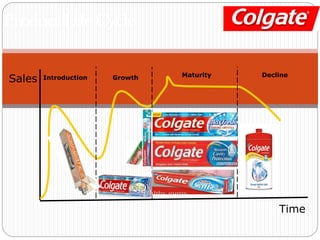


This document discusses the product life cycle stages of Nokia and Samsung mobile phones over time. It notes that Nokia experienced growth in the 2000s but then declined after 2011 as it failed to adapt to changing technologies and competition from Samsung and Apple. Samsung grew its market share after 2006 as it launched a wide range of affordable touchscreen phones and smartphones like the Galaxy series, allowing it to overtake Nokia. The document emphasizes that companies must adjust their strategies to each stage of the product life cycle in order to maximize profits over the lifespan of their products.


