Seismic Applications Throughout the Life of the Reservoir
(C) July 2002 Oilfield Review
Projects: Seismic Reservoir Characterizationusing avo inversion for reservoir characterization
Operators are getting more from their reservoirs by combining high-quality seismic
images with conventional reservoir data. Asset teams use this calibrated seismic
information to gain detailed knowledge of reservoir properties, allowing them to
reduce risk at every stage in the life of their prospects.
Trine Alsos
Alfhild Eide
Statoil
Trondheim, Norway
Donatella Astratti
Stephen Pickering
Gatwick, England
Marcelo Benabentos
Nader Dutta
Subhashis Mallick
George Schultz
Houston, Texas, USA
Lennert den Boer
Calgary, Alberta, Canada
Michael Livingstone
Aberdeen, Scotland
Michael Nickel
Lars Sønneland
Stavanger, Norway
Juergen Schlaf
Phillips Petroleum Company
Stavanger, Norway
Pascal Schoepfer
Petroleum Development Oman
Muscat, Sultanate of Oman
Mario Sigismondi
Juan Carlos Soldo
Pecom Energía de Pérez Companc SA
Neuquén, Argentina
Lars Kristian Strønen
Statoil
Bergen, Norway
For help in preparation of this article, thanks to Mike
Bahorich, Apache Corporation, Houston, Texas, USA; Lee
Bell, Laurence Darmon, Olav Holberg, John Waggoner and
Bob Will, Houston, Texas; Phil Christie, Cambridge, England;
Doug Evans, Malcolm Francis, Michael French, Bob
Godfrey, Kim Hughes and Stephen McHugo, Gatwick,
England; and Ray Pratt, Amerada Hess, Olso, Norway.
ECLIPSE, FrontSim, MultiWave Array and RFT (Repeat
Formation Tester) are marks of Schlumberger.
GeoArabia, Vol. 4, No. 2, 1999
Gulf PetroLink, Bahrain
Best Practices in 3-D Land Seismic Acquisition in the Middle East and North Africa: Cost-Effective Acquisition in a Low Oil Price Environment
(C)Neil McMahon, Arthur D. Little Management Consultants,
(C)Kees Ruitenbeek*, Petroleum Development Oman,
(C)Jan Wams, Shell Compania Argentina de Petroleo S.A.,
(C)Steve Slawson, Continuum Resources International Corporation
(C)GeoArabia, Vol. 4, No. 2, 1999 Gulf PetroLink, Bahrain
A decision to drill an exploration well with the objective to find a new oil or gas field must be based on a sound assessment of the prospect’s risks and of the volumes: what is the chance that a well will find hydrocarbons, and how much could it be? Risk and volume assessments form the basis for decisions to drill a well or not, and as such it is the link between subsurface evaluation and the business aspects of the petroleum industry. This course explains how risks and volumes can be assessed in a realistic and pragmatic manner, based on a sound understanding of the geological details of the prospect as well as of its regional geological setting and our play understanding.
Resource Assessment of Potentially Producible Natural Gas Volumes From the Ma...Marcellus Drilling News
A so-called "study" by discredited peak oil theorist Art Berman on behalf of the New York League of [Liberal Democrat Anti-Drilling] Women Voters. The ladies wanted a study that would say "ain't enough gas at these prices to make it worth fracking for." They got what they asked for. A laughable piece of trash trying to pass as research.
A post conference report for the Offshore Well Control Conference which took place in Houston on May 28 - 29 2014.
Contains delegate overview, testimonials and presentation overviw
Commerce Resources Corp. (TSXv: CCE) is pleased to announce that a reduction in flowsheet processing steps has been confirmed at the pilot scale for the Company's 100% owned Ashram Rare Earth Deposit.
Implementation of 2015 EPA Vapor Intrusion (VI) Guides: Application in State ...Chris Lutes
Lutes, C., L. Lund, C. Holton and M. Bedan “Implementation of 2015 EPA Vapor Intrusion (VI) Guides: Application in State Programs”; AEHS 26th Annual West Coast Conference, March 2016, San Diego.
Oil and gas projects are risky business with significant uncertainties in prices and the ability to produce the forecasted or estimated oil and gas where the revenue created from the commodity is dependent upon the demand, the production and its financial motives for pursuing a project (Inkpen and Moffett, 2011).
PetroSync - Surface Geochemical Exploration for Oil and GasPetroSync
The great majority of oil and gas pools and mature source rocks have recognizable surface geochemical expression. The O&G industry devotes significant time and resources in finding and defining traps, but little or none in establishing the likely presence of hydrocarbon in those traps, especially for older onshore basins.
2. Ulmishek (1986), White (1988, 1993), Demaison
and Huizinga (1991), Magoon (1987, 1988, and
1989, Magoon and Dow (1994). Ultimately, all esti-
mates of value are based on hydrocarbon volumes,
geological risk, and reservoir productivity and per-
formance, which, in turn, are based on the geologi-
cal characteristics of the hydrocarbons present and
the geological nature of the reservoir and trap char-
acteristics. The process, therefore, focuses on esti-
mating the range of resources that may be possible
(what nature has provided), the chances of finding
a hydrocarbon accumulation, and the requirements
for producing the hydrocarbons to add significant
value at an acceptable rate of return.
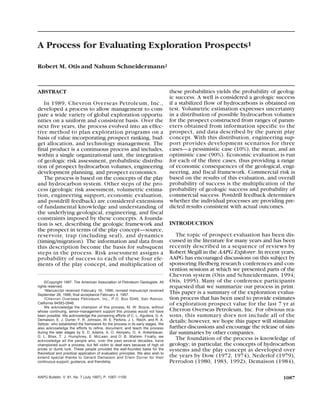
The full process, illustrated in Figure 1, begins
by establishing the play concept, described by
four elements: source rock, reservoir, trap (includ-
ing seal), and dynamics (timing and migration).
Based on this description, geological risk is
assessed, and the probability of finding producible
hydrocarbons is assigned a value between 0.01
and 0.99. At the same time, the volume of hydro-
carbons present is estimated as a probability distri-
bution of recoverable volumes. The engineering
department provides estimates of production pro-
files and facilities and transportation costs, which
are then incorporated with a country economic
model and risk to generate economics that corre-
spond to pessimistic, mean, and optimistic esti-
mates from the distribution. If a decision is made
to go ahead with the project, results are docu-
mented so that predicted and actual outcomes can
be compared, added to the knowledge base, and
used for process improvement.
Methods used in the process are not new. They
are based on pioneering publications by Haun
(1975), Newendorp (1975), White (1980, 1988,
1993), Megill (1984), and Rose (1987, 1992), as
well as in-house work by both Chevron (Jones,
1975) and Gulf. The ideas of hydrocarbon system
and play concept, as well as descriptive tools, are
described fully by Magoon (1987, 1988, 1989),
Magoon and Dow (1994), and Demaison and
Huizinga (1991). The breakdown of geologic risk
into basic risk factors, preparing production pro-
files, estimating facilities and transportation
costs, and developing economic models are prac-
ticed throughout the industry. Probabilistic tech-
niques are well known from elementary probabil-
ity and statistics. The three-point method was
developed by J. E. Warren of Gulf Oil Corporation
in the late 1970s (Warren, 1980–1984, personal
communication) and used in the years before the
Chevron-Gulf merger. The three-point method is
based on an operator for estimating moments of
distributions described by Pearson and Tukey
(1965) and Keefer and Bodily (1983). An
approach similar to Warren’s was also discussed
by Bourdaire et. al. (1985).
This process was introduced to Chevron
Overseas Petroleum, Inc., in mid-1989 and has
since been adopted by the other operating com-
panies upstream in Chevron. Because of its ease
of use, transparency, and the built-in mechanism
of postdrill feedback, the process has been wide-
ly accepted by explorationists and senior manage-
ment to provide consistent, credible estimates of
value that can be used to compare and rank
exploration projects across business unit and
operating company boundaries. The use of this
process to provide risk, volumetric, and econom-
ic input to exploration decision making has all
but eliminated the previous gap between predict-
ed and actual results.
1088 Evaluating Prospects
POSTDRILL
REVIEW
If Success,
Compare Actual
Parameters to
Predicted;
If Failure,
Reason Why
ECONOMIC
ANALYSIS
Cash Flow
Model
and Value
Measures
PLAY CONCEPT
Source Rock,
Reservoir, Trap,
Timing, and
Migration
RISK
Testing a Stabilized
Flow of
Hydrocarbons
ENGINEERING
Conceptual
Development Plan
Facilities Costs
Production Profile
Recovery Factor
VOLUMETRICS
Volumetric Distribution
of Hydrocarbons
(In-Place and Estimated
Recoverable)
DECISION
OPTIMIZATION
953009 fre
DECISION
Figure 1—The
exploration evaluation
process incorporates
specification of geologic
play concept, assessment
of geologic risk,
estimation of
hydrocarbon volumes,
conceptual engineering,
and a development plan
for economic analysis.
The process includes a
feedback loop for
process improvement
based on results of
comparisons between
predrill and postdrill
results.
3. PLAY CONCEPT
The distribution of hydrocarbons in the Earth’s
crust follows a lognormal distribution typical of
many other natural resources. Such a distribution
implies that hydrocarbons are concentrated in rela-
tively few basins, and that exploration is not an
equal-chance game. In our assessment process, we
evaluate four different concepts of exploration as a
function of the degree of knowledge about the spe-
cific project: basin framework, petroleum system
framework, play, and prospect.
Basin Framework
Is there a volume of sedimentary rocks capable
of containing potential ingredients of a working
“hydrocarbon machine”: source, reservoir, trap and
seal, and proper timing and migration? This assess-
ment is a screening device only, and does not
include economic considerations.
Petroleum System Framework
The petroleum system framework is defined as
a volume of sedimentary rocks containing hydro-
carbons and charged by a single source rock. The
definition requires manifestations of hydrocar-
bons (seeps, shows, or a producing well) and is
applicable in many frontier basins only by analogy.
Recognition of an active petroleum system also
serves only as a screening device because it car-
ries no volumetric (and therefore, no economic)
value.
Play
In our definition, the play is the elemental part
of a petroleum system, and is recognized as hav-
ing one or more accumulations of hydrocarbons
identified by a common geological character of
reservoir, trap, and seal; timing and migration;
preservation; a common engineering character of
location, environment, and fluid and flow proper-
ties; or a combination of these. Individual plays,
therefore, have unique geological and engineering
features, and can be used as a basis for economic
characterization.
Prospect
Prospect represents an individual, potential
accumulation. Each prospect is perceived as
belonging to an individual play, characterized by
risk components and a probabilistic range distri-
bution of potential hydrocarbon volumes within
its trap confines.
In frontier areas, geological analogs provide the
best models for assessing the capability of the eval-
uated basin to yield commercial accumulations of
Otis and Schneidermann 1089
Figure 2—The timing risk
chart (Magoon, 1987)
helps to integrate
geological knowledge
and factual information
for risk assessment,
volumetric parameter
ranges, and engineering
considerations.
4. hydrocarbons. In more mature areas, the presence
of a petroleum system has been proven, and the
assessment focuses on play types. Regardless of
the maturity of exploration or the amount of exist-
ing production, however, each prospect requires a
detailed review of the individual risk components.
A timing risk chart (Figure 2), modified from the
original ideas of Magoon (1987), provides a very
useful and user-friendly summary and display of
the play concept.
RISK ASSESSMENT
Within the evaluation process, the risk consid-
ered is geologic risk; i.e., the risk that a producible
hydrocarbon accumulation exists. We consider a
producible accumulation to be one capable of test-
ing a stabilized flow of hydrocarbons. Geologic risk
is assessed by considering the probability that the
following four independent factors of the play con-
cept exist.
(1) Presence of mature source rock (Psource)
(2) Presence of reservoir rock (Preservoir)
(3) Presence of a trap (Ptrap)
(4) Play dynamics (Pdynamics ) or the appropriate
timing of trap formation relative to timing of migra-
tion, pathways for migration of hydrocarbons from
the source to the reservoir, and preservation of
hydrocarbons to the present day.
The probability of geologic success (Pg) is
obtained by multiplying the probabilities of
occurrence of each of the four factors of the play
concept.
If any one of these probability factors is zero, the
probability of geologic success is zero.
Geological success is defined as having a sus-
tained, stabilized flow of hydrocarbons on test. We
do not consider the oil machine to work with only
oil and gas shows or flows of hydrocarbons with-
out pressure stabilization. This definition elimi-
nates very low-permeability reservoirs, reservoirs
of limited areal extent, biodegraded oils, and other
marginal cases that cannot deliver a stabilized flow
of hydrocarbons from the success case. In practice,
this definition has been easily applied to the range
of prospects drilled during the time the process has
been used.
The probabilities that any of the play (or risk)
factors occur are estimated by first analyzing the
information available. The risk assessment checklist
(Figure 3) was designed to assist the earth scientist
in examining as much information as possible. The
checklist has been compiled over several years,
with input from personnel inside and outside of
Chevron to ensure all aspects of each play factor
are considered. The checklist categorizes the four
risk factors with following elements.
The risk assessment worksheet (Figure 4)
records our assessments of the elements of the
risk factors, which are expressed as unfavorable,
questionable, neutral, encouraging, and favorable.
With little or no data, assessment is based on eval-
uating the analogs and the likelihood that the
model will reflect the analog. As data are
acquired, we begin to develop opinions support-
ed by the data. These opinions may be positive
(encouraging or favorable) or negative (question-
able or unfavorable). Factors with equal probabili-
ty of positive or negative outcomes are given a
probability of occurrence of 0.5.
Assessments of encouraging or questionable are
based on indirect data that support or do not sup-
port the model. Examples of indirect data for an
assessment of encouraging include shows, seeps,
and presence of direct analogies. Examples of indi-
rect data for an assessment of questionable include
lack of shows in nearby wells, thin or poor reser-
voirs, and evidence of recent faulting. With indirect
data, we are more dependent on the model than on
the data, and our opinions are supported, but not
confirmed, with data. With indirect data support-
ing the model, probability of occurrence is encour-
aging, with values between 0.5 and 0.7. When indi-
rect data do not support the model, probability of
occurrence is questionable, with values between
0.3 and 0.5.
Assessments of favorable or unfavorable are
based on direct data that tend to confirm or dis-
prove the model. Examples of direct data for an
assessment of favorable include nearby producing
fields or wells with stabilized flows on test,
proven hydrocarbon systems with moderate to
high source potential index (>5, based on high-
quality Rock-Eval data) (Demaison and Huizinga,
1991), and maturation models with parameters
supported by data from nearby wells. Examples
of direct data for an assessment of unfavorable
include dry wells testing similar structures
defined by good-quality seismic, lack of reservoir
in wells, and a hydrocarbon system with very low
source potential index (<2, based on high-quality
Rock-Eval data). With direct data supporting the
model, probability of occurrence is favorable,
with values between 0.7 and 0.99. When direct
data do not support the model, probability of
occurrence is unfavorable, with values between
0.01 and 0.3.
We record our assessments on the worksheet,
and as we complete each factor, we assign a value
corresponding to the key at the bottom of the
P P P P Pg source reservoir trap dynamics= × × ×
1090 Evaluating Prospects
5. Otis and Schneidermann 1091
Figure 3—The risk assessment checklist lists the critical aspects of geologic risk assessment to help ensure all
aspects have been considered.
6. 1092 Evaluating Prospects
Figure 4—The risk assessment worksheet provides a method for transferring qualitative judgments on geologic risk
to quantitative probability of geologic success.
7. worksheet (Figure 4). Note that the probability of
occurrence for each element depends on the least-
favorable assessment.
During the past 5 yr, an understanding of risk
has evolved into five broad categories and general
“rules of thumb” that allow characterization of risk
and reduce impractical arguments over specific
numbers.
(1) Very low risk (Pg between 0.5 and 0.99, bet-
ter than 1:2). All risk factors are favorable. This cat-
egory is associated with wells that test proven plays
adjacent to (<5 km) existing production.
(2) Low risk (Pg between 0.25 and 0.5, between
1:4 and 1:2). All risk factors are encouraging to favor-
able. This category is associated with wells that test
proven plays near (5–10 km) existing production.
(3) Moderate risk (Pg between 0.125 and 0.25,
between 1:8 and 1:4). Two or three risk factors are
encouraging to favorable—one or two factors are
encouraging or neutral. This category is associated
with wells testing new plays in producing basins
or proven plays far from (>10 km) existing produc-
tion.
(4) High risk (Pg between 0.063 and 0.125,
between 1:16 and 1:8). One or two risk factors are
encouraging—two or three factors are neutral or
encouraging to neutral. This category is often asso-
ciated with wells testing new plays in producing
basins far from (>20 km) existing production or
proven plays in an unproved area.
(5) Very high risk (Pg between 0.01 and 0.063,
worse than 1:16). Two to three risk factors are no
better than neutral, with one or two factors ques-
tionable or unfavorable. This category is usually asso-
ciated with wells testing new plays in an unproved
area far from (>50 km) existing production.
This categorization is summarized in Figure 5.
VOLUMETRICS
Oil and gas volumes are expressed as a product
of a number of individual parameters. Because of
uncertainty in the value of each of the individual
parameters, oil and gas volumes can be represent-
ed as a distribution. The distribution is generally
assumed to be lognormal (Capen, 1993). In our
process, the distribution represents the range of
recoverable hydrocarbons (or reserves, in their
most general sense) expected to be found when
the well is drilled, assuming geologic success (sta-
bilized flow of hydrocarbons on test). It is not the
distribution representing the range of commercial
reserves, proven reserves, or any other type of
reserves tied to economic considerations. Note
that we use the term reserves as being inter-
changeable with recoverable volumes throughout
this text based on the general definition of
reserves being “those quantities of hydrocarbons
that are anticipated to be recovered from a given
date forward.” (Journal of Petroleum Technology,
1996, p. 694). We address commerciality during
the economics phase of the process.
One method that can be used to obtain this dis-
tribution of reserves is Monte Carlo simulation. The
distribution is obtained by specifying distributions
for each of the individual parameters and then mul-
tiplying randomly selected values together many
times, thereby creating a highly sampled histogram
that approximates the actual distribution. The
number of estimates (iterations) necessary to
obtain a satisfactory representation of the distribu-
tion ranges from a few hundred to several thou-
sand. Monte Carlo simulation programs are widely
available and the calculation can be done in a
few minutes, depending on the number of itera-
tions used.
Otis and Schneidermann 1093
Same Play
Adjacent Structure
Same Play
Nearby Structure
New Play - Same Trend
Old Play - New Trend
New Play - New Basin
or Play with Negative Data
Avg. Pg= 0.75 Avg. Pg= 0.375 Avg. Pg= 0.183 Avg. Pg= 0.092 Avg. Pg= 0.05
Pg= Probability of Geological Success
VERY
LOW
RISK
LOW
RISK
MODERATE
RISK
HIGH
RISK
VERY
HIGH
RISK
1:2 1:4 1:8 1:16
Producing Area Emerging Area Frontier Area
Delineation Prospect Play Hydrocarbon System
Evaluation FrontierConventional
Figure 5—Risk categorization
of “rules of thumb” for geologic
risk assessment based on
feedback from five years of
drilling history.
8. An alternative method to Monte Carlo simula-
tion was developed by J. E. Warren of Gulf Oil
Corporation (Warren, 1980–1984, personal commu-
nication). This method produces distributions that
are essentially identical to Monte Carlo simulations,
but requires no iterations and no assumptions about
the distributions of the reserve parameters. We call
the method the three-point method; it is explained
in detail in Appendix 1. Briefly, the method uses as
input a range for each parameter by specification of
values corresponding to the 5, 50, and 95% proba-
bility of occurrence. From these ranges, a mean
and variance are estimated for each parameter
using the Pearson-Tukey operator (Pearson and
Tukey, 1965). The means and variances are com-
bined to provide the mean and variance of the
resultant reserve distribution. A lognormal distribu-
tion is assumed for the reserves distribution and
can be calculated from the estimated mean and
variance.
Advantages of this method are the speed of the
calculation, which is essentially instantaneous on
any spreadsheet computer program, and that it has
no requirement for specifying the parameter distri-
bution. The key to success with this method, there-
fore, is correctly specifying the ranges. Guidelines
include the following:
(1) Selecting the 5% value, which is generally
near the minimum value expected. For example,
for porosity the 5% value would be near the mini-
mum porosity observed in nearby wells; for area,
the 5% value would be the area corresponding to
the minimum hydrocarbon column expected.
The explorationist should keep in mind that the
odds of finding a value less than the selection are
1 in 20.
(2) Selecting the 95% value, which is generally
near the maximum value expected. For example,
for porosity the 95% value would be near the maxi-
mum porosity observed in nearby wells; for area,
the 95% value would be the area corresponding
to a maximum hydrocarbon column expected.
Likewise, the explorationist should keep in mind
that the odds of finding a value greater than the
selection are 1 in 20.
(3) Selecting the 50% value, which is generally
near the middle of the expected range of values.
The median is often the most difficult to choose
and requires the support of data associated with
the play or with an appropriate analog. Analogs
should be used with caution. For example, in a
purely continental basin, a partial analog with
lacustrine source and marine reservoir does not
apply. The explorationist should keep in mind that
the odds of finding a value less than the selection
is equal to the odds of finding a value greater that
the selection.
After the ranges for the reserve parameters have
been specified, the mean and variance for the
reserve distribution are calculated. Figure 6 shows
a spreadsheet with an example for a typical small
prospect in a deltaic environment, such as the
Niger Delta or the Mississippi Delta. The input
ranges are as shown, and the output information
includes the mean reserves and cases for a pes-
simistic result (10% or P10) and an optimistic case
(90% or P90). In addition to reserves, the spread-
sheet calculates values for individual reservoir
parameters, including porosity, area, and net pay,
that, when multiplied together, will total the pes-
simistic or optimistic reserve value for use during
the engineering and economics phases of the pro-
cess. These pessimistic and optimistic parameter
values are consistent with the variances specified
by their corresponding input ranges. Note that the
parameter values are not the 10 and 90% values of
the input ranges. Figure 6 also shows the cumula-
tive reserve distribution and values for specific per-
centiles, as well as the mean, median, and mode.
In practice, the mean value for the distribution is
commonly less than the explorationist’s expecta-
tion. At this point it is critical to keep in mind that
this result is the consequence of the input parame-
ter ranges. If the input ranges are based on good
available data, it may be difficult to alter them sig-
nificantly, and the explorationist may have to adjust
expectations. This dilemma can be resolved by
comparing the prospect reserve distribution to
field-size distributions of the play or analogs.
Questions that arise and responses to them often
include the following:
(1) Are the predicted values reasonably consis-
tent with reserves found in analogs to date? If so,
use the numbers obtained from the input parame-
ter ranges.
(2) Are the predicted reserves significantly small-
er or larger than those found in analogs to date? If
yes, then
(3) Are there technical reasons to justify the dif-
ference? If so, use the ranges as stated.
(4) Are technical reasons for the difference lack-
ing? If so, reconsider values assigned in previous
steps and recalculate reserves.
When the final reserve distribution is obtained,
the information from the process moves to the
engineering support and economics stages.
ENGINEERING SUPPORT AND ECONOMICS
The amount of time spent making a conceptual
development plan for an exploration prospect is
minimal. With the small amount of information
available concerning the nature and extent of the
1094 Evaluating Prospects
9. Otis and Schneidermann 1095
Figure 6—Three-point-method spreadsheet illustrates volumetric parameter ranges and shows calculations based
on Pearson-Tukey estimator and the three-point method. M = million.
10. Figure 7—An economic summary sheet provides critical economic and geologic information and provides a
mechanism for estimation of commercial or economic risk. M = million.
11. reservoir (or even if there is a reservoir), fluid prop-
erties, or amount of resource present, our experi-
ence indicates the time and costs of preparing a
detailed development plan for a specific case are
generally not justified. However, significant atten-
tion is given to the credibility of general plans cov-
ering a range of cases that rely heavily on analogs
or nearby producing examples. This approach is
discussed in the following paragraphs.
The first step is to take the mean reserve case
from the volumetric distribution and construct a
“mean” development plan. This plan uses the mean
parameters from the volumetrics and mean param-
eters for reservoir fluid and flow properties to con-
struct a mean production profile. This becomes the
mean case (base case) for which facilities, drilling,
and transportation costs are estimated. From this
information, the revenue profile, based on the pro-
duction profile and a product price assumption; an
investment profile, based on the phasing of drilling,
facilities, and transportation costs; an operating
cost profile, based on an expected opex/bbl as a
function of time; and a miscellaneous expense pro-
file characterize the “mean” development plan and
are used as input for the economic model prepared
for the prospect.
The economic model is then prepared based on
the host country contract, if available. If no con-
tract is available, the economic model is based on
other known contracts or other published infor-
mation pertinent to the country. The economic
model takes as input the production, investment,
operating cost, and miscellaneous profiles and
applies the contract terms, resulting in output
profiles of net income to the company and other
tax-related profiles, such as depreciation, royalty,
and income tax. The model remains flexible; if
negotiations are not complete, the contract usual-
ly becomes a subject of the negotiations and com-
monly changes.
The engineering and economic phases general-
ly require refinement and involve a feedback loop
to mature the mean case. In other words, the
engineer constructs the conceptual development
plan and economics are run. Economic output is
examined, and an optimization loop among earth
scientist, engineer, and economist generally takes
place, resulting in modifications or refinements
to the plan and subsequent economic output.
Modifications are generally applied to facilities and
drilling plans because of preliminary poor econom-
ic indicators. If modifications do not result in eco-
nomics acceptable for a commercial project, the
prospect is generally abandoned at this stage. The
construction of this “mean” development plan gen-
erally takes from 1 day to 2 weeks, depending on
the time available before a decision point and the
information available.
Once the mean case is completed, pessimistic
(P10) and optimistic (P90) cases are run by modify-
ing the mean case input profiles to the economic
model. Modifications are based on the pessimistic
and optimistic reserve cases from the reserve distri-
bution. Economics are run for these two additional
cases, and a range of economic outcomes is estab-
lished. Volumetrics, development and contract
assumptions, and economic results are summarized
on a 1-page summary data sheet, as shown in Figure
7. The basic layout of the summary is a synopsis of
terms, development assumptions, and a range of
volumetric parameters and their impact on eco-
nomic results. Two graphs are displayed that show
(1) the volumetric distribution, both cumulative and
density, and (2) the resultant ROR (rate of return) for
the unrisked case and several risked cases. From
these graphs, one can easily see the economic con-
sequences of the expected distribution of reserves,
development plans associated with that distribution,
and the contract. Additional information, such as
NPV (net present value) and NCF (net cash flow), is
Otis and Schneidermann 1097
RISK
NUMBEROFWELLS
2
4
6
8
10
1:2 1:4 1:6 1:8 1:10 1:12 1:16 >1:16
0
1:14
Figure 8—A risk histogram of
evalution wells, 1989–1990,
illustrates predicted and actual
results for feedback into the risk
assessment process.
13. also plotted at the P10, mean, and P90 cases to illus-
trate results for those parameters as well.
Given the range of possible outcomes for the vol-
umetrics and their economic consequences, an esti-
mate of commercial risk is easily determined. Given
the conditions of commerciality, usually a minimum
ROR, the probability of a commercial prospect can
be read directly from the two graphs. In Figure 7, if a
20% ROR is considered a minimum for a commercial
project, from the bottom graph a 20% ROR corre-
sponds to a reserve of 11 MBO (million barrels of
oil). From the top graph, 11 MBO corresponds to a
50% probability of finding that reserve or more.
Thus, the probability of commercial success is
approximately 50%. This will vary from prospect to
prospect, but this link is the fundamental driver for
this process. In other words, we need to understand
what nature has provided, which is the volumetric
distribution that describes what we might find when
we drill the well. We must also understand the eco-
nomic consequences; that is, what nature has pro-
vided may or may not yield satisfactory economics.
Analysis of both geologic and commercial risk in this
manner allows appropriate decisions regarding risk
tolerance and potential reward.
POSTDRILL REVIEW
Postdrill information is primarily used as feed-
back to the risk assessment and volumetric estima-
tion phases of the process. Feedback to the engi-
neering and economics sections generally does not
occur within a time frame that can impact the pro-
cess. In other words, by the time a discovered field
is developed and feedback is obtained, the process
has already changed because of other, more timely,
reasons.
Postdrill information is obtained from a postdrill
well review conducted within a few months after
completing the well. Data analyses are collected
and reviewed to (1) determine reasons for failure if
the well is unsuccessful, (2) compare predicted
and actual reserves parameters if the well is suc-
cessful, and (3) review lessons learned regardless of
the result. Individual postdrill well reviews are
compiled on an annual basis to provide statistical
feedback, using simple histograms for both risk
assessment and volumetric estimation.
The first tool is the risk histogram, a simple plot
of well results vs. risk expressed as a fraction of
probability of success. Figure 8 shows a risk his-
togram from an actual 1989–1990 drilling program
of wells drilled in producing areas on producing
plays (evaluation wells). As is evident from the plot,
the bulk of the wells had predrill probability of geo-
logical success between 1:3 and 1:6 (30–15%).
From the histogram, it was immediately obvious
that the number of successful wells is inconsistent
with the assessed risk. For those wells with
assessed risk of 1:2, or 50%, 100% of the wells were
successful. For those wells with assessed risk of
1:3, or 33%, 87% of the wells were successful, and
so on. In fact, the average success rate for all wells
drilled was 50% rather than the 20–25% predicted
by the mode of the histogram.
For this type of well (proven play in a producing
area), our first modification to the process was to
modify our process of assessing risk to better
reflect our actual success rate. Figure 9 shows the
risk histogram for each of the subsequent years
(1991–1994). Although our efforts to more correct-
ly assess risk were not immediately successful, over
the 4-yr period improvement is evident, and by
1994 our predicted success rate is more consistent
with that observed.
As a side note, examining drilling results prior to
1989 indicated a similar trend. The success rate for
wells drilled on proven plays in producing areas is
about 50%, or 1:2, whereas the predicted rate was
about 0.3–0.2, or 1:3 to 1:5. However, no attempt
was made to adjust risk assessment methods until the
process was implemented in 1989. Apparently, every-
one knew the answer, but without a methodical,
Otis and Schneidermann 1099
Reserves (MBO)
ProbabilityofFinding
ReservesLessThan(%)
80
100
20
60
40
0
100 200 3000
Actual Reserves,
190 MBO,
corresponds to
64th percentile
Predrill Reserve Distribution Figure 10—Predicted distribution
of reserves with actual results at
the indicated percentile. In this
case, the actual reserves of 190
MBO fell on the 64th percentile of
the distribution.
14. periodic performance review, little was done to
modify the process. Thus, the feedback step is
considered critical to the success of any process;
without it, no process will be modified and
improved.
Volumetric estimation feedback is somewhat
more complicated because it requires a method to
determine whether distributions are being accu-
rately estimated. Our volumetric feedback process
consists of two steps. The first step is to determine
whether reserve distributions are accurate. The
second step is to determine whether the individual
reserve parameters are accurate. The method is the
same for both steps and uses a second tool, the per-
centile histogram. The percentile histogram is con-
structed in the following way.
Given a set of successful wells, each with a pre-
dicted distribution of reserves, calculate the proba-
bility of occurrence for the actual reserves on the
predicted parameter distribution. For example, in
Figure 10 a predicted distribution of reserves is
shown where the actual reserves of 190 MBO cor-
respond to the 64% probability of occurrence.
Extending this to the set of four wells, as shown in
Figure 11, the percentiles of the actual reserves on
the predicted reserve distributions 1–4 are 25, 75,
21, and 91%, respectively. If these probabilities of
occurrence for the four distributions are plotted as
a histogram of occurrences in the ten dectiles (ten
10% intervals), the result is a percentile histogram,
also shown in Figure 11.
The percentile histogram can be used to diag-
nose a variety of problems, as shown in Figure 12.
The desired response is “flat.” In other words, if
we are estimating distributions correctly there is
an equal probability that the actual reserves will
fall within any one of the ten dectiles (ten 10%
intervals). It is analogous to rolling a ten-sided
die, because each side (a 10% interval) has an
equal probability of occurrence. Diagnostics are
relatively simple. If the histogram is heavy to the
low, or downside, we are tending to overestimate
potential. In other words, most of the actual
results are on the downside of the distribution. If
the histogram is heavy to the high, or upside, the
opposite is true; most of the actual results are on
the upside of the distribution, indicating a ten-
dency to underestimate reserves. If the histogram
is heavy on the ends and light in the middle,
prospect reserve ranges are too narrow and need
to be broadened. If the histogram is heavy in the
middle, ranges need to be reduced.
Figure 13 shows the percentile histogram for
reserves for Chevron Overseas Petroleum, Inc.,
in 1989–1990. The histogram is heavy to the
downside; thus, we had overestimated potential
in the majority of cases and needed to account
for the large number of small discoveries we had
made. We knew we had to correct this problem,
but the primary cause required additional analy-
sis. To determine what was causing the overesti-
mation of reserves, we applied the same method
1100 Evaluating Prospects
80
6
20 40 60 100
4
2
0
0
25 50 750 100
100
50
0
100
50
20 40 60
0
0 80 100 2000 300 400
100
50
0
2010 300 40
100
50
0
100
50
0
Percentile Histogram
Number of Occurrences
31 MBO
25%
250 MBO
75%
9 MBO
22%
75 MBO
91%
Figure 11—Example of percentile histogram with four predicted distributions and actual results. This histogram is
used to calibrate estimation of predrill volumetric parameters with actual results.
15. to individual parameters. The percentile histograms
for the individual parameters are shown in Figure
14. The following observations were made:
(1) Estimates for gross pay and area were consis-
tently overestimated.
(2) Estimates of net-to-gross ratio (N:G), porosity,
hydrocarbon saturation, and formation volume fac-
tor (FVF) were too narrow.
(3) The geometry factor was not being estimated
correctly.
Modifications were made to tie ranges of gross
pay and area to the expected hydrocarbon column.
Research indicated columns associated with previ-
ous ranges of gross pay and areal extent were
grossly overestimated, so considerable attention
was given to hydrocarbon columns expected for
different seals, especially fault seals. Other modifi-
cations included widening ranges for N:G, porosity,
hydrocarbon saturation, and formation volume fac-
tor, as well as introducing a different approach to
estimating geometry factor.
Figure 15 shows the reserve histogram and
Figure 16 shows the parameter histograms for
1993–1994. The reserves and all parameters have
percentile histograms that are within the statistical
tolerance of being acceptable for the number of
samples, and it is obvious they are being estimated
with improved accuracy. The histograms are much
closer to the desired “flat” response.
Based upon this feedback for both risk assess-
ment and volumetric estimation, we observed a dis-
crepancy between predicted and actual results,
analyzed the data to determine where improve-
ments could be made, implemented those changes,
and observed a favorable response when predicted
and actual results were in better agreement. The
feedback was absolutely necessary to establish
credibility and build support for the continued use
of the process.
CONCLUSION
Since its inception in 1989, application of this
process has resulted in a consistent method of
assessing risk, estimating volumes of hydrocarbons,
and, thus, calculating economic indicators that can
be used to judge the potential of exploration
prospects. Through yearly feedback and modifica-
tions, credibility has improved, and the process has
been accepted by Chevron upstream operating
companies as a basis to assess the potential of
opportunities in Chevron’s worldwide exploration
prospect inventory. The process is used routinely
in international exploration activities and has been
the subject of numerous training sessions with
partners and host countries.
Otis and Schneidermann 1101
•Skewto
lowside
•Distributiontoo
optimisticon
downside
•Satisfactoryon
upside
•Skewto
highside
•Distributiontoo
pessimisticon
upside
•Satisfactoryon
downside
•Bimodalon
low-and
highsides
•Distributionis
toonarrow
•Center
weighted
•Distributionis
toowide
•Desired
uniform
distribution
•Distributions
aresatisfactory
Figure12—Examplesofpercentilehistogramswithdiagnosticinterpretations.
16. 1102 Evaluating Prospects
Figure 13—Actual
percentile histogram
for years 1989–1990.
Diagnostics indicate
distribution estimates
were too optimistic on
downside uncertainty
(downside and median
estimates were too large).
Figure 14—Actual percentile histograms for parameters of reserve distribution for years 1989–1990. Note problems
with area, gross pay, geometry factor, porosity, and hydrocarbon saturation.
17. Otis and Schneidermann 1103
Figure 15—Actual
percentile histogram for
years 1993–1994 after
modifications to process.
Note distributions are more
consistent with desirable
uniform distribution.
Figure 16—Actual percentile histograms for parameters for years 1993–1994 after modification to process. Note
problems have essentially been eliminated and distributions are consistent with desirable uniform distribution.
18. APPENDIX 1: THREE-POINT METHOD
The three-point method, as developed by J. E. Warren
(1980–1984, personal communications) for reserve estimation,
uses the general equation shown below, which combines individ-
ual parameters in calculating recoverable reserves, R.
where A = areal extent of prospect in acres, h = average net pay in
feet, f = average porosity, Sh = hydrocarbon saturation (1 – Sw,
where Sw = water saturation), Boi = initial oil formation volume fac-
tor in reservoir barrels/stock tank barrels (STB), Bgi = initial gas for-
mation volume factor in reservoir cubic feet/surface cubic feet, Rfo
= recovery factor for oil, Rfg = recovery factor for gas, CR = con-
densate recovery factor in STB/ft3, 7758 = conversion factor from
acre-feet to barrels, and 43560 = conversion factor from acre-feet
to cubic feet.
The parameters are combined by multiplication; therefore, if
the parameters are assumed to be probabilistically independent,
the reserve distribution, R, will be lognormal in the limit as provid-
ed by the central limit theorem. Likewise, the first and second
moments of R [m(R) and m2(R)], respectively, will be the product
of the first and second moments of the parameter distributions,
respectively, as shown. Note that the first moment of the distribu-
tion is the mean.
(1)
m R oil 7758 m A m h m
m S
h
m 1 B m Roi fo
( )[ ]= × ( )× ( )× ( )×
( )× ( )× ( )
φ
R(condensate) 4 A h S 1 B R CRh gi fg= × × × × × ( )× ×3560 φ
R(gas) 4 A h S 1 B Rh gi fg= × × × × × ( )×3560 φ
R(oil) 7758 A h S 1 B Rh oi fo= × × × × × ( )×φ
1104 Evaluating Prospects
Figure 17—Step 1 of three-point method for calculating reserve distributions: specify parameter ranges. M = million.
19. (2)
With the first and second moments of R, the lognormal
reserve distribution is completely specified. Even if probabilis-
tic independence is not strictly valid, the results are a useful
approximation, given the level of information generally avail-
able to an exploration project. In practice, the uncertainty in
specifying the ranges of input parameters is far greater than the
amount of uncertainty introduced by assuming parameter inde-
pendence.
The first and second moments of R are calculated using equa-
tions 1 and 2 and estimates of the first and second moments of the
input parameter distributions. These estimates are obtained using
the Pearson-Tukey estimator (Pearson and Tukey, 1965; Keefer
and Bodily, 1983). An example for the area, A, is
where P5 = the 5% probability of occurrence of the area distribu-
tion, P50 = the median of the area distribution, and P95 = the 95%
probability of occurrence of the area distribution.
m A 0.185 P5 A 0.63 P50 A 0.185 P95 A2( ) = × ( ) + × ( ) + × ( )2 2 2
m A 0.185 P5 A 0.63 P50 A 0.185 P95 A( ) = × ( )+ × ( )+ × ( )
m R oil 7758 m A m h m
m S
h
m 1 B m R
2 2 2 2
2 2 oi 2 fo
( )[ ]= × ( )× ( )× ( )×
( )× ( )× ( )
φ
Otis and Schneidermann 1105
Figure 18—Step 2 of three-point method for calculating reserve distributions: calculate parameter means and vari-
ances. M = million.
20. The Pearson-Tukey estimator is used because of its robustness
in estimating mean values from a wide variety of nonsymmetric
distributions, including the popularly used triangular distribution.
Thus, the estimated mean values estimated are not restricted to
any assumptions of distribution, such as those necessary for a
Monte Carlo simulation, and allow the Earth scientist a reasonable
amount of freedom in choosing the input values for the P5, P50,
and P95 estimates.
At this point it is useful to introduce a more convenient param-
eterization, ∂2, the variance of the natural logarithm of R. ∂2 is cal-
culated using the following formula.
It is easy to show that the variance of the natural logarithm of R
is the sum of the ∂2 of the individual parameters. Thus,
∂ ∂ ∂ ∂ φ
∂ ∂ ∂
2 2 2 2
2
h
2
oi
2
fo
R oil A h
S 1 B R
( )[ ]= ( )+ ( )+ ( )+
( )+ ( )+ ( )
∂2
= ( ) ( )[ ]ln m R m R2
2
1106 Evaluating Prospects
Figure 19—Step 3 of three-point method for calculating reserve distributions: calculate mean and variance of
reserve distribution. M = million.
21. and any percentile value of the lognormal distribution can be cal-
culated using the formula
where P50(R) = m(R) * e-0.5∂2 (the median of the distribution), x
= the probability of occurrence desired, z(x) = the value or z-
factor corresponding to the x-percentile of the standard normal
distribution (obtained from tables given in most probability text-
books).
Figures 17–20 show a spreadsheet with the example from the
text and illustrate the calculation process.
Step 1: Specify the parameter ranges.
Step 2: Calculate a mean and ∂ (variance) for each parameter.
Step 3: Multiply the parameter means and sum the ∂ to obtain
the mean and ∂ of the reserve distribution.
Step 4: Calculate values for different probabilities of occurrence
as listed in the table and plotted on the cumulative distribution.
R P50 R ex
z x
= ( )× ( )∂
Otis and Schneidermann 1107
Figure 20—Step 4 of three-point method for calculating reserve distributions: calculate values for different probabil-
ities of occurrence. M = million.
22. REFERENCES CITED
Bourdaire, J. M., R. J. Byramjee, and R. Pattinson, 1985, Reserve
assessment under uncertainty—a new approach: Oil & Gas
Journal, June 10, v. 83, no. 23, p. 135–140.
Capen, E. C., 1993, A consistent probabilistic approach to reserves
estimates: Society of Petroleum Engineers Hydrocarbon
Economics and Evaluation Symposium, SPE Paper 25830,
p. 117–122.
Demaison, G., 1984, The generative basin concept, in G. Demaison
and R. J. Murris, eds., Petroleum geochemistry and basin evalua-
tion: AAPG Memoir 35, p. 1–14.
Demaison, G., and B. J. Huizinga, 1991, Genetic classification of
petroleum systems: AAPG Bulletin, v. 75, p. 1626–1643.
Dow, W. G., 1972, Application of oil correlation and source rock
data to exploration in Williston basin (abs.): AAPG Bulletin,
v. 56, p. 615.
Dow, W. G., 1974, Application of oil correlation and source rock
data to exploration in Williston basin: AAPG Bulletin, v. 58,
no. 7, p. 1253–1262.
Haun, J. D., ed., 1975, Methods of estimating the volume of undis-
covered oil and gas resources: AAPG Studies in Geology 1, 206 p.
Jones, R. W., 1975, A quantitative geologic approach to prediction
of petroleum resources, in J. D. Haun, ed., Methods of estimat-
ing the volume of undiscovered oil and gas resources: AAPG
Studies in Geology 1, p. 186–195.
Journal of Petroleum Technology, 1996, SPE/WPC draft reserves
definitions: Journal of Petroleum Technology, v. 48, no. 8,
p. 694–695.
Keefer, D. L., and S. E. Bodily, 1983, Three-point approximations
for continuous random variables: Management Science, v. 29,
no. 5, p. 595–609.
Magoon, L. B., 1987, The petroleum system—a classification
scheme for research, resource assessment, and exploration
(abs.): AAPG Bulletin, v. 71, p. 587.
Magoon, L. B., 1988, The petroleum system—a classification
scheme for research, exploration, and resource assessment, in
L. B. Magoon, ed., Petroleum systems of the United States: U.S.
Geological Survey Bulletin 1870, p. 2–15.
Magoon, L. B., 1989, The petroleum system—status of research
and methods, in L. B. Magoon, ed., The petroleum system—
status of research and methods, 1990: U. S. Geological Survey
Bulletin 1912, p. 1–9.
Magoon, L. B., and W. G. Dow, eds., 1994, The petroleum sys-
tem—from source to trap: AAPG Memoir 60, 655 p.
Megill, R. E., 1984, An introduction to risk analysis: Tulsa,
Oklahoma, PennWell Books, 274 p.
Nederlof, M. H., 1979, The use of habitat of oil models in explo-
ration prospect appraisal: Proceedings of the 10th World
Petroleum Congress, p. 13–21.
Newendorp, P. D., 1975, Decision analysis for petroleum explo-
ration: Tulsa, Oklahoma, PennWell, 668 p.
Otis, R. M., 1995, Five year look back at risk assessment and esti-
mation of hydrocarbon volumes (abs.): AAPG 1995 Annual
Convention Program, p. 73A.
Otis, R. M. and N. Schneidermann, 1994, A process for valuation of
exploration prospects (abs.): AAPG 1994 Annual Convention
Program, p. 228.
Pearson, E. S., and J. W. Tukey, 1965, Approximate means and
standard deviations based on distances between percentage
points of frequency curves: Biometrika, v. 52, no. 3–4,
p. 533–546.
Perrodon, A., 1980, Géodynamique pétrolière. Genèse et répartition
des gisements d’hydrocarbures: Paris, Masson-Elf Aquitaine, 381 p.
Perrodon, A., 1983, Dynamics of oil and gas accumulations: Pau,
Elf Aquitaine, p. 187–210.
Perrodon, A., 1992, Petroleum systems: models and applications:
Journal of Petroleum Geology, v. 15, no. 3, p. 319–326.
Rose, P. R., 1987, Dealing with risk and uncertainty in exploration:
how can we improve?: AAPG Bulletin, v. 77, no. 3, p. 485–490.
Rose, P. R., 1992, Chance of success and its use in petroleum
exploration, in R. Steinmetz, ed., The business of petroleum
exploration: AAPG Treatise of Petroleum Geology, Handbook
of Petroleum Geology, p. 71–86.
White, D. A., 1980, Assessing oil and gas plays in facies-cycle
wedges: AAPG Bulletin, v. 64, no. 8, p. 1158–1178.
White, D. A., 1988, Oil and gas play maps in exploration and
assessment: AAPG Bulletin, v. 72, no. 8, p. 944–949.
White, D. A., 1993, Geologic risking guide for prospects and plays:
AAPG Bulletin, v. 77, p. 2048–2061.
1108 Evaluating Prospects
23. Otis and Schneidermann 1109
Robert M. Otis
Bob Otis is supervisor for Cabin-
da B/C Exploration, Chevron Over-
seas Petroleum, Inc. Previous
Chevron experience includes man-
ager, exploration evaluation divi-
sion, coordinator Argentina explo-
ration, and coordinator Middle
East exploration. Before joining
Chevron, Bob worked one year for
the Western Division of Sohio
(California and Alaska) and eight years for Mobil in Gulf
Coast and Alaska exploration. He received a B.S. degree
in 1969 and a Ph.D. in 1975, both from the University of
Utah.
Nahum Schneidermann
Nahum Schneidermann is direc-
tor of international technical rela-
tions, executive staff, Chevron
Overseas Petroleum, Inc., San
Ramon, California. A native of
Zayadin, former Soviet Union
(now Uzbekistan), Schneidermann
received his bachelor’s and mas-
ter’s degrees from the Hebrew
University of Jerusalem, Israel, in
1967 and 1969, respectively, and
his Ph.D. from the University of Illinois, Urbana, Illinois,
in 1972. His career in the industry started in 1974 with
Gulf Oil, where he held various positions at the
Houston Technical Services Center. In 1985 he started
his tenure with Chevron Overseas Petroleum in San
Ramon, serving as manager, basin studies and geochem-
istry, for the exploration department prior to being
named to his present position.
ABOUT THE AUTHORS