Download to read offline

![© 2016 Cisco and/or its affiliates. All rights reserved. 1
Where to Begin Your Journey to Digital Value in the Private Sector
Economic Analysis
2015-2024
Introduction
In late 2012, Cisco sought to calculate the value opportunity for
private sector organizations in the burgeoning digital economy. This
digital value is driven by the networked connections of people,
process, data, and things, currently powered by an estimated 18
billion1
connected devices globally—a number expected to reach 50
billion by 2020.2
In the initial study, Cisco estimated that $14.4 trillion
of digital value would be “at stake” across private
sector industries from 2013 to 2022. This Digital
Value at Stake is based on two components: 1)
entirely new sources of value emanating from digital
investments and innovations, and 2) value shifting
among companies and industries based on their
ability (or inability) to harness digital capabilities (in
essence, value moving from “losers” to “winners”).
The digital landscape has changed dramatically in
the three years since we conducted the original
private sector study. For example:
• Digitization is disrupting and redefining
industries. According to a 2015 study by the
Global Center for Digital Business Transformation,
an IMD and Cisco initiative, digital disruption will
displace nearly 4 of the top 10 incumbents by
industry over the next five years. The technology,
media & entertainment, retail, and financial
services industries have already been particularly
disrupted by digitization over the past few years.3
• Adoption of digital solutions is accelerating.
Ninety-five percent of the Fortune 1000 expects
to undertake a digital project by 2017.4
• Digital technologies are becoming more mature
and pervasive. Many digital solutions and use
cases considered “ahead of their time” three
years ago are now becoming realities in the
private sector.[ ]
• New, digitally driven business models are
changing the nature of competition. Digital
capabilities enable organizations to “recombine”
traditional means of providing customer
value, creating entirely new business models.
Organizations like Apple, Uber, and Tesla have
used this “combinatorial disruption” approach to
launch competitive threats across industry lines.](https://image.slidesharecdn.com/1e798397-18e1-4056-8eb0-b259aaba446c-160219001243/75/Private-Sector-Digital-Value-at-Stake-4-2048.jpg)
![2© 2016 Cisco and/or its affiliates. All rights reserved.
Where to Begin Your Journey to Digital Value in the Private Sector
Economic Analysis
2015-2024
• The consumer sector is now driving significant digital value. It’s
not just about B2B anymore—consumer-focused digital solutions
represent a significant portion of Digital Value at Stake across
industries in 2015.[ ] For example, the wearables market exceeded
$1.5 billion in 2014, double its value in 2013.5
These and other advances prompted Cisco to revisit our initial
estimates to reflect the exponential changes that are reshaping the
digital economy.
Because the digital market has grown with the advent of new
business models and innovative technologies, the new analyses
are considerably broader and deeper than the work from 2012-
2013. For example, our original private sector Digital Value at Stake
estimates were based on a total of 21 “use cases”—specific vertical
and “horizontal” (cross-industry) applications of digital capabilities that
deliver value. Our new analysis incorporates more than 350 digital use
cases spanning 16 industries—and also includes 11 horizontal use
cases (for example, next-generation knowledge workers, payments,
supply chain, cybersecurity, and smart grid).
The use cases in this latest study are based on more than three years
of in-depth engagements with Cisco customers regarding how best
to drive value by digitizing their businesses. In addition to addressing
the business value of the various use cases, this study goes one
step further by helping CIOs understand the foundational capabilities
on which they should focus to fund and create a more agile digital
infrastructure.
The new analysis offers other elements, including research on best
practices along with specific value estimates rather than the value
ranges employed by other firms. The results can help private sector
firms pinpoint where to begin their digital journeys.
This private sector overview sets the stage for a series of industry-
specific analyses in 2016 that will provide detailed roadmaps for digital
success in both the private and public sectors.
Moving at the Speed of Digital
Three years ago, we began our analysis by stating that digital
(the “Internet of Everything”) “is happening now,” followed by an
explanation of the tremendous potential awaiting organizations that
“connect the unconnected.”
What a difference three years make.
Not only is digital “happening” in 2015—digital disruption now has
the potential to overturn incumbents and reshape markets faster than
perhaps any force in history.[ ]
For this reason, Cisco and the International Institute for Management
Development (IMD) recently launched a joint, five-year initiative—the
Global Center for Digital Business Transformation (DBT Center)—
to help organizations map out their digital strategies. According
to a recent DBT Center study, the time to digital disruption for
A C-suite Concern
For more insights, please visit
cs.co/vascsuite](https://image.slidesharecdn.com/1e798397-18e1-4056-8eb0-b259aaba446c-160219001243/75/Private-Sector-Digital-Value-at-Stake-5-2048.jpg)
![3© 2016 Cisco and/or its affiliates. All rights reserved.
Where to Begin Your Journey to Digital Value in the Private Sector
Economic Analysis
2015-2024
most industries is a mere three years.6
Here are just some of the
technology-driven developments contributing to digital disruption:
• The wearables market exceeded $1.5 billion in 2014, double its
value in 2013.7
• At the end of 2014, the number of people using the mobile Internet
reached 2.4 billion. This
is expected to rise to 3.8 billion by 2020,
driven by growth in developing countries.8
• Webpage views from mobile phones now outnumber those from
PCs in 48 countries.9
• The number of cars connected to the Internet worldwide will grow
more than sixfold, from 23 million in 2013 to 152 million in 2020.10
• The global mobile health and sensor market will grow at 40 percent
CAGR between 2013 and 2018.11
• More than two-thirds of consumers plan to buy connected
technologies for their homes by 2019. Smart thermostats are
expected to have 43 percent adoption in the next five years.12
Despite these sweeping changes and their vast potential to upend
the competitive landscape, nearly half (45 percent) of companies
still do not view “digital disruption” as a board-level concern. What’s
more, only 25 percent describe their approach to digital disruption as
proactive—willing to disrupt themselves to compete.13
(See Figure 1.)
“Disrupting yourself” does not mean discarding what has made you
successful or mimicking in-vogue digital tactics.[ ] Rather, it involves
challenging the assumptions that have underpinned that success, and
stress-testing the ways in which you deliver value to customers. It
means changing the organization itself, including its operations, culture,
revenue model, technology maturity, and skill sets—in fundamental
ways, and perpetually.
As explained earlier, Digital Value at Stake encompasses both new
value creation and value that shifts among companies and industries.
43%
25%
Does not
recognize or is
not responding
appropriately
Actively
responding
by disrupting
our own
business
of respondents say
digital disruption
is NOT
a board-level
concern
45%
941 business leaders around the world in 12 industries were surveyed
In general, what is the attitude of your company’s
leadership toward digital disruption?
survey
Q
32%Taking
“follower”
approach
Most Firms Are Not Taking Proactive Steps Toward Digital Transformation
Figure 1
Source: Global
Center for
Digital Business
Transformation,
2015](https://image.slidesharecdn.com/1e798397-18e1-4056-8eb0-b259aaba446c-160219001243/75/Private-Sector-Digital-Value-at-Stake-6-2048.jpg)
![4© 2016 Cisco and/or its affiliates. All rights reserved.
Where to Begin Your Journey to Digital Value in the Private Sector
Economic Analysis
2015-2024
Our latest analysis shows that 62 percent of private sector Digital
Value at Stake will arise from new value creation across industries from
2015-2024, while 38 percent will come from value shifts—in essence,
value moving from “the disrupted” to “the disruptors.”[ ]
Industries Are Leaving Value on the Table
How much of their potential Digital Value at Stake did private sector
industries actually realize in 2015 (the first year of our 10-year
window) as a function of their current digital capabilities?
Across all 16 private sector industries evaluated, our analysis shows
that in aggregate, firms were on track to realize just $1.3 trillion (20
percent) of their potential Value at Stake in 2015. In other words,
private sector companies failed to capture $5.3 trillion, or 80 percent,
of their total potential Digital Value at Stake in year one of the period
covered by our new analysis (2015-2024).[ ]
Industries realizing the highest percentage of their potential Digital
Value at Stake tend to share two characteristics: 1) they are IT-
intensive, both in terms of the types of products and services they
deliver and how they are delivered; and 2) they also display greater
convergence between the IT and operational technology (OT)
components of their businesses. These firms rely on consistent
technology and process innovation to compete.
As shown in Figure 2, firms in IT-intensive industries such as financial
services and information services/service provider realized a higher
percentage of their Digital Value at Stake in 2015 than firms in less-IT-
intensive industries. Financial services companies realized 29 percent
($236 billion) of the Digital Value at Stake available to them in 2015,
while information services/service providers captured 21 percent.
0% 1% 2% 3% 4% 5% 6% 7%
0%
5%
10%
15%
20%
25%
30%
Financial
Services
Oil & Gas
Retail
Transportation
& Logistics
Utilities
IT Intensity (IT Spend % of Revenues)
ValueRealizedin2015(%)
Construction
& EPCM
Mining
Manufacturing
Education
Healthcare
Other
Business
Services
Information & SP
High value realized,
high IT spend
High value realized,
IT/OT convergence
Financial Services Led All Other Industries in 'Value Realized' During 2015
Figure 2
Source:
Cisco, 2015](https://image.slidesharecdn.com/1e798397-18e1-4056-8eb0-b259aaba446c-160219001243/75/Private-Sector-Digital-Value-at-Stake-7-2048.jpg)
![5© 2016 Cisco and/or its affiliates. All rights reserved.
Where to Begin Your Journey to Digital Value in the Private Sector
Economic Analysis
2015-2024
By contrast, less-IT-intensive industries such as mining (10 percent)
and utilities (14 percent) fell at the lower end of the “value realized”
ranking.
Industries such as oil and gas (27 percent value realized) and
manufacturing (24 percent) performed better than many others
because of their relatively high convergence of IT and OT (although,
like many industries, both still have work to do in this regard).
Conversely, the relatively low digital value realized by mining, utilities,
and transportation reflects those industries’ slower adoption of IT/
OT convergence. IT/OT convergence is critical for any firm wanting
to maximize the “people, process, and data” elements of digital
solutions. When this convergence doesn’t occur, IT/OT “silos” hamper
potential digital capabilities in critical areas such as collaboration, data
integration and analytics, and cybersecurity.
For example, the ability for analytics to generate actionable business
insights is largely dependent on the information available for analysis.
Too often in the oil and gas industry, however, organizational “silos”
deny or limit access to this information—severely curtailing the
potential impact of data analytics for many firms. Nearly two-thirds of
respondents to an Accenture survey indicated
that their firms continue
to manage analytics by specific function or department, preventing
an integrated approach for end-to-end workflows throughout the
company’s operations.14
Cybersecurity Is Essential
To capture their share of Digital Value at Stake, private sector firms
must build cybersecurity into their digital solutions as a foundational
element, rather than trying to “bolt it on” as an afterthought.
In fact, many of the use cases detailed in our analysis depend heavily
on the ability to make security and privacy guarantees to customers,
partners, and other players in the overall digital ecosystem. For
example, retailers can significantly improve customer experience by
using analytics to provide “hyper-relevant” services and products,
precisely when and where they’re needed. If a particular retailer has
suffered a data breach, however, customers won’t feel comfortable
about sharing the level of personal information required to offer these
experiences both in-store and online. As a result, they’ll switch to a
retailer that can—a prime example of value shifting from one firm to
another.
Based on detailed economic analysis of 350 private sector use cases,
we estimate that cybersecurity will drive $5.3 trillion in Digital Value
at Stake across private sector industries over the next decade.[ ] A
third of this estimate ($1.7 trillion) applies to protection of intellectual
property and avoidance of data breach costs. The vast majority,
however ($3.6 trillion), is dependent upon organizations’ ability to
improve their cybersecurity practices in order to drive innovation and
growth. Companies lacking the proper cybersecurity practices will
experience slower adoption of digital capabilities, resulting in smaller
realization of their potential digital benefits.
For more insights, please visit
http://cs.co/og-silo](https://image.slidesharecdn.com/1e798397-18e1-4056-8eb0-b259aaba446c-160219001243/75/Private-Sector-Digital-Value-at-Stake-8-2048.jpg)
![© 2016 Cisco and/or its affiliates. All rights reserved. 6
Where to Begin Your Journey to Digital Value in the Private Sector
Economic Analysis
2015-2024
People Connections: Nearly Two-Thirds of Digital Value
Digital connections are becoming increasingly people-centric. In fact, according
to our analysis, employee productivity (largely fueled by digital capabilities that
enhance collaboration) is the top driver of digital value.
The digital world is powered by three types of connections: machine-to-
machine (M2M), person-to-machine (P2M), and person-to-person (P2P). In
our previous analysis, people-centric connections (P2P, P2M) drove 55 percent
of the estimated Value at Stake for the private sector. In our new study, the
contribution of people-centric connections to private sector Digital Value at
Stake has grown by 9 percentage points—to 64 percent. This increase reflects
the greater ability of organizations to marry the “people” and “process” elements
of digital business with the “things.”
The increased people-centricity of digital solutions is also helping to boost
organizations’ ability to innovate faster and more effectively in the private
sector—aided by digital use cases such as mobility and video collaboration that
enhance interactions among employees, and with partners.
For example, in the retail industry today, the shopping experience begins well
before a customer sets foot in a store. Being able to view in-store inventory
on a mobile phone to ascertain product availability is fundamental to providing
superior customer experience. Likewise, in the banking industry, the ability to
enable “banking on the move” is essential. Mobile apps now allow customers
to deposit a check, transfer money, and make payments while commuting on a
train or waiting for a bus, as opposed to having to visit a bank.
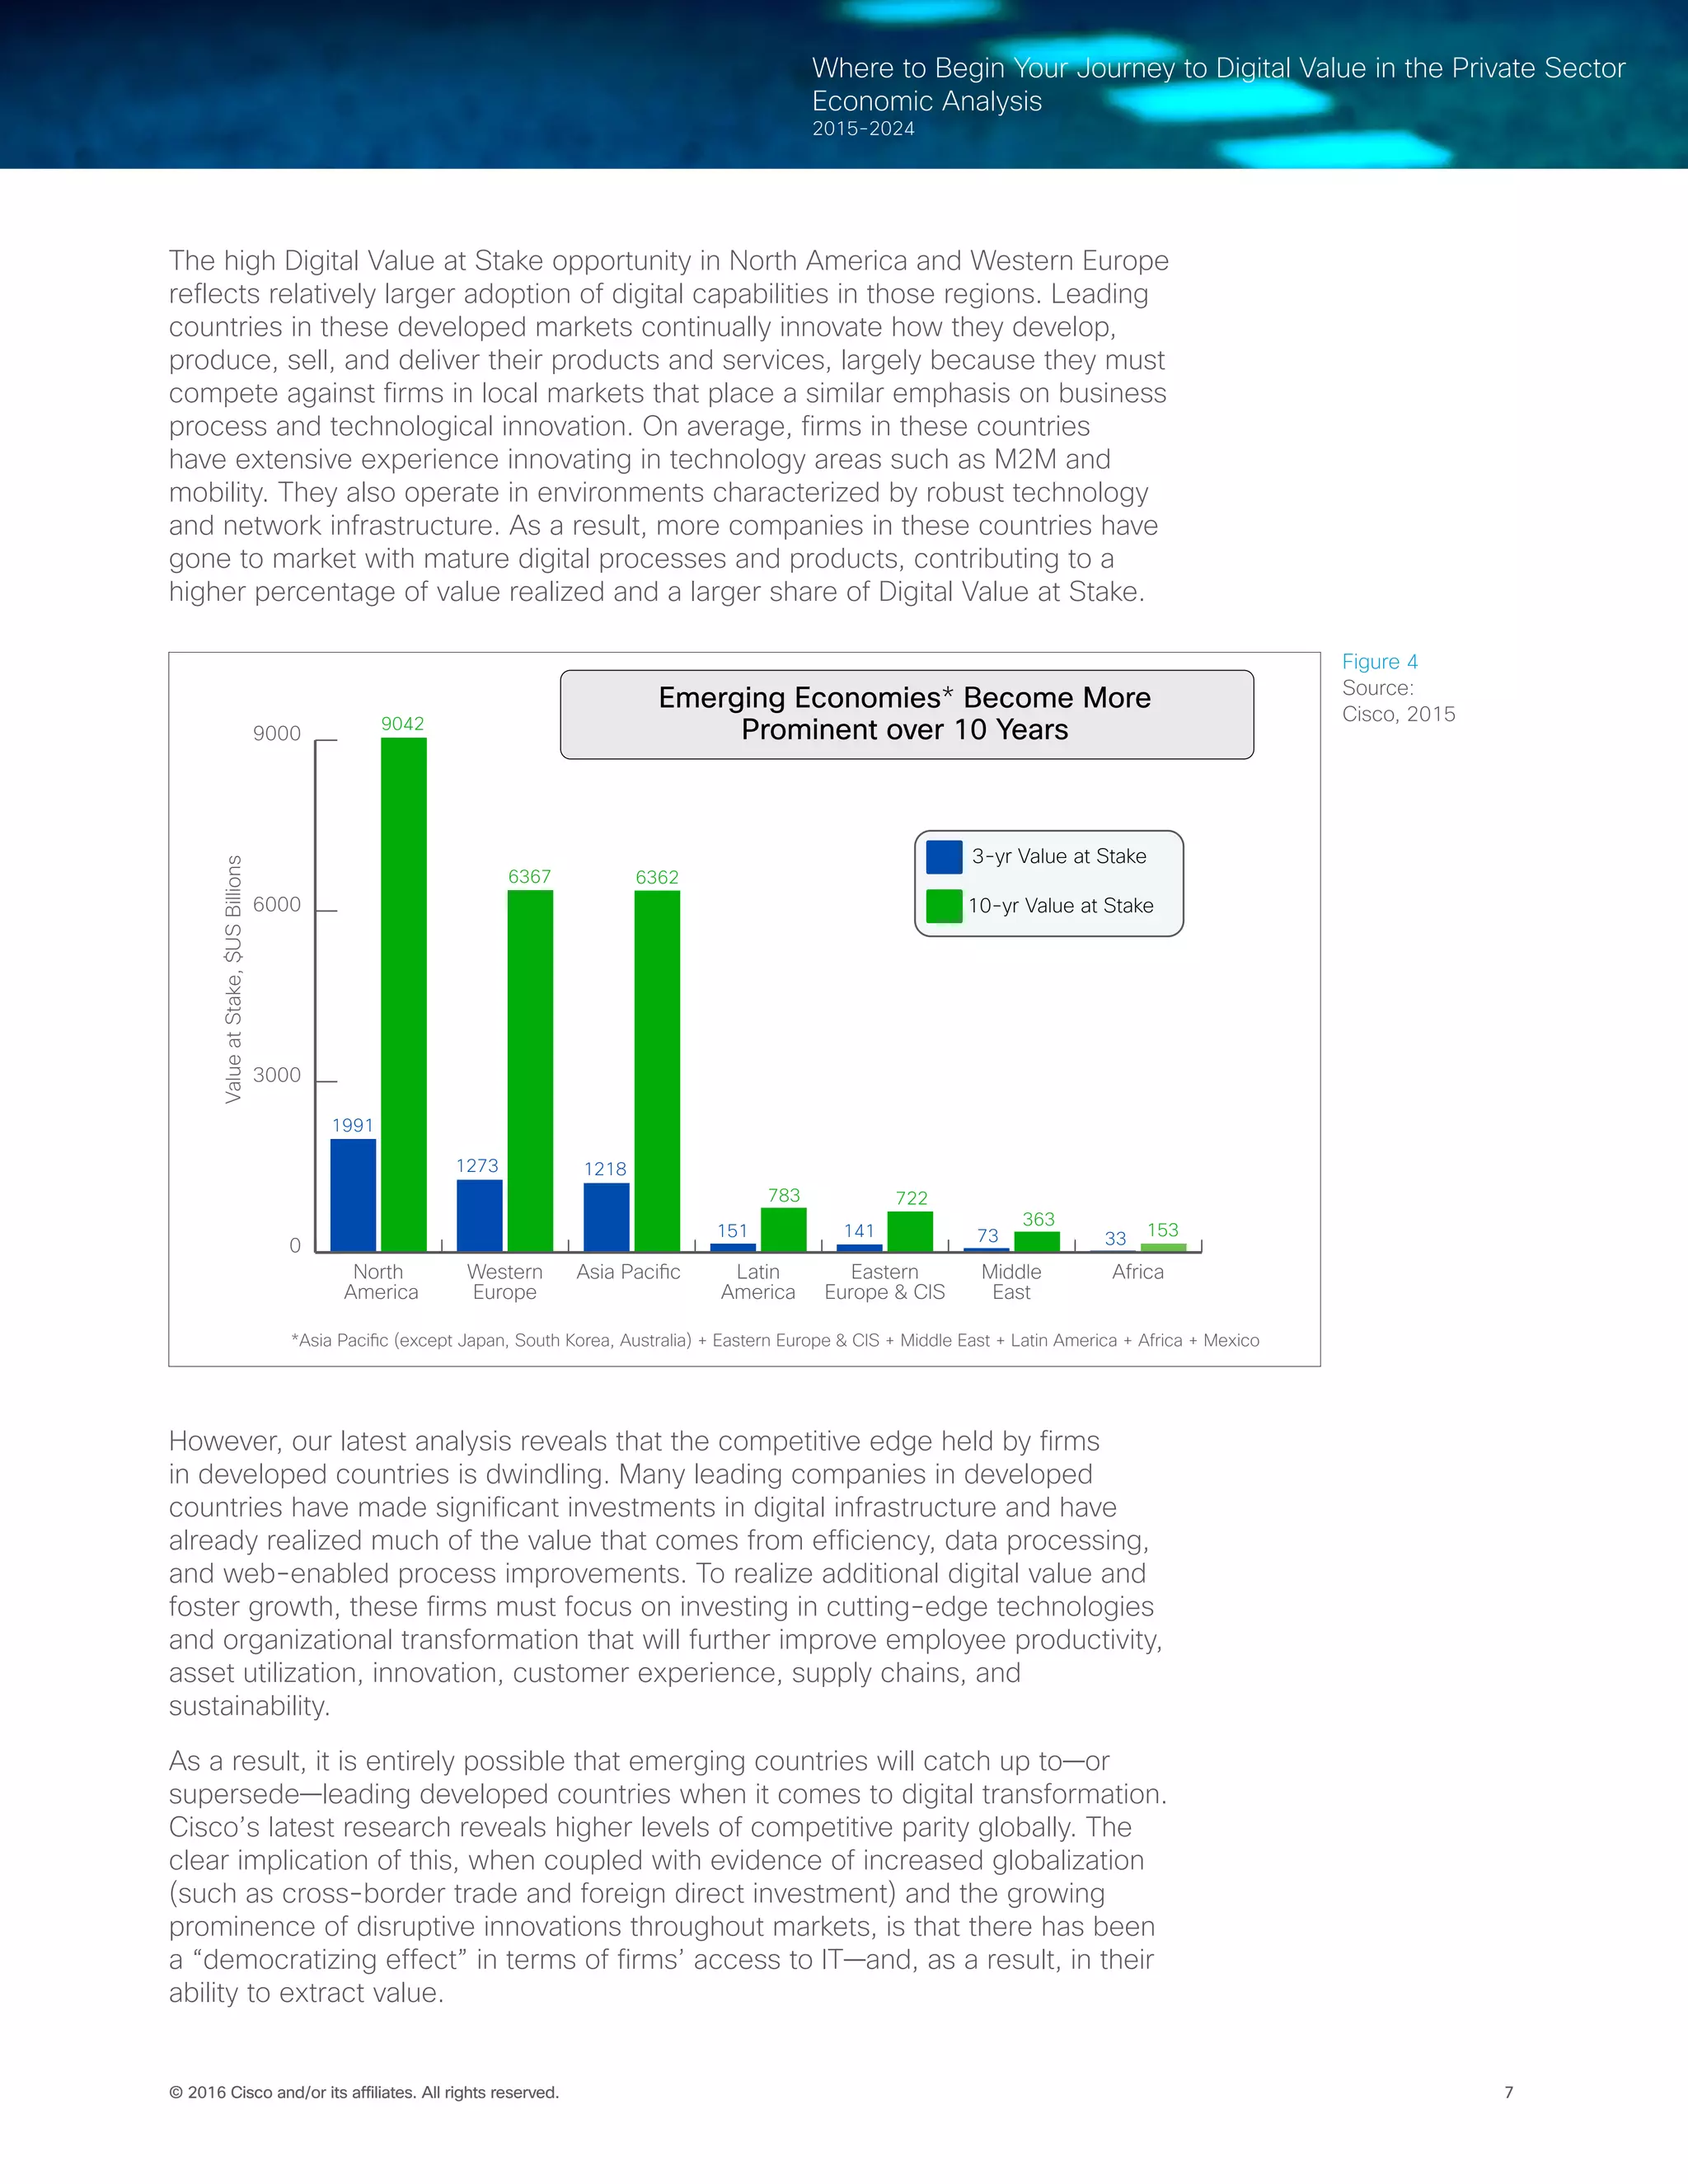
Asia Pacific and Emerging Countries Gaining Ground
As in our previous study, North America (United States, Canada, and Mexico)
leads all other regions in estimated private sector Digital Value at Stake for
the next decade ($9 trillion). However, our new analysis highlighted two major
changes: 1) the rise of Asia Pacific ($6.4 trillion) into a virtual tie with Western
Europe ($6.4 trillion) for the No. 2 position among regions (see Figure 3); and 2)
our projection that emerging economies15
will represent nearly one-third of the
global private sector Digital Value at Stake by 2024[ ] (see Figure 4, next page).
North America
$9.0T
United States: $7.7T
Canada: $790B
Mexico: $519B
Western Europe
$6.4T
Germany: $1.1T
United Kingdom: $926B
France: $804B
Asia Pacific
$6.4T
China: $3.0T
Japan: $1.3T
India: $397B
South Korea: $352B
Australia: $241B
Eastern Europe/CIS
$722B
Russia: $538B
Middle East
$363B
Saudi Arabia: $107B
Africa
$153B
South Africa: $38B
Latin America
$783B
Brazil: $405B
Global View: Digital Value at Stake in the Private Sector
(2015–2024)
Figure 3
Source:
Cisco, 2015](https://image.slidesharecdn.com/1e798397-18e1-4056-8eb0-b259aaba446c-160219001243/75/Private-Sector-Digital-Value-at-Stake-9-2048.jpg)
![8© 2016 Cisco and/or its affiliates. All rights reserved.
Where to Begin Your Journey to Digital Value in the Private Sector
Economic Analysis
2015-2024
As a case in point, Asia Pacific and/or emerging economies will drive
the majority of Digital Value at Stake for the global manufacturing
sector over the next decade. In addition, dramatically increased mobile
and online activity in countries like China and India is reshaping the
global retail landscape.
Industry Outlook: Where to Find Digital Value
To help industry leaders map their digital strategies, we’ve identified
the digital use cases that will deliver the most significant business
outcomes in each of the top six industries in terms of Digital Value at
Stake potential. These industries account for about 71 percent of the
total private sector Digital Value at Stake for 2015-2024—with each of
the six contributing $1 trillion-plus in digital value over the next decade
(see Figure 5). Our analysis also includes the key value drivers for
attaining Digital Value at Stake.
It’s important for readers to understand the digital use cases for their
own industry, as well as those recommended for other verticals. In
a digital world, some of the most innovative ideas often come from
outside one’s own industry. And, as we’ve already seen in the case of
Apple, Amazon, Tesla, and many others, digital capabilities are fueling
entirely new business models that blur industry lines. Will the retailers
become less relevant as manufacturers continue to hone their digital
capabilities and supply chain? Only time will tell.
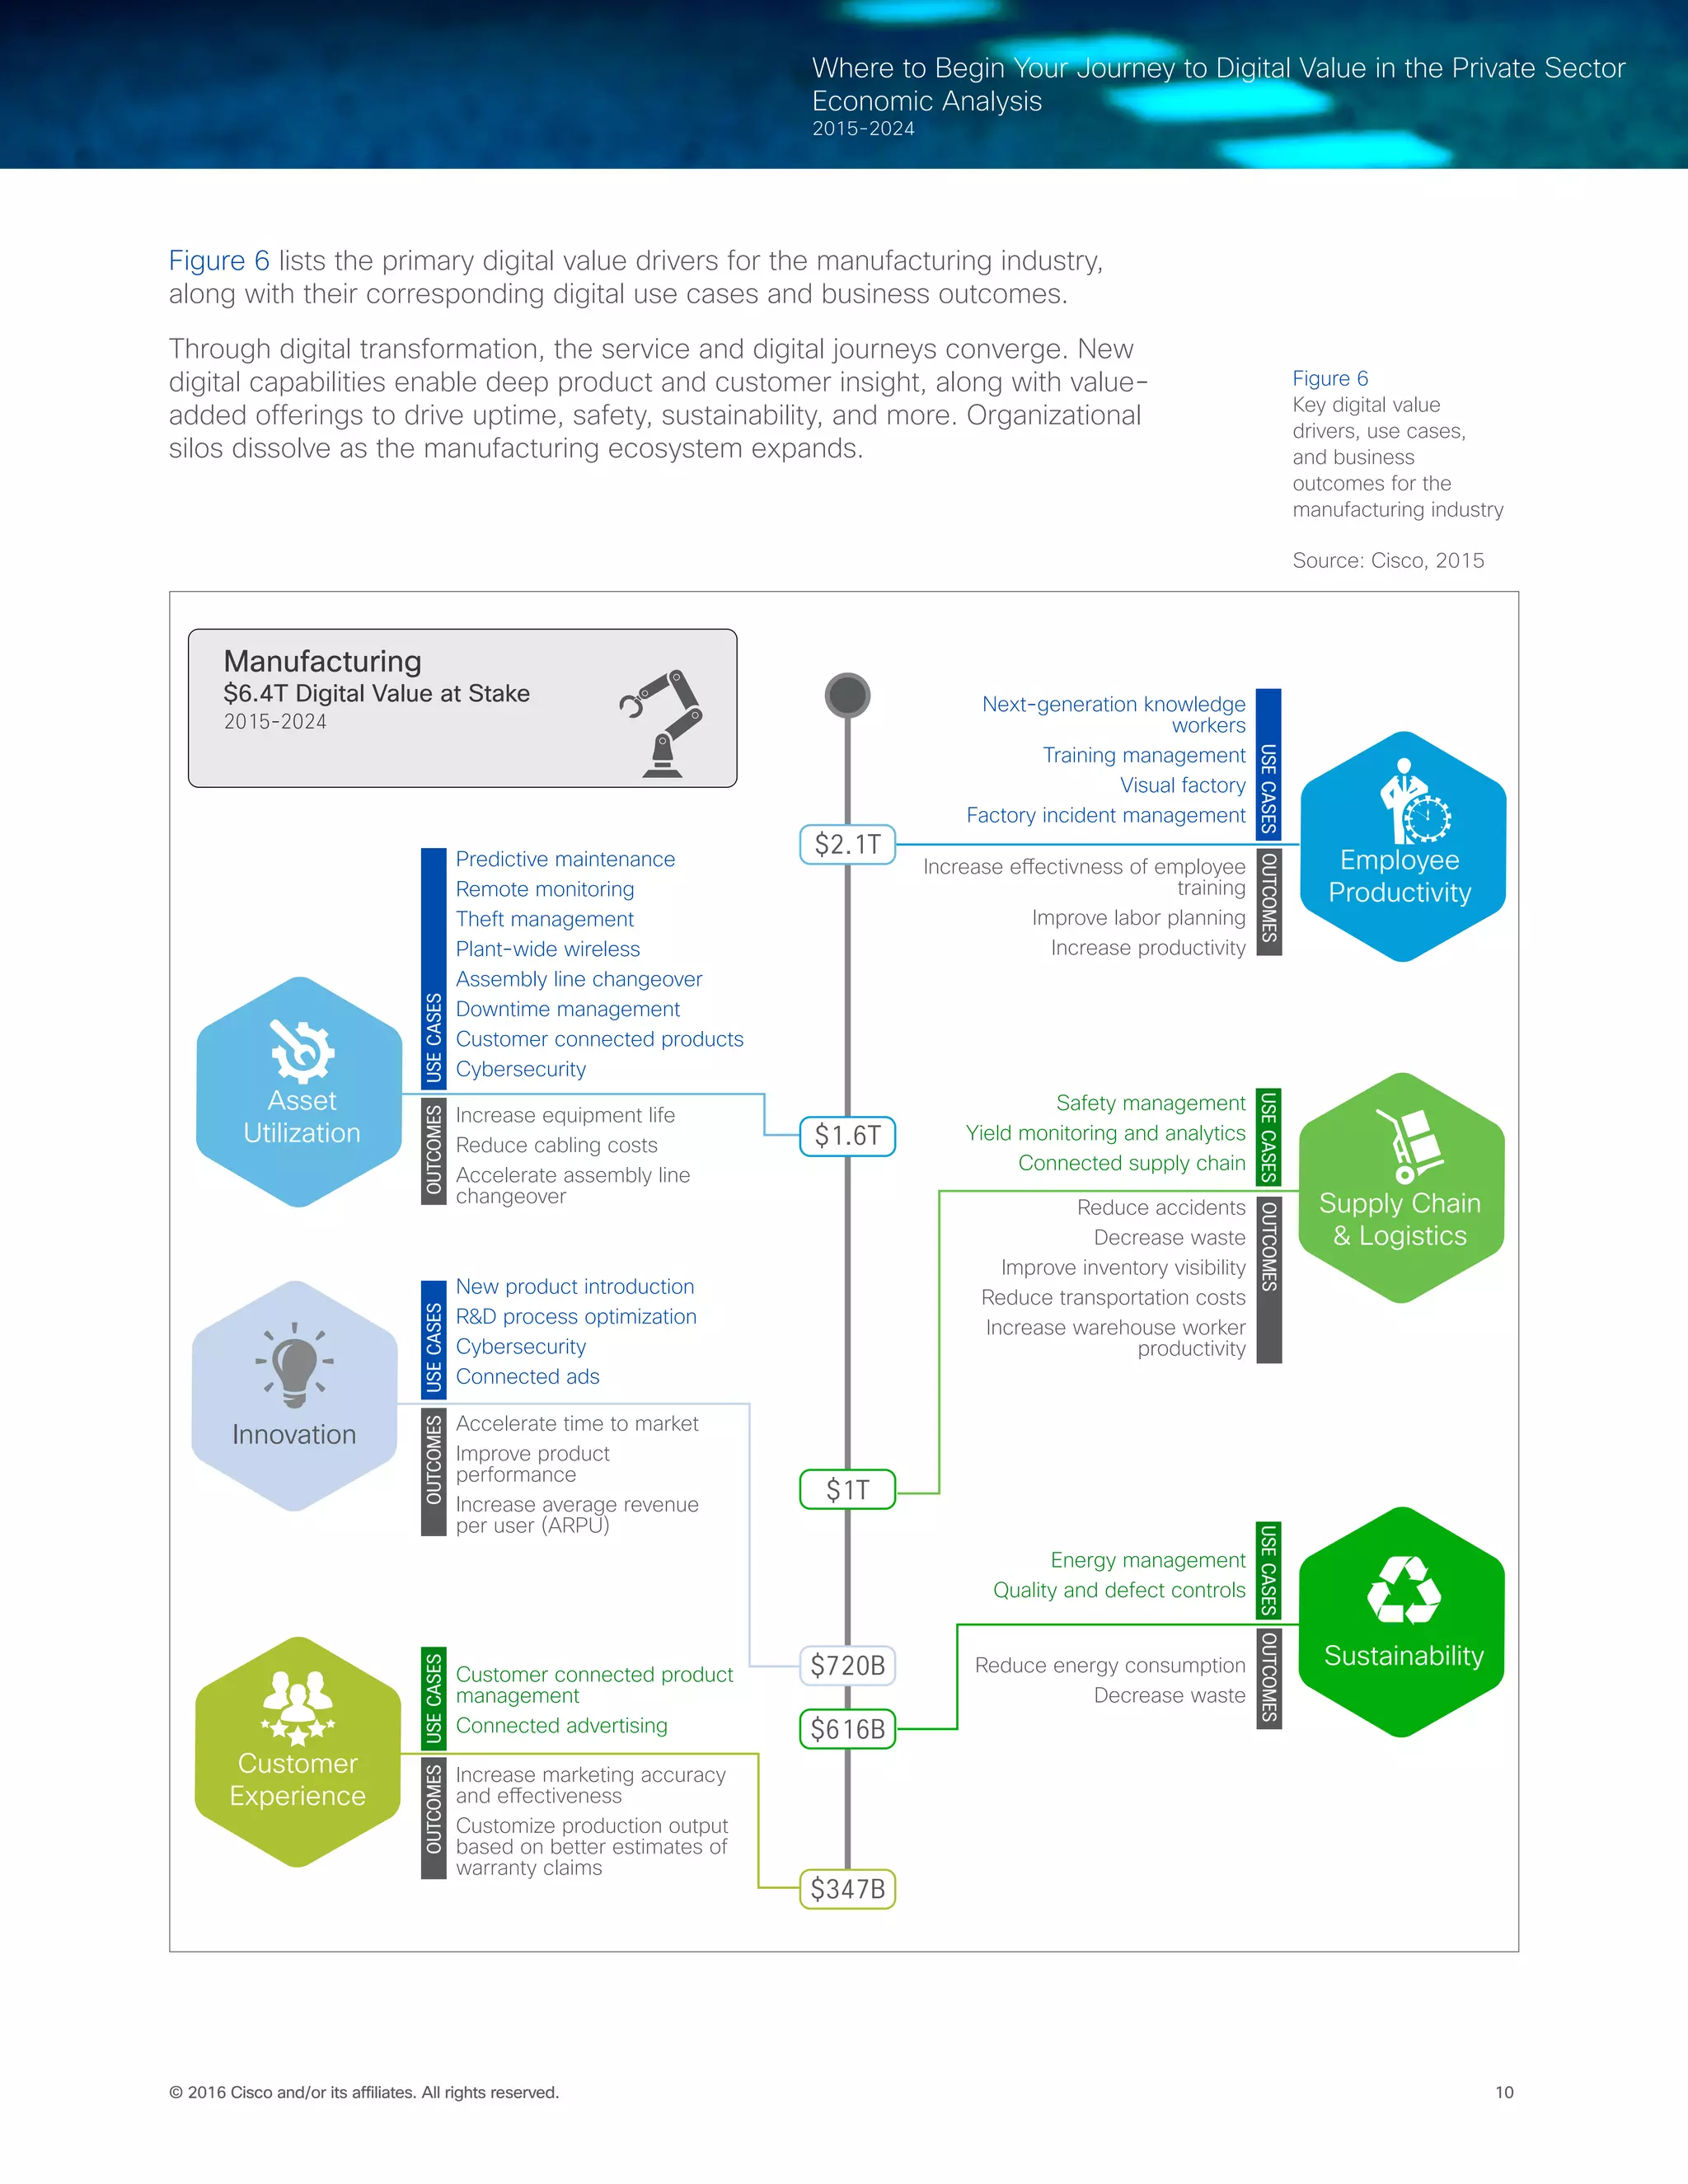
Manufacturing
An enormous, multifaceted set of industries, manufacturing represents
more than a quarter of the total private sector Digital Value at Stake for
2015-2024 ($6.4 trillion).[ ] Forty-four percent of that value will come
from the Asia-Pacific region, with North America (26 percent) and
Western Europe (24 percent) the No. 2- and No. 3-ranked regions,
respectively. Asia Pacific’s leadership comes primarily from the sheer
size of China’s manufacturing industry.
$6.4T
Manufacturing
$3.1T
Financial Services
$2.8T
Retail
$2.0T
Service Provider
$1.4T
Healthcare
$1.1T
Oil & Gas
The Digital ‘Trillion-Dollar Club’
Top Industries, Ranked by Value at Stake (2015-2024)
Figure 5
Source:
Cisco, 2015
Customer Connected Product
Management
Benteler
Based in Germany, Benteler
supplies safety, environmental,
and efficiency solutions to
vehicle manufacturers worldwide.
In Benteler’s automated, self-
running manufacturing plants,
every tool and part is connected
to the network, and every step in
the production process can be
analyzed and controlled from the
cloud. Factories can easily move
production lines and products
from one line to another. The
modular solution will result in
more agile and efficient factory
floors while controlling costs.
[see more]](https://image.slidesharecdn.com/1e798397-18e1-4056-8eb0-b259aaba446c-160219001243/75/Private-Sector-Digital-Value-at-Stake-11-2048.jpg)
![9© 2016 Cisco and/or its affiliates. All rights reserved.
Where to Begin Your Journey to Digital Value in the Private Sector
Economic Analysis
2015-2024
Digitization can help manufacturers address a wide range of
challenges, including shortening product lifecycles; reshaping the
supply chain to counter global competition; reducing waste through
increased uptime, labor productivity, and asset utilization; dealing with
volatile energy and raw material costs; and improving worker health
and safety. Digitization is also critical to manufacturers seeking to make
the all-important transition from product-centric to service-oriented
revenue models.
While manufacturing will generate the largest Digital Value at Stake of
any industry over the next decade, the sector is falling considerably
short of fulfilling its digital potential. In 2015, the industry was projected
to capture just 24 percent ($409 billion) of its potential Digital Value at
Stake.
To help address that shortfall, manufacturing firms should begin by
focusing on the following industry-specific digital use cases, which will
drive the lion’s share of digital value for manufacturers over the next
decade:
• Predictive maintenance with analytics ($418 billion): Estimates
maintenance requirements based on equipment usage and wear,
increasing asset life and uptime. Years to mainstream adoption: 0-2
years
• Automation of quality and defect controls ($359 billion): Wearable
technologies and digital signage systems deliver real-time alerts
about defects, reducing rework and scrap. Years to mainstream
adoption: 0-2 years
• Energy management ($312 billion): Digitally enabled building
and production control systems provide visibility into energy
consumption for all manufacturing processes; improve capacity
management with real-time analytics; and increase operational
efficiency by controlling energy consumption based on productivity.
Years to mainstream adoption: 5-10 years
• Customer connected product management ($295 billion): Monitors
asset usage through sensors. Analytics estimate maintenance
requirements based on usage, increasing life of assets, reducing
excessive wear and tear, and leading to lower maintenance costs.
Turns field sensor and process data from connected products into
real-time intelligence for custom service offers. Years to mainstream
adoption: 2-5 years
• Remote monitoring/maintenance ($264 billion): Reduces
maintenance costs by identifying potential equipment failures prior
to significant deterioration. Years to mainstream adoption: 0-2 years
In addition, manufacturers can capture substantial value (more than $3
trillion across the industry over 10 years) from a number of “horizontal”
digital use cases. For example, adoption of next-generation worker
technologies such as mobile collaboration (BYOD), telecommuting, and
video collaboration will enable a 35 percent gain in knowledge worker
productivity and a reduction in business travel of up to 17 percent.
Another horizontal use case, connected advertising, will produce a
revenue uplift of 0.14 percent across the industry by integrating mobile
advertising with location-based services.
Predict Downtime
For more manufacturing
insights, please visit
cs.co/mfgschneider
Predictive Maintenance with
Analytics
FANUC
FANUC makes industrial robots
for manufacturing companies.
In the past, it shipped robots
out but had no feedback about
robot usage unless there was
a problem and downtime. By
building a highly secure hybrid
cloud to extend its existing data
center to customers’ premises,
FANUC can now extract data
from its robots and connect them
with people, processes, and
things. FANUC can analyze the
data to gain visibility into robot
performance, thereby predicting
an issue, rather than reacting to
a problem. Moreover, such data
insights contribute to reduced
cycle times, enhanced product
quality, and improved efficiency
of processes.
[see more]](https://image.slidesharecdn.com/1e798397-18e1-4056-8eb0-b259aaba446c-160219001243/75/Private-Sector-Digital-Value-at-Stake-12-2048.jpg)
![11© 2016 Cisco and/or its affiliates. All rights reserved.
Where to Begin Your Journey to Digital Value in the Private Sector
Economic Analysis
2015-2024
Financial Services
The financial services industry faces a host of challenges, including
changing customer preferences driven by the shift to digital; increasing
pressure from agile competitors using disruptive business models
(such as Wealthfront’s automated investment services and peer-to-
peer lending platforms pioneered by Grameen Bank) and from the
technology industry (such as mobile payment offerings from Google,
Apple, and Vodafone); stiffer regulatory requirements; rising branch
costs; growing customer attrition; and margin pressures due to
human-intensive processes.
In addition, retail banking—the segment of the financial services
industry with the highest potential Digital Value at Stake (53 percent)—
is plagued by a growing lack of customer trust, and a belief that
customers are getting less value from banks than they expect. This
“value gap” is largely the result of customers not receiving financial
advice when and where they need it. According to a recent Cisco
survey, 28 percent of bank customers globally do not trust banks to
represent their best interests. What’s more, nearly one in four intend to
choose another provider for their next financial product or service.16
New services enabled by digital technologies can help banks and
the other major segments of the industry—insurance and investment/
brokerage firms—maximize the value they offer customers. The
solutions will require a convergence of mobility, analytics, and video to
create delightful experiences and effortless transactions for customers.
This will allow the industry to move away from legacy, paper-based
approaches, thereby enabling improved delivery of services in a cost-
effective manner.
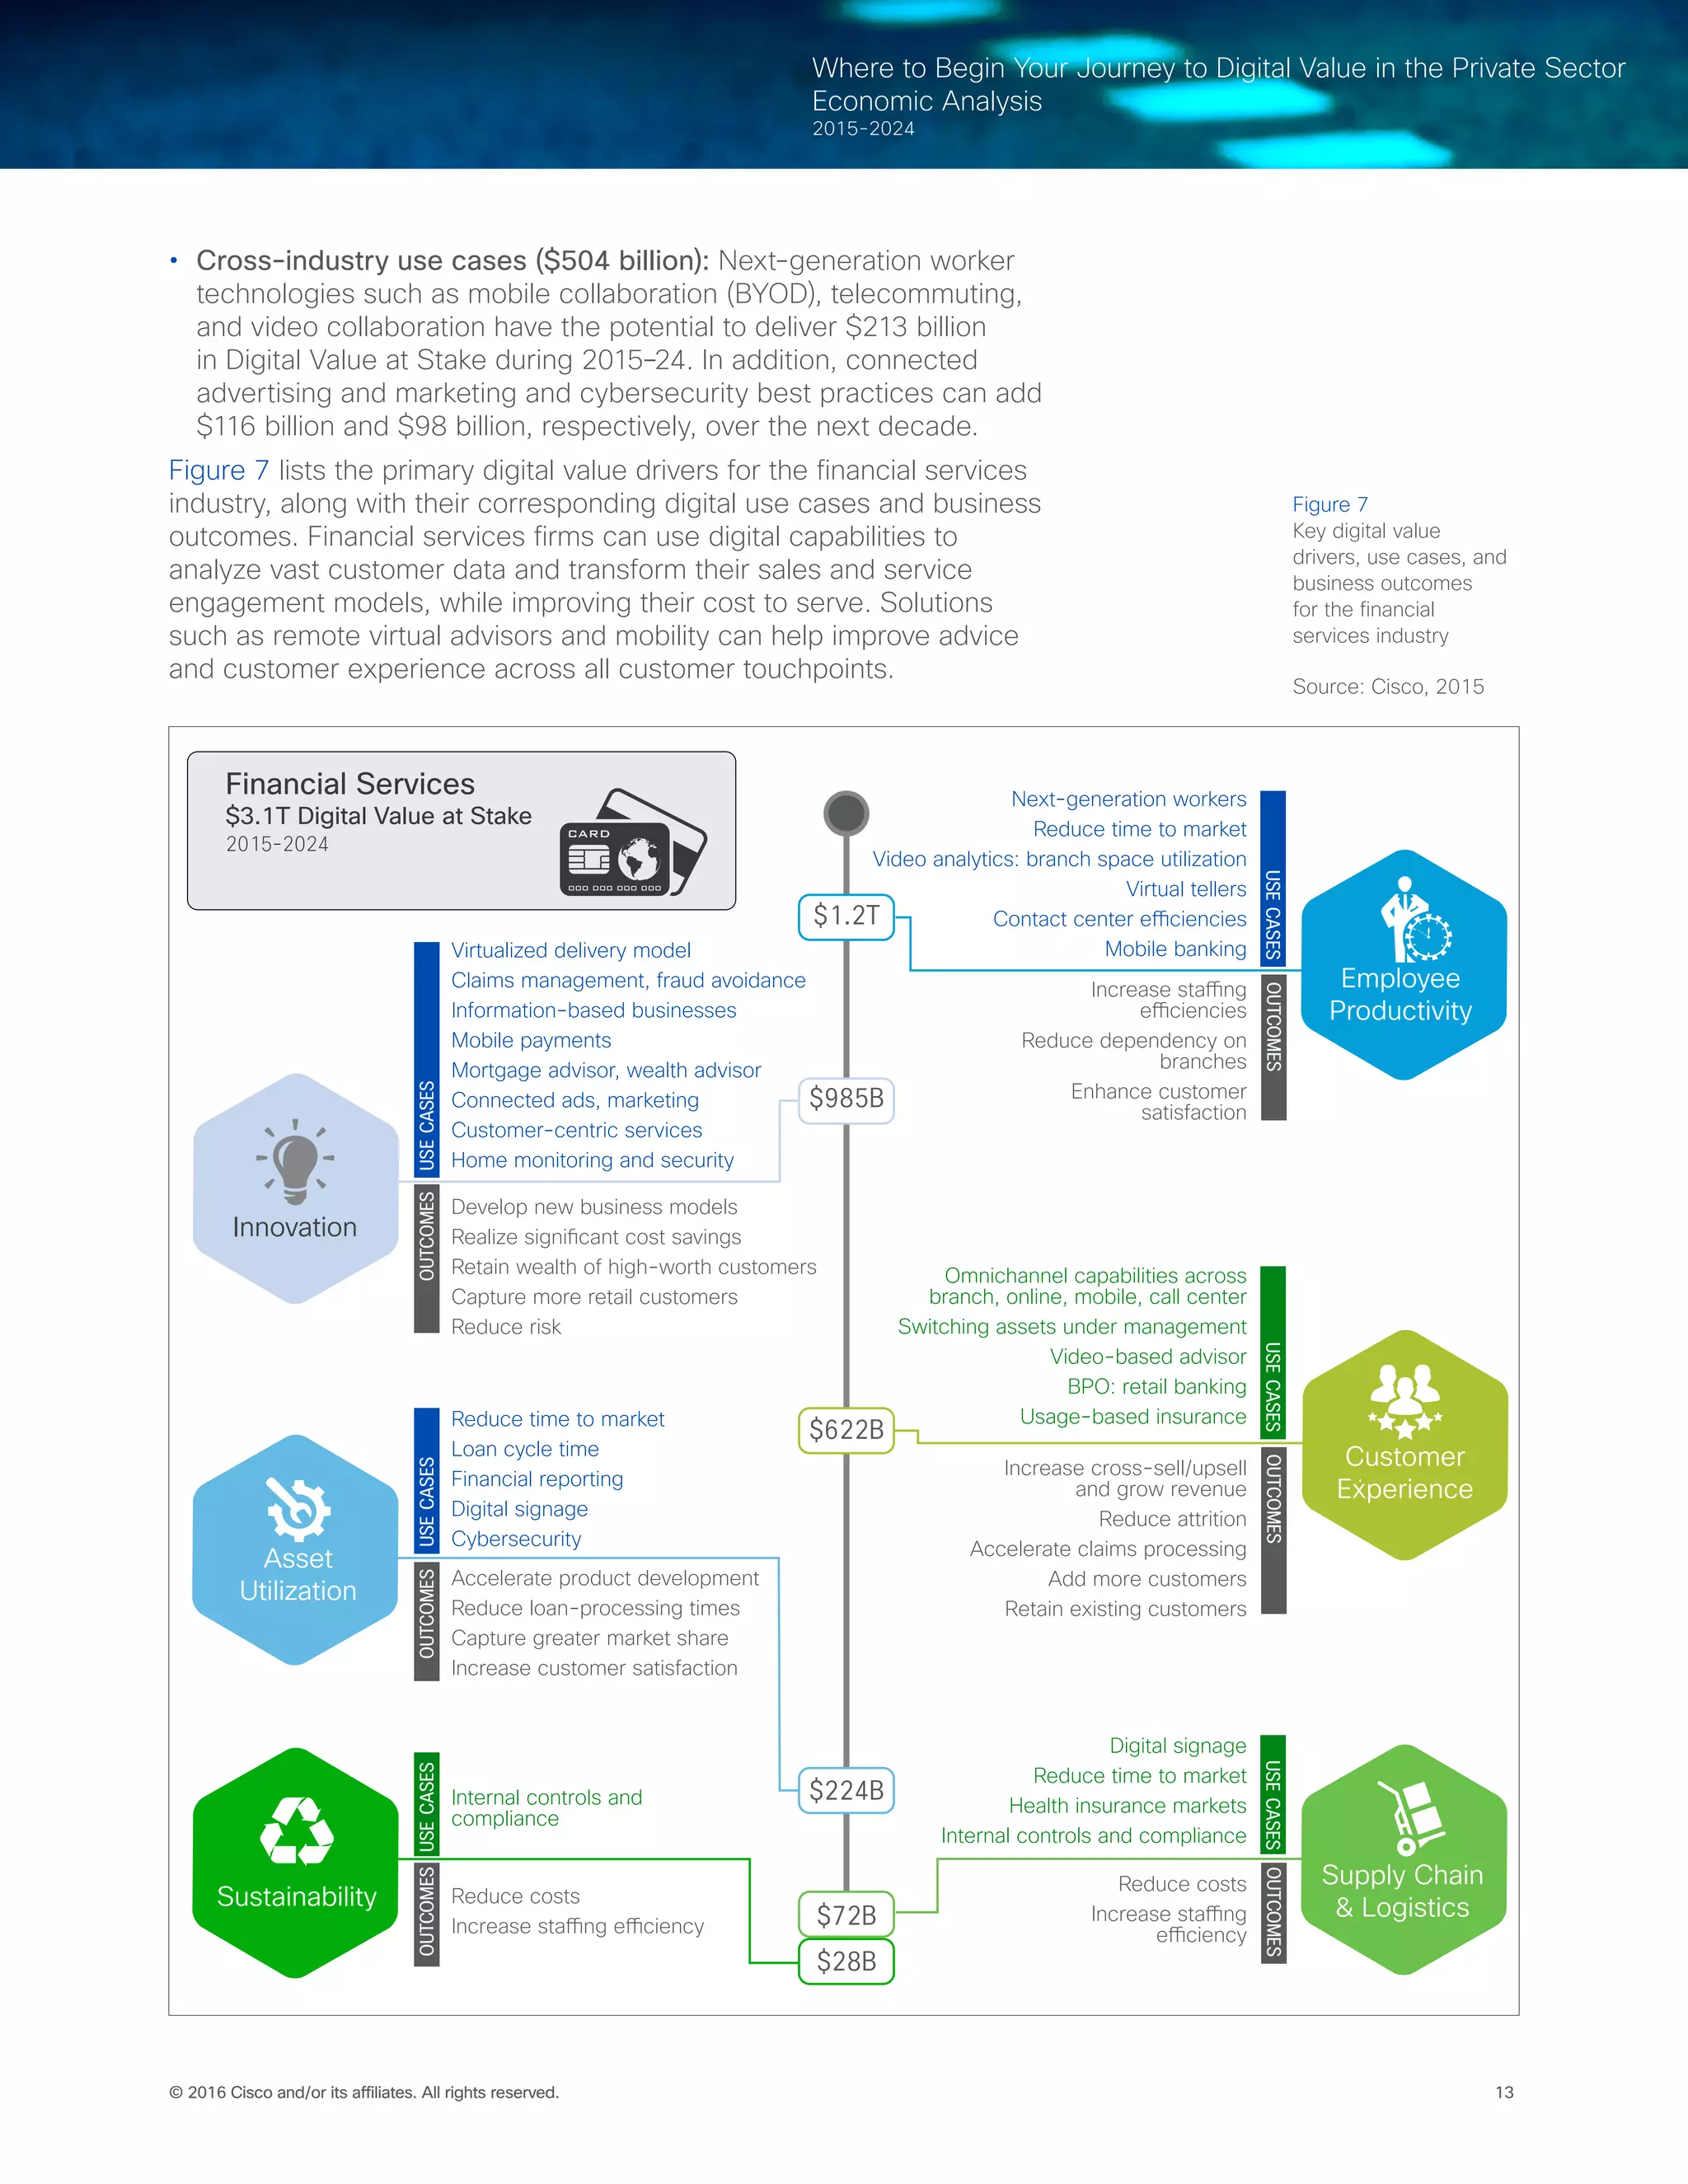
These digital opportunities make financial services the No.2-ranked
industry in terms of Digital Value at Stake, with an estimated $3.14
trillion up for grabs over the next decade.[ ] North America will drive
48 percent of this value, with Western Europe (29 percent) and Asia
Pacific (17 percent) the No. 2- and No. 3-ranked regions, respectively.
Financial services was on track to secure 29 percent of its potential
Digital Value at Stake in 2015—the highest percentage of any industry.
To secure an even larger share of potential Value at Stake in the future,
financial services firms should base their digital strategies on the
following industry-specific and cross-industry use cases.
Retail Banking
• Sales and services transformation ($508 billion): Connect and
coordinate interactions across multiple channels by systematically
enabling intelligent, personalized customer interactions. Years to
mainstream adoption: 0-2 years
• Video-based advisors ($127 billion): Enable customers to speak to
an advisor either in-branch or remotely using mobile devices. Leads
to higher customer satisfaction and drives upsell and cross-sell
opportunities. Years to mainstream adoption: 2-5 years
• Mobile payments ($116 billion): Allows customers to use a mobile
phone to pay for products and services. Improves customer
Sales and Services
Transformation
Banamex
Starting in 2013, the bank began
opening its Banamex Smart
Banking Kiosks in shopping
malls in Mexico. The size of a
small retail store, each 24/7
digital branch integrates ATMs,
tablets, touchscreens, video
walls, teleconferencing, and
a virtual hostess to deliver a
completely digital financial self-
service experience. The result
is a high-speed, cost-efficient
digital banking experience that
performs 80 percent of a regular
branch’s transactions, with
higher satisfaction levels.
[see more]
For more financial services
insights, please visit
cs.co/fsi-advice](https://image.slidesharecdn.com/1e798397-18e1-4056-8eb0-b259aaba446c-160219001243/75/Private-Sector-Digital-Value-at-Stake-14-2048.jpg)
![12© 2016 Cisco and/or its affiliates. All rights reserved.
Where to Begin Your Journey to Digital Value in the Private Sector
Economic Analysis
2015-2024
convenience and acquisition by capturing the unbanked or
underbanked. Years to mainstream adoption: 0-2 years
• Cross-industry use cases ($708 billion): Next-generation worker
technologies such as mobile collaboration (BYOD), telecommuting,
and video collaboration have the potential to deliver $299 billion
in Digital Value at Stake during 2015–24. In addition, connected
advertising and marketing and cybersecurity best practices can add
$163 billion and $137 billion, respectively, over the next decade.
Insurance
• Claims processing ($82 billion): Uses analytics to reduce claim
costs and process inefficiencies, improves risk selection, and lowers
the cost of compliance and financial reporting. Years to mainstream
adoption: 2-5 years
• Product innovation ($41 billion): Targets a larger market with
virtualized insurance services and a multichannel presence. Years to
mainstream adoption: 5-10 years
• Customer experience ($39 billion): Keen insights allow insurers to
focus on specific customer needs, wants, and behavior patterns,
increasing customer satisfaction and loyalty. Insurers can derive
higher sales by implementing insight-driven marketing tactics and
real-time analytics for customer-centric services offerings. Years to
mainstream adoption: 0-2 years
• Cross-industry use cases ($127 billion): Next-generation worker
technologies such as mobile collaboration (BYOD), telecommuting,
and video collaboration have the potential to deliver $54 billion
in Digital Value at Stake during 2015–24. In addition, connected
advertising and marketing and cybersecurity best practices can add
$29 billion and $25 billion, respectively, over the next decade.
Investment/Brokerage
• Video-based advisors ($386 billion): Enable customers to speak
to an advisor either in-branch or remotely using mobile devices,
improving customer satisfaction and driving upsell and cross-sell
opportunities. Helps retain the wealth of existing high-net-worth
individuals (HNI) by collaborating with the family through video-
based remote advisors and gaining share of the self-serve segment
through direct relationship management. Years to mainstream
adoption: 2-5 years
• Self-directed brokerage ($106 billion): Provides access to a broad
range of investments via a brokerage account versus the limited
lineup offered by a 401(k) plan. Helps grow the share of wallet with
existing clients and attracts new investors. Years to mainstream
adoption: 2-5 years
• Fraud detection ($95 billion): “False positives,” which incorrectly
identify potential fraud during the brokerage account opening
process, trigger a time-consuming, manual review process, and
often deter good customers from opening a new account. With
analytics, brokerage firms can automate fraud review processes,
increase new account revenue, and reduce inefficiencies. Years to
mainstream adoption: 0-2 years
Video-based Advisors
[Remote Expert]
Nationwide
The world’s largest building
society, Nationwide wanted to
increase customer satisfaction
and boost sales by making it
more convenient to apply for
a mortgage. Today, customers
can walk into any of more than
60 branches to meet with a
mortgage specialist over the
network. The specialist can
share charts and comparisons
on a video display, and a
connected printer produces
forms for customers to review
and sign. Ninety-three percent
of customers surveyed rated the
solution as a good or excellent
replacement for face-to-face
meetings. New mortgage
business rose by 66 percent, and
customer satisfaction increased
by double digits.
[see more]](https://image.slidesharecdn.com/1e798397-18e1-4056-8eb0-b259aaba446c-160219001243/75/Private-Sector-Digital-Value-at-Stake-15-2048.jpg)
![14© 2016 Cisco and/or its affiliates. All rights reserved.
Where to Begin Your Journey to Digital Value in the Private Sector
Economic Analysis
2015-2024
Retail
As digital shopping experiences become mainstream, retailers need to
act quickly to ensure they are not disrupted by innovative, online-only
players or traditional competitors that adapt faster than they do.
In particular, mobility and apps now represent a disruption similar in
scope to what we saw with e-commerce in the late 1990s and early
2000s.17
Throughout the world, new digital customers expect a rich
variety of interactive and contextual retail experiences, channels, and
options—but rarely find them in brick-and-mortar retail settings.
Retailers have made important strides by creating more channels
(omnichannel). These investments, however, have resulted in growing
operational complexity, and retailers have not consistently achieved
what consumers really desire: greater efficiency, savings, and
engagement, both in-store and out.
Digital capabilities can enable retailers to address a number of
challenges, including improving in-store customer engagement and
workforce efficiency, reducing shrinkage, and streamlining inventory
management and checkout processes.
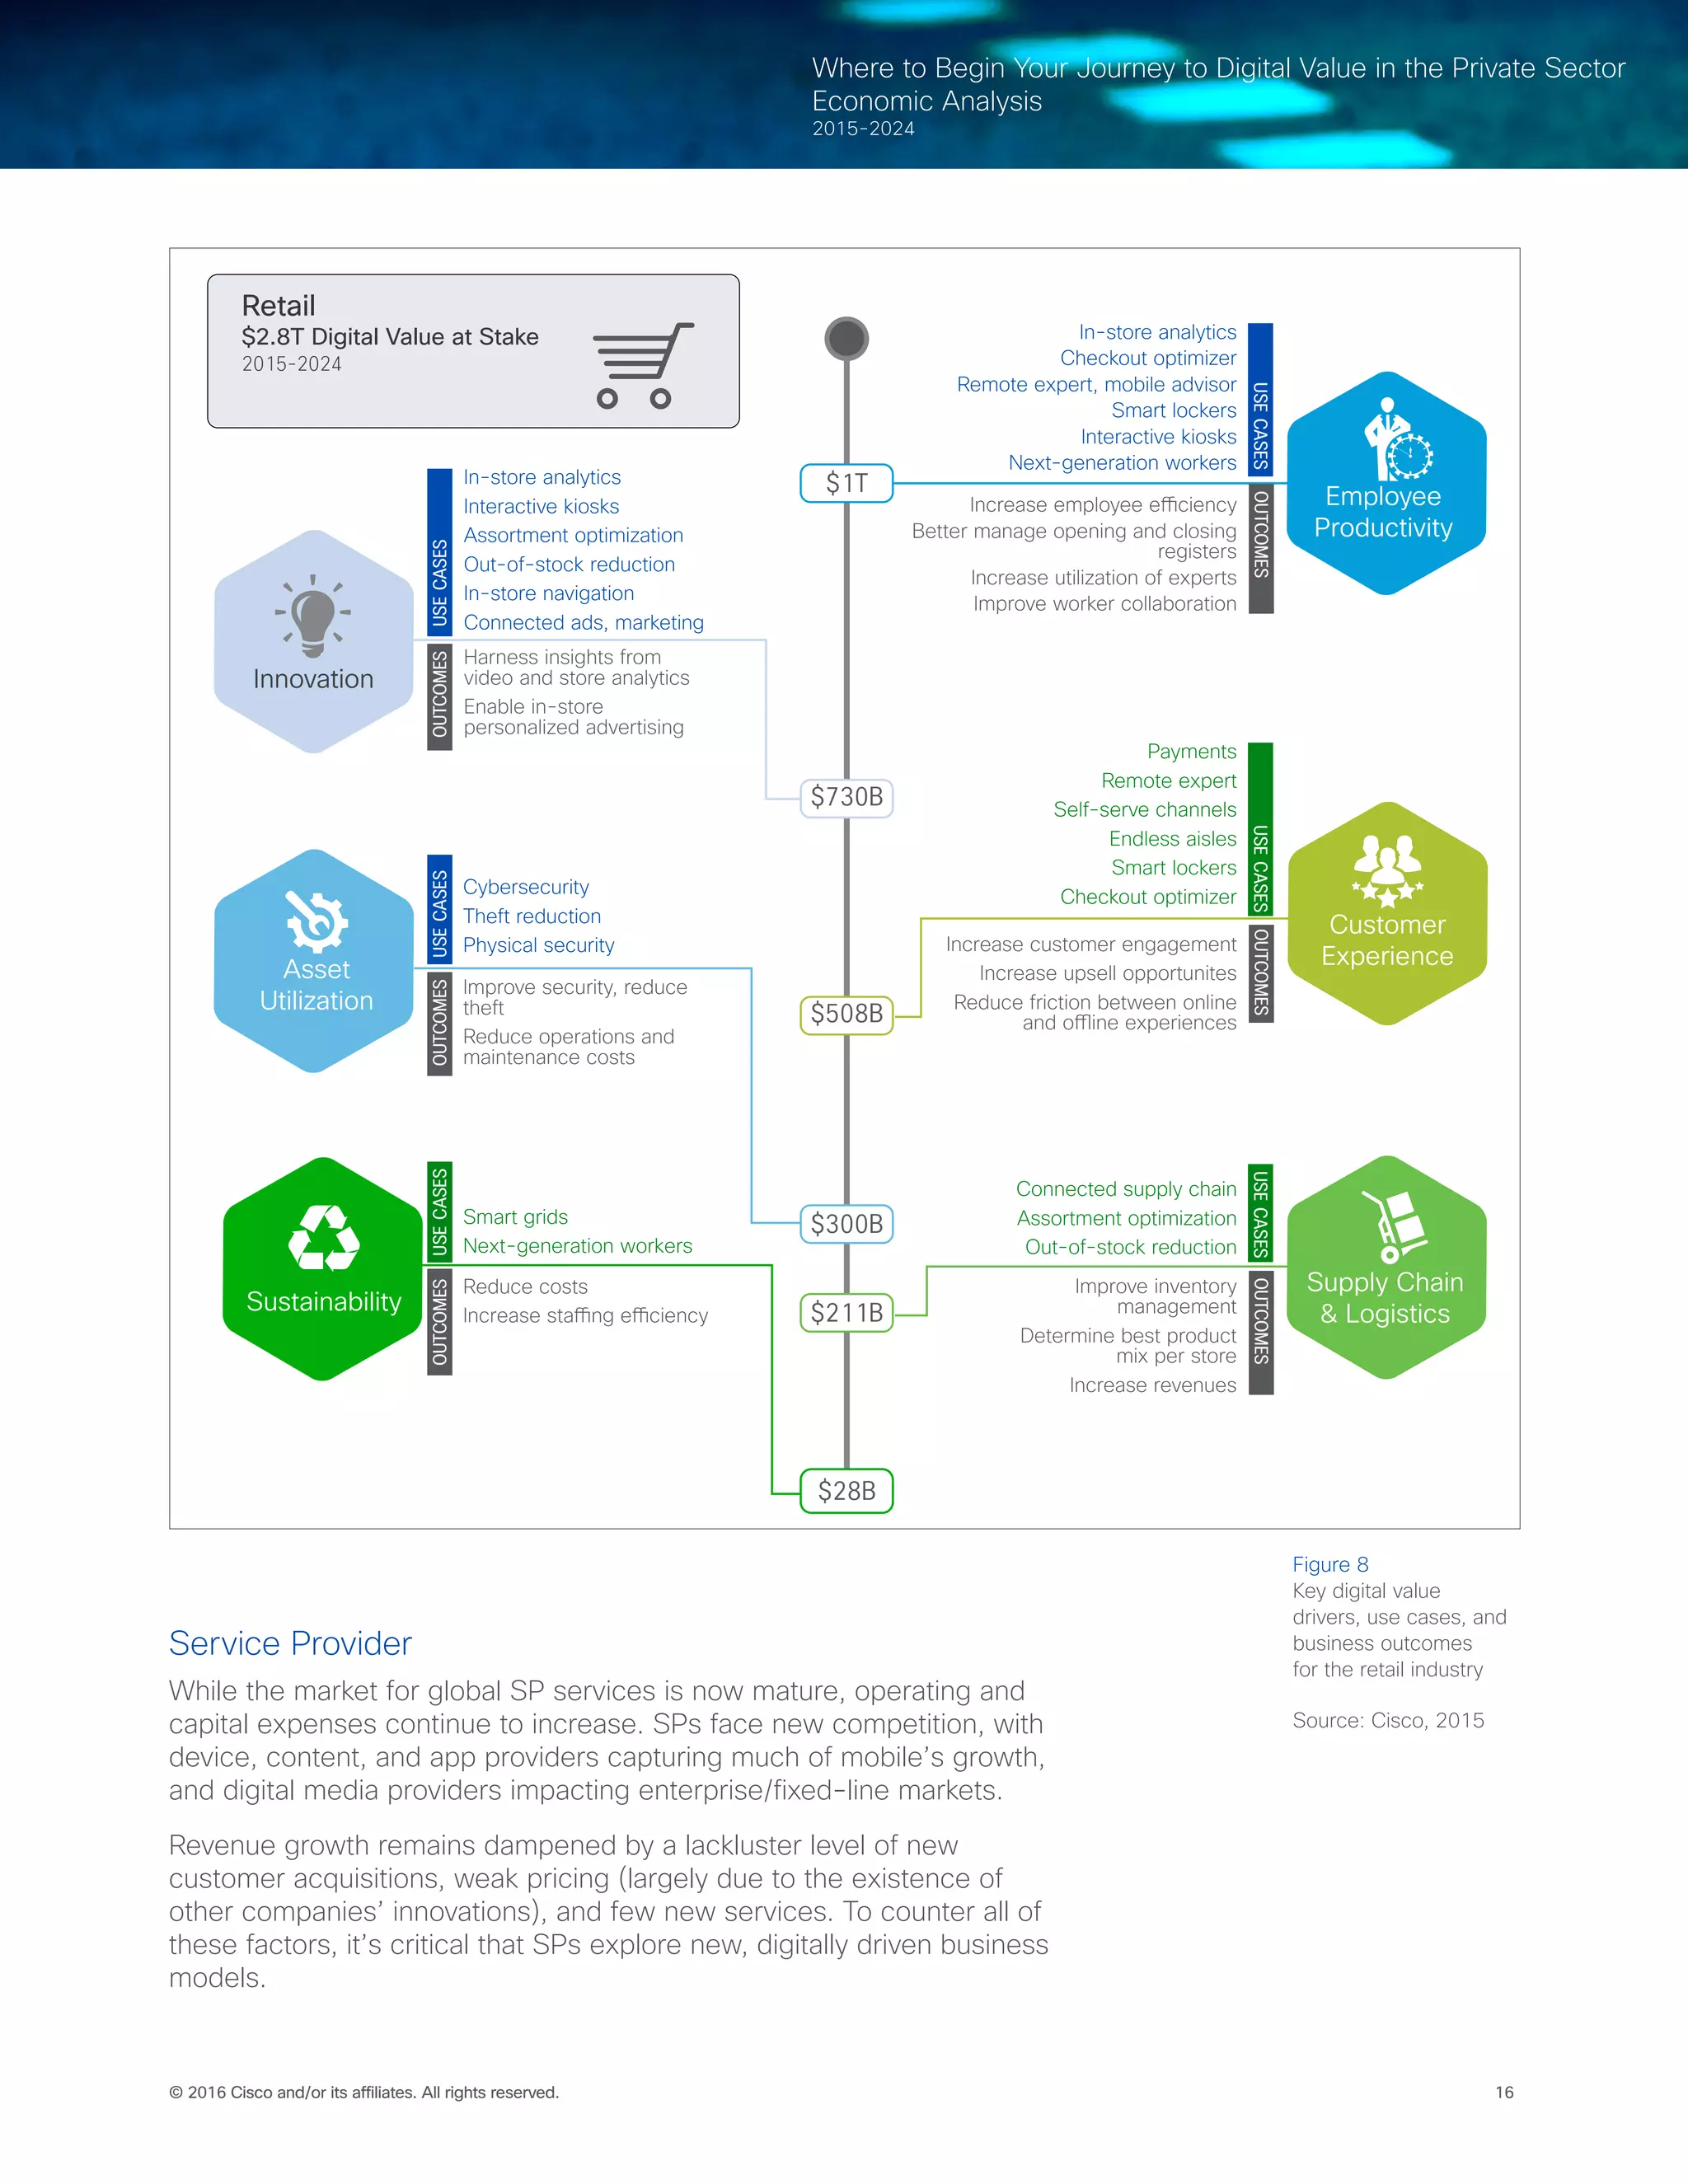
Based on these and many other digital opportunities, retail represents
the third-largest industry in terms of Digital Value at Stake. Of the
$2.8 trillion in Digital Value at Stake available to the retail industry over
the next decade, $765 billion will come from industry-specific use
cases, while about $2 trillion will emanate from cross-industry use
cases. North America will drive 46 percent of this value, with Western
Europe (27 percent) and Asia Pacific (20 percent) the No. 2- and No.
3-ranked regions, respectively.
Cisco estimates, however, that the retail industry realized just 15
percent ($130 billion) of its potential Digital Value at Stake for 2015.
Retailers should prioritize the following five industry-specific use cases
to avoid leaving so much “money on the table” moving forward:
• In-store analytics ($285 billion): Improve workforce efficiency
through dashboards, real-time information, operational analytics,
workforce management tools, and shopping analytics. Years to
mainstream adoption: 0-2 years
• Remote experts/mobile advisors ($226 billion): Counsel customers
on high-ticket items to create upselling opportunities while reducing
customer leakage in case expert assistance is unavailable. Years to
mainstream adoption: 2-5 years
• Theft reduction/physical security ($78 billion): Replace analog
cameras with IP-based surveillance systems to reduce operating
costs of legacy systems. Install video analytics in IP cameras to
analyze suspicious behavior and reduce theft. Years to mainstream
adoption: 2-5 years
• Endless aisles ($51 billion): Allow customers to view entire product
inventories via interactive kiosks. Customers can order out-of-stock
items from another store or opt for home delivery, helping to reduce
customer leakage. Years to mainstream adoption: 0-2 years
For more retail insights, please
visit cs.co/retailContextual
In-store Analytics
Panasonic
Panasonic Powershelf is an
intelligent retail shelf that
automates pricing and tracks
inventory. Data from Powershelf
can be analyzed in real time,
in the store, for immediate
insight. When a Powershelf
is connected to an analytics
platform, it delivers data that
leads to innovation. Analytics
at the edge enable retailers to
move perishable goods faster,
improve store traffic patterns,
and increase efficiency. By
supplementing edge analytics
with historical data analysis,
retailers can empower decision-
making locally, regionally, and
globally for supply chain, sales
forecasting, and customer
experience planning.
[see more]](https://image.slidesharecdn.com/1e798397-18e1-4056-8eb0-b259aaba446c-160219001243/75/Private-Sector-Digital-Value-at-Stake-17-2048.jpg)
![15© 2016 Cisco and/or its affiliates. All rights reserved.
Where to Begin Your Journey to Digital Value in the Private Sector
Economic Analysis
2015-2024
• Checkout optimizer ($51 billion): Use video cameras to monitor and
predict queue lengths, reduce customer wait times, and improve the
efficiency of cashiers. Years to mainstream adoption: 2-5 years
In addition to the above industry-specific use cases, retailers can
generate additional value from several cross-industry digital use cases.
The largest of these—personalized promotions and marketing—has
the potential to drive $556 billion for the global retail industry over
the next decade through solutions such as analytics-driven precision
marketing and digital signage.[ ] In addition, next-generation worker
technologies such as mobile collaboration (BYOD), telecommuting,
and video collaboration have the potential to deliver $550 billion in
Digital Value at Stake during 2015–24. Retailers also have the potential
to drive $536 billion in Digital Value at Stake globally by integrating
cybersecurity directly into their digital platforms to reduce security
breaches—and drive growth.
Figure 8 (next page) lists the primary digital value drivers for the retail
industry, along with their corresponding digital use cases and business
outcomes.
The combination of shopper behavior analytics, workforce analytics,
and process transformation can reduce retailers’ in-store operational
costs and improve customers’ shopping experience. Adopting a
consistent approach across all customer touchpoints and sales
channels enables retailers to decrease churn, increase wallet share,
and improve brand loyalty.
Endless Aisles
Tesco
Tesco’s F&F Clothing Group integrated its online and physical stores
to offer customers what they want, when they want it. For example, if
something is out-of-stock at a store, customers can visit an “Online Order
Point” kiosk, ask employees to look it up on their F&F tablets, or order
through Wi-Fi on their personal devices. Today, Tesco can easily provide
customers with information on the latest trends, personalized advice, and
even deals based on store location. This information can be accessed via
the shopper’s personal device or through sales associates who, with their
tablets, now have another way of serving customers. The combined online
and in-store experiences helped the company exceed its online targets
over the 2014 holidays with more than 50 percent sales growth.
[see more]](https://image.slidesharecdn.com/1e798397-18e1-4056-8eb0-b259aaba446c-160219001243/75/Private-Sector-Digital-Value-at-Stake-18-2048.jpg)
![17© 2016 Cisco and/or its affiliates. All rights reserved.
Where to Begin Your Journey to Digital Value in the Private Sector
Economic Analysis
2015-2024
With increasing connectivity across consumers and enterprises,
enabled by a foundation of 3G (and now 4G/LTE) networks, SPs can
benefit from adopting a digital strategy internally, and by acting as
enablers of digital innovations for customers.
Internal digital solutions include data analytics, tower management, and
software-defined networking (SDN). Service providers will also have
significant opportunities to leverage and adapt their networks to serve
a broader range of customers who provide and support their own
digital initiatives. These “SP as an enabler” examples include smart
factory initiatives in manufacturing, remote experts in financial services
and retail, and connected homes and connected cars.
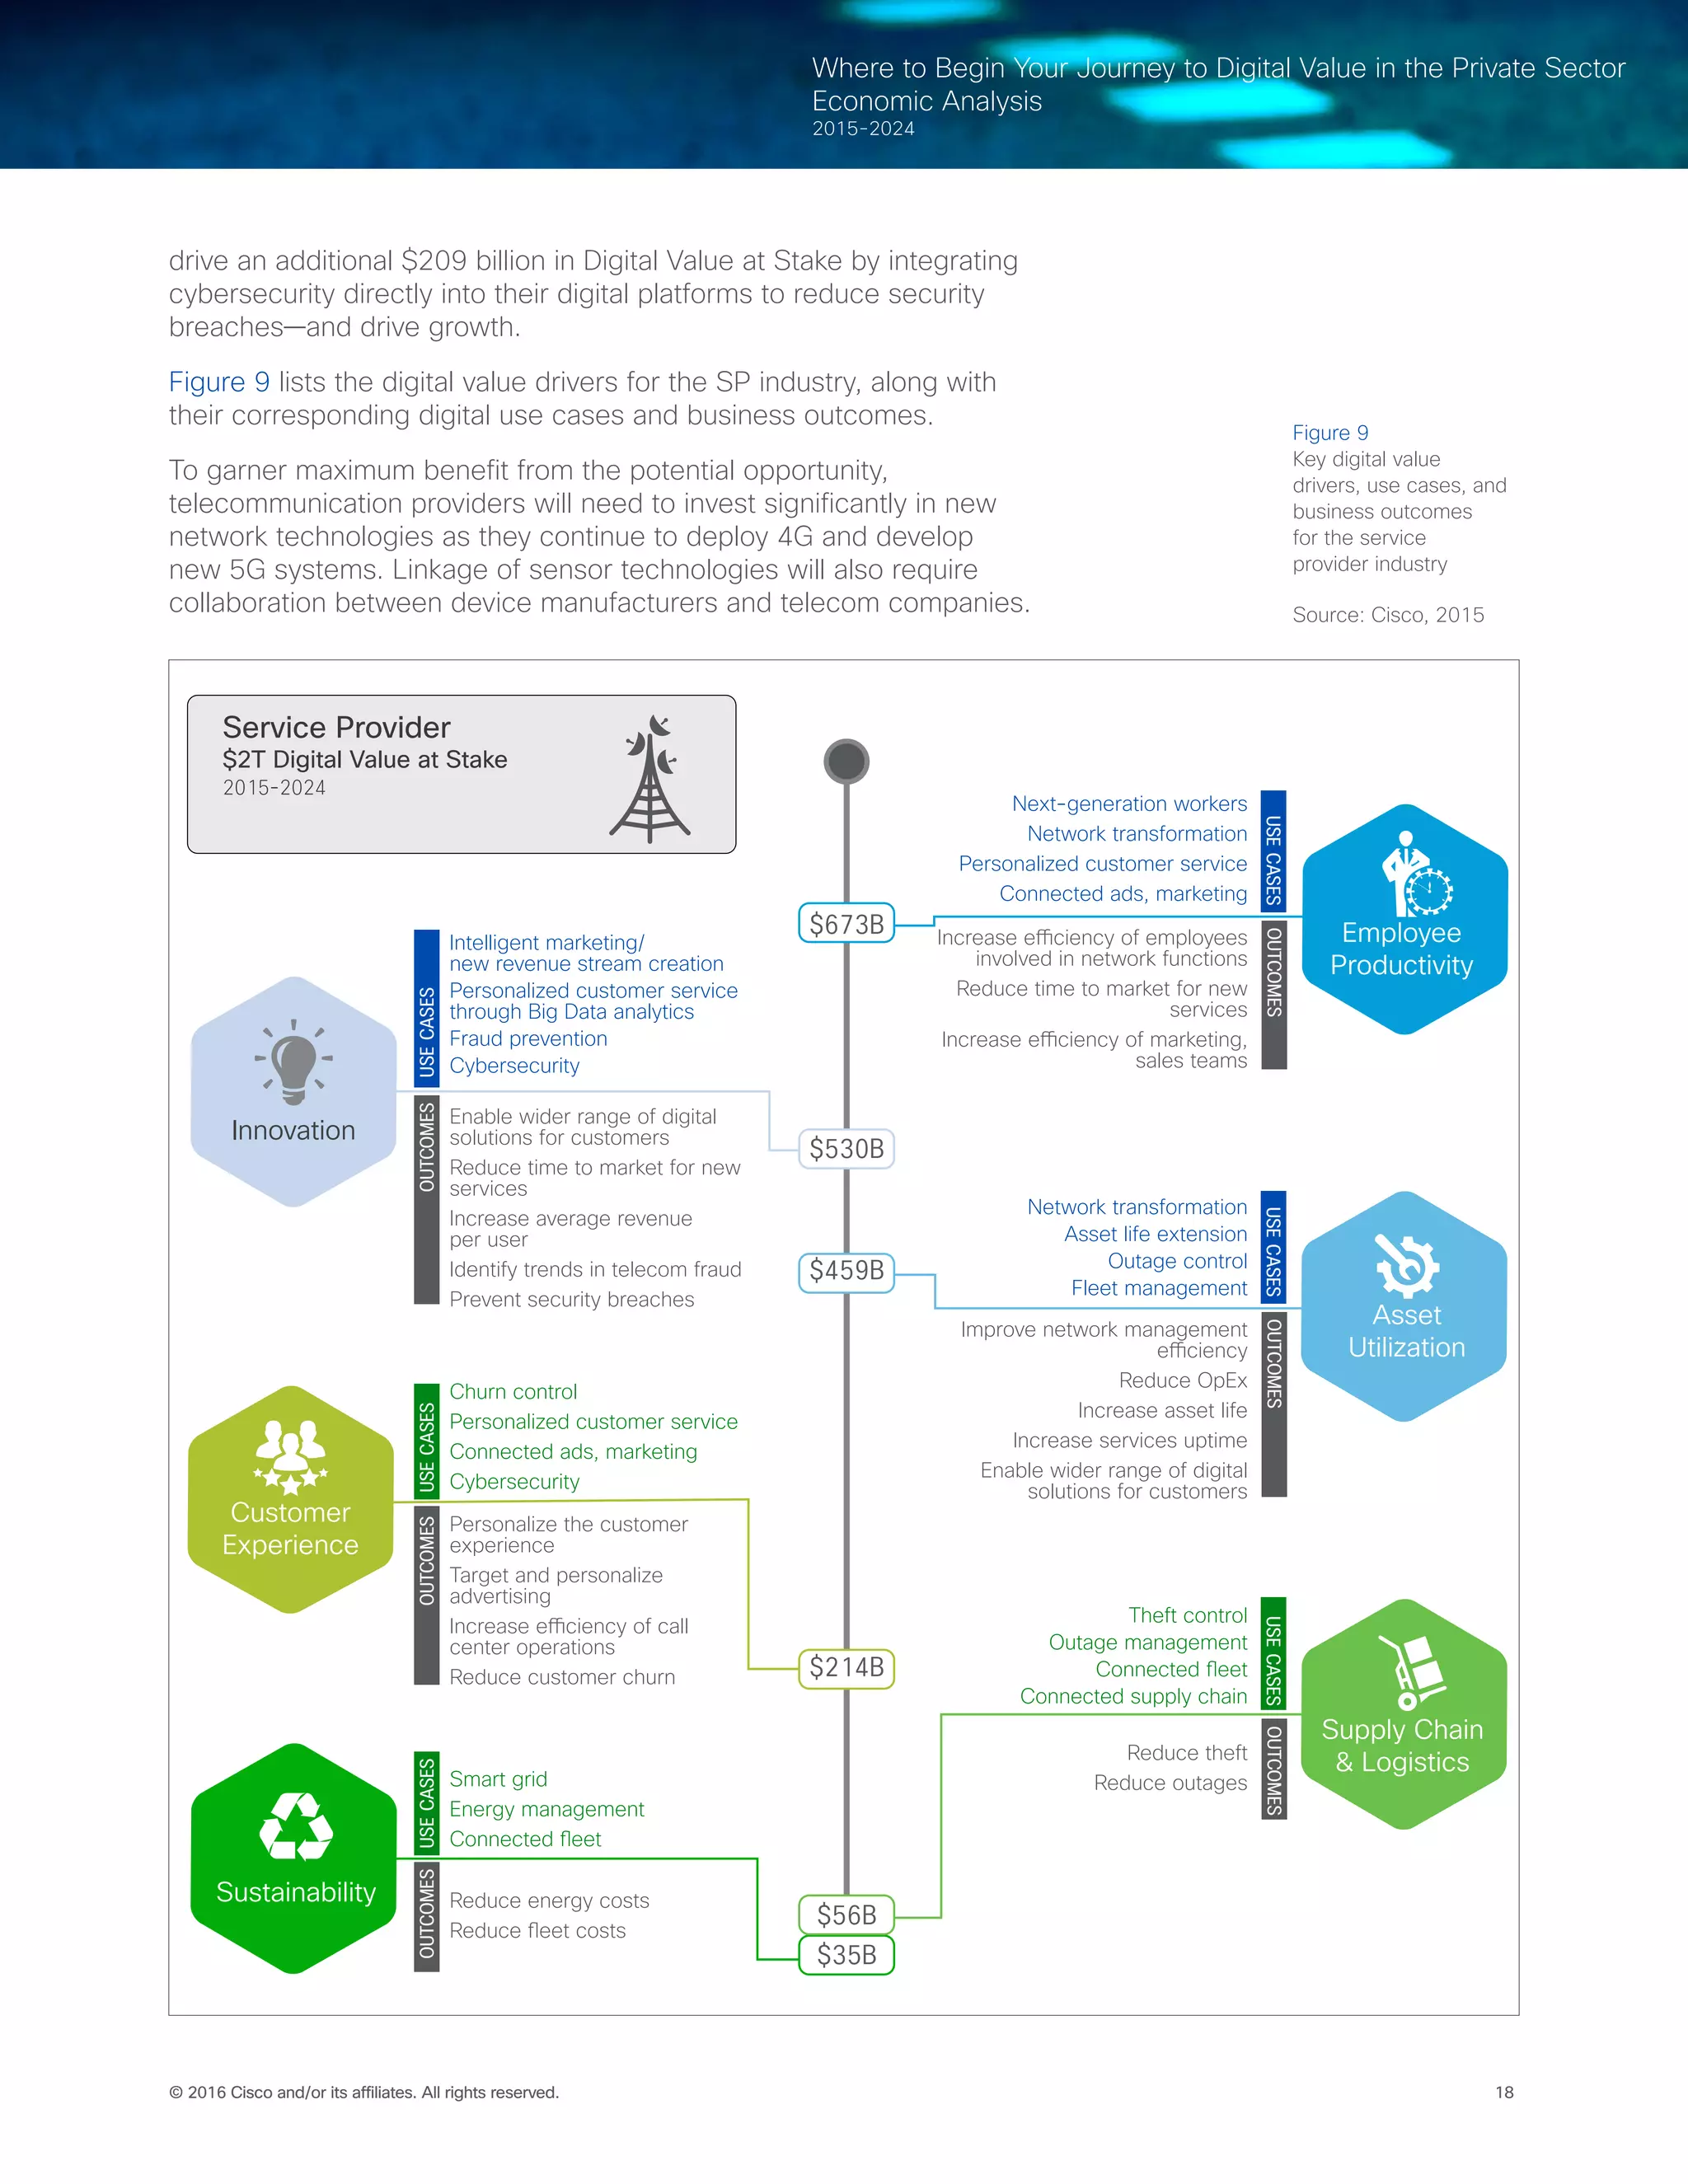
In aggregate, these opportunities represent a $2 trillion Digital Value
at Stake opportunity for the service provider industry over the next
decade.[ ] North America will drive 43 percent of this value, with
Western Europe and Asia Pacific the No. 2- and No. 3-ranked regions
in terms of Digital Value at Stake potential.
Across all regions globally, the SP industry was expected to capture
21 percent ($106 billion) of its potential Digital Value at Stake for
2015—better than most industries, but lagging behind sectors such as
manufacturing and financial services. To capture a larger share of this
value in the future, SPs should view the following digital use cases as
their top priorities:
• SP as an enabler ($494 billion): Deploy and operate any of more
than 300 digital solutions on behalf of customers across the private
and public sectors. Examples include Connected Warehouse
(manufacturing), Checkout Optimizer (retail), and Smart Parking
(public sector). Perhaps the largest “SP as an enabler” opportunity
is Connected Homes, which represents $44 billion in Digital Value
at Stake over the next decade. This includes IP-based, centralized
control of lighting, HVAC, appliances, security locks, and other
systems in homes. Years to mainstream adoption: 5-10 years
• Network transformation ($110 billion): Employing data analytics,
SDN, and network-function virtualization (NFV) in combination to
increase efficiencies and reduce the cost of managing the network.
Years to mainstream adoption: 0-2 years
• Personalized customer service through Big Data analytics ($49
billion): Increase average revenue per user (ARPU) of existing
customers through personalized services extracted from Big Data
analytics. Years to mainstream adoption: 0-2 years
• Churn control ($48 billion): Personalized customer service, leading
to reduced churn of existing customers. Years to mainstream
adoption: 2-5 years
In addition, SPs can capture significant value ($1.1 trillion across the
industry over 10 years) from a number of “horizontal” digital use cases.
For example, adoption of next-generation worker technologies such
as mobile collaboration (BYOD) and video collaboration will generate
$557 billion in Digital Value at Stake across the industry. Another
horizontal use case, connected advertising, has the potential to
produce $278 billion in digital benefits industry-wide by 2024. SPs can
SP as an Enabler
Smart City Networks
A great Wi-Fi experience
at trade shows and events
requires a flexible network.
Wednesday’s banquet might
have a few hundred attendees,
while Thursday’s may have
thousands. Convention centers
also want to make money from
their Wi-Fi investments. Smart
City Networks built and manages
a Wi-Fi network for Santa Clara
(California) Convention Center.
Sponsors and exhibitors can
purchase banner ads that appear
on attendees’ mobile devices
when they connect targeted
locations, such as a specific
booth, the lobby, a session
meeting room, and so on. The
convention center and event
owners appreciate the service
and the new revenue stream.
Attendees enjoy a better event
experience.
[see more]](https://image.slidesharecdn.com/1e798397-18e1-4056-8eb0-b259aaba446c-160219001243/75/Private-Sector-Digital-Value-at-Stake-20-2048.jpg)
![19© 2016 Cisco and/or its affiliates. All rights reserved.
Where to Begin Your Journey to Digital Value in the Private Sector
Economic Analysis
2015-2024
Healthcare
Like any other private sector segment, the healthcare industry—
hospitals and pharmaceutical companies—shoulders a number of
challenges that can be remedied through digital solutions.
For hospitals, key care-abouts include the need to reduce operational
costs, improve the quality and efficiency of care, decrease inpatient
volume, shift from volume- to value-based reimbursement, and
enhance physician-hospital relations. Digital solutions that can address
these concerns include electronic health records, mobile apps,
telehealth, social media, and other patient-friendly technologies.
For pharmaceutical companies, on the other hand, the primary issues
are rising customer expectations, the accelerating costs of research
and development, the need to bring new drugs to market faster
and more efficiently, countering low-cost competition, managing
widely distributed supply chains, and ensuring flexible production.
Digital technologies such as data analytics, social media, cloud, and
mobility can play an essential role in improving customer engagement,
developing collaborative R&D and personalized medicines,
collaborating seamlessly with new partners, and optimizing an end-to-
end value chain to reach new markets.
Based on these and other digital capabilities, the healthcare industry
will generate $1.4 trillion in private sector Digital Value at Stake over
the next decade.[ ] North America will drive 50 percent of this value,
with Western Europe (34 percent) and Asia Pacific (13 percent) the
No. 2- and No. 3-ranked regions, respectively.
Our recent analysis, however, estimated that the healthcare industry
would secure just 16 percent ($67 billion) of its potential Digital Value
at Stake in 2015, leaving considerable room for improvement. To
capture an even larger share of the industry’s potential Digital Value at
Stake in the future, healthcare firms should build their digital strategies
around the following industry-specific and cross-industry use cases:
Hospitals
• Asset utilization ($49 billion): 1) Real-time location system software
and RFID hardware tracks hospital equipment, saving time formerly
spent by nurses to locate it. 2) RFID tags/sensors improve asset
tracking and monitoring of the utilization and working condition
of equipment. 3) Wireless tracking systems reduce inventory
management costs and inventory/medication waste. Years to
mainstream adoption: 0-2 years
• Employee productivity ($46 billion): 1) Analytics-driven systems
align staffing with hospital utilization rates, reducing staffing
shortages/overages and decreasing patient wait times. 2)
Automated dispensing cabinets reduce medication administration
errors and the time spent by nurses to administer medications.
3) Electronic health record systems cut administrative costs. 4)
Analytics help reduce denials by identifying major sources and
frequencies, thus reducing revenue leakage. 5) Linkages to billing
Patient Experience/Employee
Productivity
University of Virginia
Center for Telehealth
What began as a long-distance
care plan for an international
dignitary catalyzed creation of
the University of Virginia (UVA)
Center for Telehealth. The UVA
Center for Telehealth established
a 126-site telehealth network
across Virginia with standards-
based, broadband technologies.
Unified communications include
voice, instant messaging,
presence, voicemail, and
telepresence conferencing,
which interface securely with
other equipment. Other tools
include digital stethoscopes,
otoscopes, and patient cameras.
The telehealth network has
supported 40,000 patient
encounters in 45 specialties,
saving patients more than 15
million miles of travel. It increased
both access to specialty services
and speed of delivery, especially
for stroke care.
[see more]](https://image.slidesharecdn.com/1e798397-18e1-4056-8eb0-b259aaba446c-160219001243/75/Private-Sector-Digital-Value-at-Stake-22-2048.jpg)
![20© 2016 Cisco and/or its affiliates. All rights reserved.
Where to Begin Your Journey to Digital Value in the Private Sector
Economic Analysis
2015-2024
systems facilitate easier audits of challenged costs. Years to
mainstream adoption: 0-2 years
• Patient experience ($6 billion): 1) Telehealth services such as
patient consultations via video conferencing and remote monitoring
of vital signs increase patient reach and revenues. 2) Automated
decision-support tools help reduce medication/diagnostic errors
and associated medical costs, improving physician performance.
3) Automated reminders and mobile apps reduce no-shows
and increase revenues. 4) Digital technologies such as remote
monitoring, mhealth, video conferencing, and social networks
facilitate dynamic interventions that improve adherence to physical
therapy follow-on care. Years to mainstream adoption: 0-2 years
Pharmaceutical Companies
• Smart manufacturing ($39 billion): 1) Predictive analytics improve
asset utilization and reduce maintenance costs. 2) Digital adoption
reduces scrap and rework costs by eliminating wasteful effort. 3)
Equipment monitoring and predictive maintenance extend asset
life. 4) Asset-tracking devices and video security reduce lost/stolen
assets. 5) Real-time environmental monitoring solutions decrease
manufacturing downtime. Years to mainstream adoption: 0-2 years
• Research and development transformation ($31 billion): 1) Virtual
screening/simulations speed the rate of drug discovery and reduce
the need for expensive lab work and clinical trials, thereby cutting
costs. 2) Open collaboration allows companies to benefit from fresh
ideas submitted by innovative scientists and institutions, reducing
research/idea-generation costs. Years to mainstream adoption: 2-5
years
• In-market effectiveness ($14 billion): 1) Technologies such as
medication reminders, medication list software, in-home diagnostic
devices, problem detection algorithms, video conferencing, and
social networks improve medication adherence. 2) Smart monitoring
devices make it easier and more convenient for patients to monitor
themselves, leading to higher-quality preventive care. 3) Drug
delivery technology platforms extend product lifecycles and provide
innovative and convenient means of delivering drugs to patients.
Years to mainstream adoption: 2-5 years
• Product development ($4 billion): 1) Big Data analytics improve
drug clinical trial processes, thereby reducing development costs. 2)
Mobile health monitoring helps clinical research organizations gather
data on subjects without bearing the cost of expensive clinical trials.
3) Big Data analytics and improved collaboration between R&D and
product development teams help reduce time to market. Years to
mainstream adoption: 2-5 years
While industry-specific use cases will drive significant value for the
healthcare industry over the next decade, the biggest contribution—86
percent ($1.2 trillion), the highest percentage of any industry—will
come from cross-industry use cases. Of these, the next-generation
worker use case will produce the most value; it has the potential to
deliver $838 billion in Digital Value at Stake from 2015–24 based
on technologies such as mobile and video collaboration. In addition,
cybersecurity best practices, connected payments, and connected
Employee Productivity/Patient
Experience
Lucile Packard
Children’s Hospital
In many rural areas there is a
shortage of pediatric specialists.
Doctors and sick children must
often travel long distances to
give and receive needed care.
A few years ago, Lucile Packard
Children’s Hospital became the
first facility of its kind to provide
remote clinical interactions for
pediatric care using telehealth
technology. With high-quality
video conferencing, instant
access to patient records, and
network-connected medical
devices that route critical data
from patient to doctor, the
hospital’s virtual visits provide a
true-to-life clinical experience.
Approximately 300 pediatric
patients now receive care-at-a-
distance from the Lucile Packard
Children’s Hospital each month.
[see more]](https://image.slidesharecdn.com/1e798397-18e1-4056-8eb0-b259aaba446c-160219001243/75/Private-Sector-Digital-Value-at-Stake-23-2048.jpg)
![21© 2016 Cisco and/or its affiliates. All rights reserved.
Where to Begin Your Journey to Digital Value in the Private Sector
Economic Analysis
2015-2024
advertising/marketing could add $110 billion, $78 billion, and $61
billion in digital value, respectively, over the next decade.
With one in three consumers projected to have their healthcare
records compromised by cyberattacks in 2016 according to IDC,18
cybersecurity becomes especially critical to driving digital value for the
industry.
Figure 10 lists the primary digital value drivers for the healthcare
industry, along with their corresponding digital use cases and business
outcomes.
Healthcare
$1.4T Digital Value at Stake
2015-2024
[H]=Hospital, [P]=Pharma
Reduced errors [H]
Improved administrative efficiency [H]
Staffing optimization [H]
Improved medication administration [H]
Reduced no-shows [H]
Unplanned downtime management [P]
Research transformation [P]
Next-generation workers
Asset
Utilization
Reduced equipment loss
and theft [H]
Reduced time spent on
equipment search [H]
Predictive maintenance of
equipment
Asset life/loss management [P]
Downtime management [P]
Cybersecurity
Reduce OpEx
Reduce nurse search time
Increase life, reduce depreciation
of medical equipment
Improve equipment utilization
Ensure compliance
Minimize waste
Sustainability
Supply Chain
& Logistics
Reduce inventory waste and
management costs
Reduce denials cost, revenue
leakage
Improve drug clinical trial
processes
Improve manufacturing
productivity
Extend product life cycle
Consumables/perishables
tracking [H]
Claims management [H]
Inventory management [H]
R&D cost control [P]
Reduce scrap and rework
Pharmacy drug delivery [P]
Reach more patients
Increase revenue
Reduce time to market
Telehealth services [H]
Reduced time to market [P]
Next-generation smart devices [P]
Innovation
$880B
$207B
$138B
$81B
$59B
$29B
Employee
Productivity
Customer
Experience
Reduce errors
Improve physician performance
Reduce administrative costs
Allocate staff more efficiently
Reduce no-shows
Reduce cost of drug siscovery
Increase marketing
accuracy, effectiveness
Customize production
output based on better
estimates of warranty claims
Reduce waste
Reduced scrap and rework
Reduce errors and increase
accuracy of diagnoses
Reduce duplications
Improve adherence to therapy
Improve patient engagement
Improved administrative
efficiency [H]
Reduced errors [H]
Telehealth services [H]
Patient compliance [H]
Reduced no-shows [H]
Drug compliance [P]
USECASESOUTCOMESUSECASESOUTCOMESUSECASESOUTCOMES
USECASESOUTCOMESUSECASESOUTCOMESUSECASESOUTCOMES
Figure 10
Key digital value
drivers, use cases, and
business outcomes for
the healthcare industry
Source: Cisco, 2015](https://image.slidesharecdn.com/1e798397-18e1-4056-8eb0-b259aaba446c-160219001243/75/Private-Sector-Digital-Value-at-Stake-24-2048.jpg)
![22© 2016 Cisco and/or its affiliates. All rights reserved.
Where to Begin Your Journey to Digital Value in the Private Sector
Economic Analysis
2015-2024
As we’ve seen, healthcare firms should build their digital strategies
around capabilities such as sensors, remote diagnostics and
collaboration solutions, automation, and advanced analytics to benefit
patient management and to optimize expenses. By adopting the digital
use cases mentioned above, an average hospital or pharmaceutical
company will enjoy an estimated bottom-line (EBIT) improvement of 11
percent or 8 percent, respectively.
Oil and Gas
With worldwide production outpacing demand, oil price declines of
more than 60 percent have upended the oil and gas (O&G) sector—
and dominate the agendas of industry executives. While the industry
has seen many downturns before, a confluence of powerful dynamics
suggests this one is different. Oil and gas companies must avoid the
temptation simply to cut costs until the price slump passes.
In a recent Cisco survey, oil and gas leaders indicated that they are
focusing on getting more out of what they already have. Survey
respondents named “operational efficiency of existing projects” and
“maintenance of assets and infrastructure” as the top two areas of
increased investment over the next 24 months.
To maximize operational efficiency, oil and gas companies must
address the “data deluge”—much of it increasingly generated by
networked connections among people, processes, data, and things.
Many view this as a major challenge: a majority of respondents to
Cisco’s survey named “data” as the area they need to improve most to
take advantage of digital technologies. However, O&G leaders clearly
understand data’s potential—they named “data analytics for faster,
better decision-making” as the No. 1 driver for digital investment.
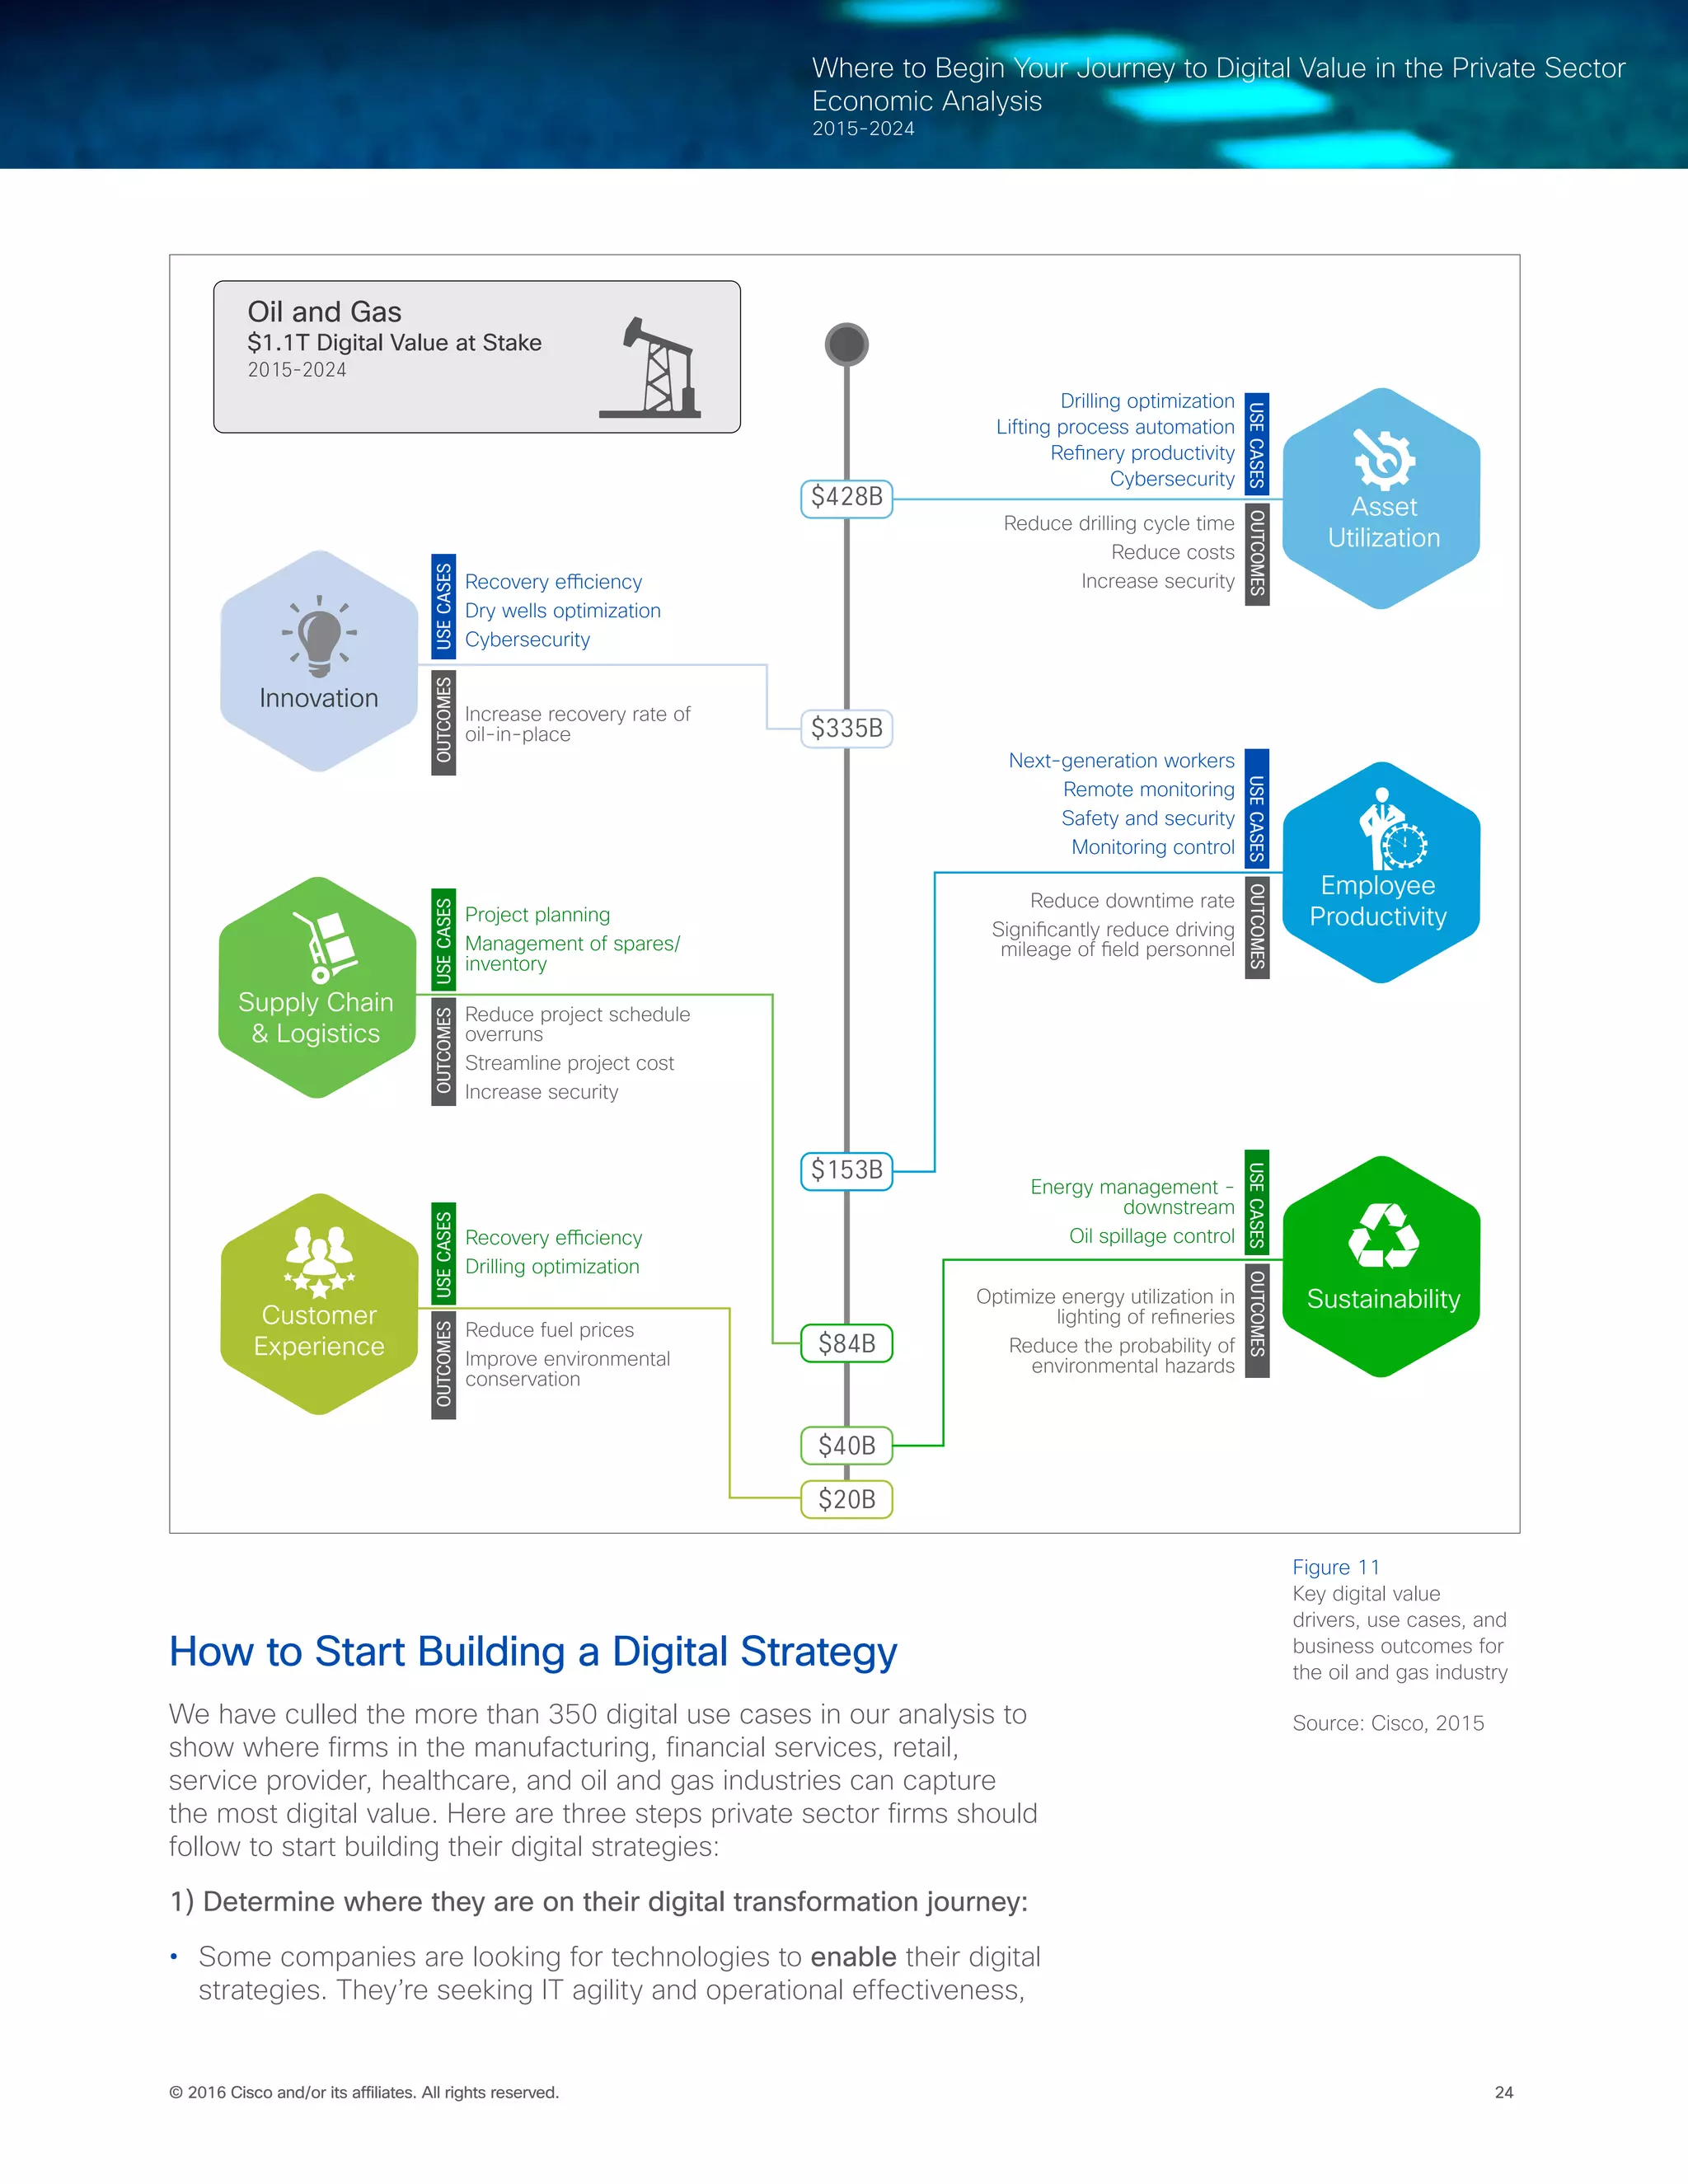
In all, Cisco estimates that the O&G industry will generate $1.1
trillion in Digital Value at Stake from 2015-2024.19
[ ] While digital
technologies and processes can improve efficiency and cost savings
throughout the oil and gas value chain (upstream, midstream,
downstream), Cisco’s analysis indicates that they can make the biggest
impact in upstream operations: improvements in recovery efficiency
and production automation drive the largest benefits. This mirrors the
findings of Cisco’s survey, in which respondents identified production,
development, and exploration (all of which are upstream operations) as
the three areas positioned to benefit most from digital adoption in oil
and gas.
According to Cisco’s analysis, nearly one-third of the O&G industry’s
Digital Value at Stake over the next decade will come from North
America (35 percent), followed by Eastern Europe (17 percent), the
Middle East (13 percent), Latin America (11 percent), Asia Pacific (9
percent), Western Europe (8 percent), and Africa (7 percent).20
Largely due to an increased focus on IT/OT convergence, the oil
and gas industry was poised to capture 27 percent ($69 billion)
of its potential Digital Value at Stake in 2015—the second-highest
percentage of any industry. To secure an even higher share of their
For more insights, please visit
cs.co/og-automate](https://image.slidesharecdn.com/1e798397-18e1-4056-8eb0-b259aaba446c-160219001243/75/Private-Sector-Digital-Value-at-Stake-25-2048.jpg)
![23© 2016 Cisco and/or its affiliates. All rights reserved.
Where to Begin Your Journey to Digital Value in the Private Sector
Economic Analysis
2015-2024
potential Digital Value at Stake in the future, oil and gas firms should
focus on the following use cases:
• Recovery efficiency ($278 billion): Enhanced oil-recovery
techniques include permanent reservoir monitoring (PRM) and
advanced analytics of 4D seismic data analysis. These capabilities
have the potential to increase recovery of oil-in-place from 35
percent to about 42 percent. Years to mainstream adoption: 0-2
years
• Lifting-process automation ($194 billion): Automate and remote-
manage the production process, and streamline operations through
accurate measurement of critical field parameters such as pressure,
flow rate, and temperature in near-real-time. Years to mainstream
adoption: 2-5 years
• Remote monitoring ($191 billion): Early detection and swift reaction
to leakages, theft, and rig downtime through remote monitoring.
Also supports faster problem resolution by spotting the exact
failure code prior to dispatching a technician. Years to mainstream
adoption: 0-2 years
• Drilling optimization ($93 billion): Data management and Big Data
analytics drive efficiencies through standardization and simplification
(by bundling similar wells). This reduces non-productive learning
time and enables faster well execution. Years to mainstream
adoption: 2-5 years
• Project planning ($20 billion): By using Big Data analytics to
improve project outlay estimates, firms can prevent cost escalations.
Years to mainstream adoption: 2-5 years
In addition, oil and gas firms can capture substantial value ($232 billion
across the industry over 10 years) from a number of horizontal digital
use cases. For example, O&G companies can drive $86 billion in Digital
Value at Stake by integrating cybersecurity directly into their digital
platforms to reduce security breaches—and drive growth. In addition,
adoption of next-generation worker technologies such as mobile
collaboration, bring your own device (BYOD), and video collaboration
will generate $45 billion in Digital Value at Stake across the industry.
Another horizontal use case, connected supply chain, has the potential
to produce $37 billion in digital benefits industry-wide by 2024.
Figure 11 (next page) lists the primary digital value drivers for the oil
and gas industry, along with their corresponding digital use cases and
business outcomes.
When the price of oil stood at more than $100 per barrel, the need for
oil and gas companies to improve operational efficiencies was primarily
driven by the competitive marketplace—and many firms took no action
at all. Now, however, increased efficiency has become a business
imperative that will determine both survival and competitive advantage.
The time for oil and gas companies to act is now—through a strategic
digital transformation underpinned by a new approach to people,
process, and technology.
Next-generation Worker
Technologies
Explorer Pipeline
Explorer Pipeline’s employees
work in company offices, home
offices, and along 1830 miles of
pipeline. Non-office employees
were left out of certain
conversations. For example, they
could view streaming video of
training and safety meetings, but
they couldn’t participate. Video-
based collaboration brings all
employees together, even from
pump stations and the field.
They can start a voice, video,
or chat session with the touch
of a button. Distributed teams
now meet “in-person” without
travel time and costs. They
collaborate better because of
the personal connection they get
from video. Remote employees
can participate fully in training
and safety meetings. Managers
conduct initial job interviews with
video conferencing, avoiding
travel costs.
[see more]](https://image.slidesharecdn.com/1e798397-18e1-4056-8eb0-b259aaba446c-160219001243/75/Private-Sector-Digital-Value-at-Stake-26-2048.jpg)

This document discusses the value of digitization for private sector industries over the next decade. It finds that six industries - manufacturing, financial services, retail, service provider, healthcare, and oil and gas - will account for nearly three-quarters of the total private sector digital value globally from 2015-2024. However, in 2015 companies on average captured only 20% of their potential digital value. The document recommends that companies determine where they are on their digital journey and focus first on enabling IT agility and operational effectiveness before using digital technologies to differentiate strategy and business models.


![Accenture technology vision_2013_feb_18[1]](https://cdn.slidesharecdn.com/ss_thumbnails/accenturetechnologyvision2013feb181-130219175952-phpapp01-thumbnail.jpg?width=640&height=640&fit=bounds)


