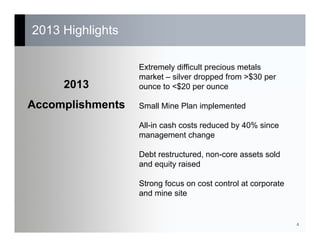
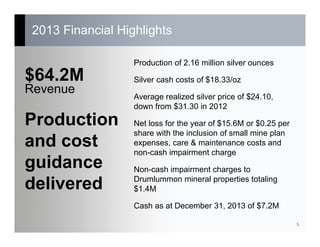
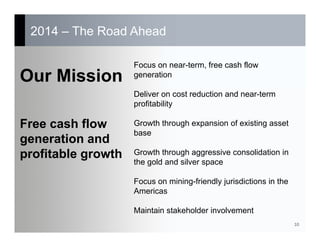
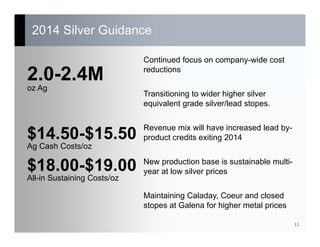
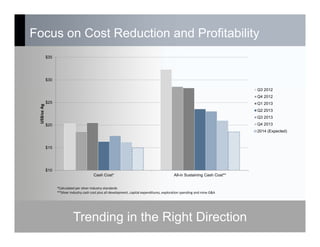
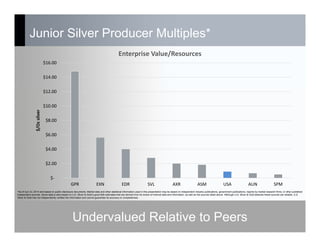
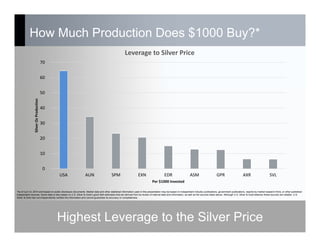
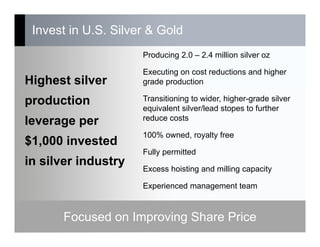
Annual General Meeting
May 20, 2014
Forward Looking Statement
2
Certain information in this presentation may contain forward-looking statements. This information is based on current expectations
that are subject to significant risks, assumptions and uncertainties that are difficult to predict. Potential risks include: that U.S. Silver
& Gold may not achieve anticipated synergies; loss of key personnel; reduction in the anticipated cash levels; and, not achieving
production goals stated. Actual results might differ materially from results suggested in any forward-looking statements. All
statements, other than statements of historical fact, included in the presentation, including, without limitation, statements regarding
potential mineralization and reserves, exploration results, and future plans and objectives of U.S. Silver & Gold, are forward-looking
statements. Words such as “expect”, “anticipate”, “estimate”, “may”, “will”, “should”, “intend”, “believe” and other similar expressions
are forward-looking statements. Forward-looking statements are not guarantees of future results and conditions but rather reflect
our current views with respect to future events and are subject to risks, uncertainties, assumptions and other factors, and actual
results and future events could differ materially from those anticipated in such statements. There can be no assurance that such
forward-looking statements will prove to be accurate. U.S. Silver & Gold assumes no obligation to update the forward-looking
statements, or to update the reasons why actual results could differ from those reflected in the forward looking-statements unless
and until required by securities laws applicable to the U.S. Silver & Gold. Additional information identifying risks and uncertainties is
contained in filings by U.S. Silver & Gold with the Canadian securities regulators, which filings are available at www.sedar.com.
An additional Cautionary Note to Investors – In the event that we use certain terms in this presentation, such as “resource”,
“measured resource”, “indicated resource” and “inferred resource”. U.S. investors are cautioned that, while such terms are
recognized and required by Canadian Securities Laws, the United States Securities and Exchange Commission does not recognize
them. Under U.S. standards, mineralization may not be classified as a “reserve” unless the determination has been made that the
mineralization could be economically and legally produced or extracted at the time the reserve determination has been made. U.S.
investors should not assume that all or any part of measured or indicated resources will ever be converted into reserves. In
addition, “inferred resources” have a great amount of uncertainty as to their existence and as to whether they can be mined legally
or economically. Accordingly, information concerning descriptions of mineralization in this presentation may not be comparable to
information made public by companies that are subject to the SEC’s Industry Guide 7.
Mr. Jim Atkinson, Vice President, Exploration and a Qualified Person under Canadian Securities Administrators guidelines has
approved the applicable contents of this presentation.
AGENDA
2013 Financial and Operating Results
2014 - The Road Ahead
Remaining Profitable at Low Silver Prices
3
2013 Highlights
Extremely difficult precious metals
market – silver dropped from >$30 per
ounce to <$20 per ounce
Small Mine Plan implemented
All-in cash costs reduced by 40% since
management change
Debt restructured, non-core assets sold
and equity raised
Strong focus on cost control at corporate
and mine site
4
2013
Accomplishments
2013 Financial Highlights
5
$64.2M
Revenue
Production
and cost
guidance
delivered
Production of 2.16 million silver ounces
Silver cash costs of $18.33/oz
Average realized silver price of $24.10,
down from $31.30 in 2012
Net loss for the year of $15.6M or $0.25 per
share with the inclusion of small mine plan
expenses, care & maintenance costs and
non-cash impairment charge
Non-cash impairment charges to
Drumlummon mineral properties totaling
$1.4M
Cash as at December 31, 2013 of $7.2M
2013 Operating Highlights-Production/Cash Costs
2.42
2.27
2.31
2.12
2.16
2.20
10.00
12.50
15.00
17.50
20.00
1.50
1.75
2.00
2.25
2.50
2009A 2010A 2011A 2012A 2013A 2014E
Cash cost/oz. Ag ($)
Ag Oz. Produced (MM)
Silver Production
oz. in MM 
Galena Complex - Small Mine Plan
$33.19/oz
$19.61/oz
0
5,000
10,000
15,000
20,000
25,000
8
10
12
14
16
18
20
Oct‐12 Jan‐13 Apr‐13 Jul‐13 Oct‐13
Oremilled,tons
Grade,oz/tonAgEq
Galena Production
Tonnage Grade Silver Price
Silver equivalent (AgEq) calculated using $22.00/oz silver, $0.90/lb lead and $3.25/lb copper
Reducing Tons, Increasing Grade
2013 Exploration Highlights
8
60,666
feet of drilling
Re-examination
of over 3,100
DD holes to
identify targets
Drilling continues to cost effectively explore
resources at modest expenditure levels
close to infrastructure
Successful drill program with delineation of
new resources to enhance the current
mining plan
Digital input of past logs ongoing
Block modeling of veins commenced
New Resource/Reserve update at end of
2014
Continue to explore identified brownfield
targets with drilling program in 2014
2014 – The Road Ahead
9
2014 – The Road Ahead
10
Focus on near-term, free cash flow
generation
Deliver on cost reduction and near-term
profitability
Growth through expansion of existing asset
base
Growth through aggressive consolidation in
the gold and silver space
Focus on mining-friendly jurisdictions in the
Americas
Maintain stakeholder involvement
Our Mission
Free cash flow
generation and
profitable growth
2014 Silver Guidance
11
2.0-2.4M
oz Ag
$14.50-$15.50
Ag Cash Costs/oz
$18.00-$19.00
All-in Sustaining Costs/oz
Continued focus on company-wide cost
reductions
Transitioning to wider higher silver
equivalent grade silver/lead stopes.
Revenue mix will have increased lead by-
product credits exiting 2014
New production base is sustainable multi-
year at low silver prices
Maintaining Caladay, Coeur and closed
stopes at Galena for higher metal prices
Focus on Cost Reduction and Profitability
$10
$15
$20
$25
$30
$35
Cash Cost* All-in Sustaining Cash Cost**
US$/ozAg
Q3 2012
Q4 2012
Q1 2013
Q2 2013
Q3 2013
Q4 2013
2014 (Expected)
Trending in the Right Direction
*Calculated per silver industry standards
**Silver industry cash cost plus all development, capital expenditures, exploration spending and mine G&A
Junior Silver Producer Multiples*
 $‐
 $2.00
 $4.00
 $6.00
 $8.00
 $10.00
 $12.00
 $14.00
 $16.00
GPR EXN EDR SVL AXR ASM USA AUN SPM
$/Oz silver
Enterprise Value/Resources
*As of April 30, 2014 and based on public disclosure documents. Market data and other statistical information used in this presentation may be based on independent industry publications, government publications, reports by market research firms, or other published
independent sources. Some data is also based on U.S. Silver & Gold’s good faith estimates that are derived from its review of internal data and information, as well as the sources listed above. Although U.S. Silver & Gold believes these sources are reliable, U.S.
Silver & Gold has not independently verified the information and cannot guarantee its accuracy or completeness.
Undervalued Relative to Peers
How Much Production Does $1000 Buy?*
Highest Leverage to the Silver Price
*As of April 30, 2014 and based on public disclosure documents. Market data and other statistical information used in this presentation may be based on independent industry publications, government publications, reports by market research firms, or other published
independent sources. Some data is also based on U.S. Silver & Gold’s good faith estimates that are derived from its review of internal data and information, as well as the sources listed above. Although U.S. Silver & Gold believes these sources are reliable, U.S.
Silver & Gold has not independently verified the information and cannot guarantee its accuracy or completeness.
0
10
20
30
40
50
60
70
USA AUN SPM EXN EDR ASM GPR AXR SVL
Silver Oz Production
Per $1000 Invested
Leverage to Silver Price
Invest in U.S. Silver & Gold
15
Producing 2.0 – 2.4 million silver oz
Executing on cost reductions and higher
grade production
Transitioning to wider, higher-grade silver
equivalent silver/lead stopes to further
reduce costs
100% owned, royalty free
Fully permitted
Excess hoisting and milling capacity
Experienced management team
Highest silver
production
leverage per
$1,000 invested
in silver industry
Focused on Improving Share Price
Contact Us
16
Darren Blasutti
President and CEO
416‐848‐9503
Nicole Richard
Investor Relations
416‐848‐9503
www.us‐silver.com

US Silver & Gold Inc. Annual General Meeting Presentation

  • 1.
  • 2.
    Forward Looking Statement 2 Certaininformation in this presentation may contain forward-looking statements. This information is based on current expectations that are subject to significant risks, assumptions and uncertainties that are difficult to predict. Potential risks include: that U.S. Silver & Gold may not achieve anticipated synergies; loss of key personnel; reduction in the anticipated cash levels; and, not achieving production goals stated. Actual results might differ materially from results suggested in any forward-looking statements. All statements, other than statements of historical fact, included in the presentation, including, without limitation, statements regarding potential mineralization and reserves, exploration results, and future plans and objectives of U.S. Silver & Gold, are forward-looking statements. Words such as “expect”, “anticipate”, “estimate”, “may”, “will”, “should”, “intend”, “believe” and other similar expressions are forward-looking statements. Forward-looking statements are not guarantees of future results and conditions but rather reflect our current views with respect to future events and are subject to risks, uncertainties, assumptions and other factors, and actual results and future events could differ materially from those anticipated in such statements. There can be no assurance that such forward-looking statements will prove to be accurate. U.S. Silver & Gold assumes no obligation to update the forward-looking statements, or to update the reasons why actual results could differ from those reflected in the forward looking-statements unless and until required by securities laws applicable to the U.S. Silver & Gold. Additional information identifying risks and uncertainties is contained in filings by U.S. Silver & Gold with the Canadian securities regulators, which filings are available at www.sedar.com. An additional Cautionary Note to Investors – In the event that we use certain terms in this presentation, such as “resource”, “measured resource”, “indicated resource” and “inferred resource”. U.S. investors are cautioned that, while such terms are recognized and required by Canadian Securities Laws, the United States Securities and Exchange Commission does not recognize them. Under U.S. standards, mineralization may not be classified as a “reserve” unless the determination has been made that the mineralization could be economically and legally produced or extracted at the time the reserve determination has been made. U.S. investors should not assume that all or any part of measured or indicated resources will ever be converted into reserves. In addition, “inferred resources” have a great amount of uncertainty as to their existence and as to whether they can be mined legally or economically. Accordingly, information concerning descriptions of mineralization in this presentation may not be comparable to information made public by companies that are subject to the SEC’s Industry Guide 7. Mr. Jim Atkinson, Vice President, Exploration and a Qualified Person under Canadian Securities Administrators guidelines has approved the applicable contents of this presentation.
  • 3.
    AGENDA 2013 Financial andOperating Results 2014 - The Road Ahead Remaining Profitable at Low Silver Prices 3
  • 4.
    2013 Highlights Extremely difficultprecious metals market – silver dropped from >$30 per ounce to <$20 per ounce Small Mine Plan implemented All-in cash costs reduced by 40% since management change Debt restructured, non-core assets sold and equity raised Strong focus on cost control at corporate and mine site 4 2013 Accomplishments
  • 5.
    2013 Financial Highlights 5 $64.2M Revenue Production andcost guidance delivered Production of 2.16 million silver ounces Silver cash costs of $18.33/oz Average realized silver price of $24.10, down from $31.30 in 2012 Net loss for the year of $15.6M or $0.25 per share with the inclusion of small mine plan expenses, care & maintenance costs and non-cash impairment charge Non-cash impairment charges to Drumlummon mineral properties totaling $1.4M Cash as at December 31, 2013 of $7.2M
  • 6.
    2013 Operating Highlights-Production/CashCosts 2.42 2.27 2.31 2.12 2.16 2.20 10.00 12.50 15.00 17.50 20.00 1.50 1.75 2.00 2.25 2.50 2009A 2010A 2011A 2012A 2013A 2014E Cash cost/oz. Ag ($) Ag Oz. Produced (MM) Silver Production oz. in MM 
  • 7.
    Galena Complex -Small Mine Plan $33.19/oz $19.61/oz 0 5,000 10,000 15,000 20,000 25,000 8 10 12 14 16 18 20 Oct‐12 Jan‐13 Apr‐13 Jul‐13 Oct‐13 Oremilled,tons Grade,oz/tonAgEq Galena Production Tonnage Grade Silver Price Silver equivalent (AgEq) calculated using $22.00/oz silver, $0.90/lb lead and $3.25/lb copper Reducing Tons, Increasing Grade
  • 8.
    2013 Exploration Highlights 8 60,666 feetof drilling Re-examination of over 3,100 DD holes to identify targets Drilling continues to cost effectively explore resources at modest expenditure levels close to infrastructure Successful drill program with delineation of new resources to enhance the current mining plan Digital input of past logs ongoing Block modeling of veins commenced New Resource/Reserve update at end of 2014 Continue to explore identified brownfield targets with drilling program in 2014
  • 9.
    2014 – TheRoad Ahead 9
  • 10.
    2014 – TheRoad Ahead 10 Focus on near-term, free cash flow generation Deliver on cost reduction and near-term profitability Growth through expansion of existing asset base Growth through aggressive consolidation in the gold and silver space Focus on mining-friendly jurisdictions in the Americas Maintain stakeholder involvement Our Mission Free cash flow generation and profitable growth
  • 11.
    2014 Silver Guidance 11 2.0-2.4M ozAg $14.50-$15.50 Ag Cash Costs/oz $18.00-$19.00 All-in Sustaining Costs/oz Continued focus on company-wide cost reductions Transitioning to wider higher silver equivalent grade silver/lead stopes. Revenue mix will have increased lead by- product credits exiting 2014 New production base is sustainable multi- year at low silver prices Maintaining Caladay, Coeur and closed stopes at Galena for higher metal prices
  • 12.
    Focus on CostReduction and Profitability $10 $15 $20 $25 $30 $35 Cash Cost* All-in Sustaining Cash Cost** US$/ozAg Q3 2012 Q4 2012 Q1 2013 Q2 2013 Q3 2013 Q4 2013 2014 (Expected) Trending in the Right Direction *Calculated per silver industry standards **Silver industry cash cost plus all development, capital expenditures, exploration spending and mine G&A
  • 13.
    Junior Silver ProducerMultiples*  $‐  $2.00  $4.00  $6.00  $8.00  $10.00  $12.00  $14.00  $16.00 GPR EXN EDR SVL AXR ASM USA AUN SPM $/Oz silver Enterprise Value/Resources *As of April 30, 2014 and based on public disclosure documents. Market data and other statistical information used in this presentation may be based on independent industry publications, government publications, reports by market research firms, or other published independent sources. Some data is also based on U.S. Silver & Gold’s good faith estimates that are derived from its review of internal data and information, as well as the sources listed above. Although U.S. Silver & Gold believes these sources are reliable, U.S. Silver & Gold has not independently verified the information and cannot guarantee its accuracy or completeness. Undervalued Relative to Peers
  • 14.
    How Much ProductionDoes $1000 Buy?* Highest Leverage to the Silver Price *As of April 30, 2014 and based on public disclosure documents. Market data and other statistical information used in this presentation may be based on independent industry publications, government publications, reports by market research firms, or other published independent sources. Some data is also based on U.S. Silver & Gold’s good faith estimates that are derived from its review of internal data and information, as well as the sources listed above. Although U.S. Silver & Gold believes these sources are reliable, U.S. Silver & Gold has not independently verified the information and cannot guarantee its accuracy or completeness. 0 10 20 30 40 50 60 70 USA AUN SPM EXN EDR ASM GPR AXR SVL Silver Oz Production Per $1000 Invested Leverage to Silver Price
  • 15.
    Invest in U.S.Silver & Gold 15 Producing 2.0 – 2.4 million silver oz Executing on cost reductions and higher grade production Transitioning to wider, higher-grade silver equivalent silver/lead stopes to further reduce costs 100% owned, royalty free Fully permitted Excess hoisting and milling capacity Experienced management team Highest silver production leverage per $1,000 invested in silver industry Focused on Improving Share Price
  • 16.