Course name:
probability andRandom process
Chapter 6.
Process of Measurements
Eng. Abdirahman Farah Ali
Jamhuriya University Of Science and Technology
2.
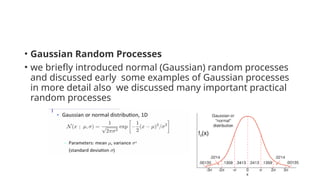
• Gaussian RandomProcesses
• we briefly introduced normal (Gaussian) random processes
and discussed early some examples of Gaussian processes
in more detail also we discussed many important practical
random processes
3.
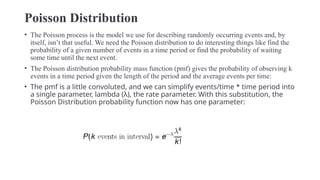
Poisson Distribution
• ThePoisson process is the model we use for describing randomly occurring events and, by
itself, isn’t that useful. We need the Poisson distribution to do interesting things like find the
probability of a given number of events in a time period or find the probability of waiting
some time until the next event.
• The Poisson distribution probability mass function (pmf) gives the probability of observing k
events in a time period given the length of the period and the average events per time:
• The pmf is a little convoluted, and we can simplify events/time * time period into
a single parameter, lambda (λ), the rate parameter. With this substitution, the
Poisson Distribution probability function now has one parameter:
4.
Noise
• In anycommunication system, during the transmission of the signal,
or while receiving the signal, some unwanted signal gets introduced
into the communication, making it unpleasant for the receiver,
questioning the quality of the communication. Such a disturbance is
called as Noise.
• Noise is an unwanted signal which interferes with the original
message signal and corrupts the parameters of the message signal.
• This alteration in the communication process, leads to the message
getting altered.
• It is most likely to be entered at the channel or the receiver.
5.
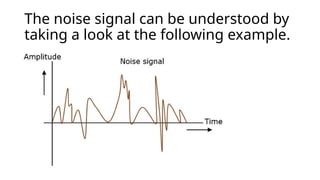
The noise signalcan be understood by
taking a look at the following example.
6.
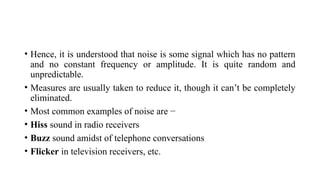
• Hence, itis understood that noise is some signal which has no pattern
and no constant frequency or amplitude. It is quite random and
unpredictable.
• Measures are usually taken to reduce it, though it can’t be completely
eliminated.
• Most common examples of noise are −
• Hiss sound in radio receivers
• Buzz sound amidst of telephone conversations
• Flicker in television receivers, etc.
7.
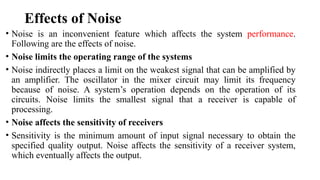
Effects of Noise
•Noise is an inconvenient feature which affects the system performance.
Following are the effects of noise.
• Noise limits the operating range of the systems
• Noise indirectly places a limit on the weakest signal that can be amplified by
an amplifier. The oscillator in the mixer circuit may limit its frequency
because of noise. A system’s operation depends on the operation of its
circuits. Noise limits the smallest signal that a receiver is capable of
processing.
• Noise affects the sensitivity of receivers
• Sensitivity is the minimum amount of input signal necessary to obtain the
specified quality output. Noise affects the sensitivity of a receiver system,
which eventually affects the output.
8.
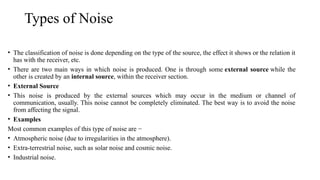
Types of Noise
•The classification of noise is done depending on the type of the source, the effect it shows or the relation it
has with the receiver, etc.
• There are two main ways in which noise is produced. One is through some external source while the
other is created by an internal source, within the receiver section.
• External Source
• This noise is produced by the external sources which may occur in the medium or channel of
communication, usually. This noise cannot be completely eliminated. The best way is to avoid the noise
from affecting the signal.
• Examples
Most common examples of this type of noise are −
• Atmospheric noise (due to irregularities in the atmosphere).
• Extra-terrestrial noise, such as solar noise and cosmic noise.
• Industrial noise.
9.
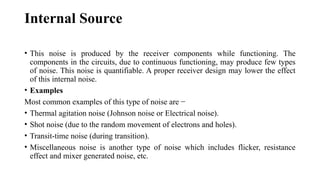
Internal Source
• Thisnoise is produced by the receiver components while functioning. The
components in the circuits, due to continuous functioning, may produce few types
of noise. This noise is quantifiable. A proper receiver design may lower the effect
of this internal noise.
• Examples
Most common examples of this type of noise are −
• Thermal agitation noise (Johnson noise or Electrical noise).
• Shot noise (due to the random movement of electrons and holes).
• Transit-time noise (during transition).
• Miscellaneous noise is another type of noise which includes flicker, resistance
effect and mixer generated noise, etc.
10.
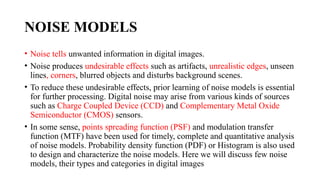
NOISE MODELS
• Noisetells unwanted information in digital images.
• Noise produces undesirable effects such as artifacts, unrealistic edges, unseen
lines, corners, blurred objects and disturbs background scenes.
• To reduce these undesirable effects, prior learning of noise models is essential
for further processing. Digital noise may arise from various kinds of sources
such as Charge Coupled Device (CCD) and Complementary Metal Oxide
Semiconductor (CMOS) sensors.
• In some sense, points spreading function (PSF) and modulation transfer
function (MTF) have been used for timely, complete and quantitative analysis
of noise models. Probability density function (PDF) or Histogram is also used
to design and characterize the noise models. Here we will discuss few noise
models, their types and categories in digital images
11.
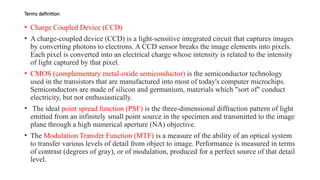
Terms definition
• ChargeCoupled Device (CCD)
• A charge-coupled device (CCD) is a light-sensitive integrated circuit that captures images
by converting photons to electrons. A CCD sensor breaks the image elements into pixels.
Each pixel is converted into an electrical charge whose intensity is related to the intensity
of light captured by that pixel.
• CMOS (complementary metal-oxide semiconductor) is the semiconductor technology
used in the transistors that are manufactured into most of today's computer microchips.
Semiconductors are made of silicon and germanium, materials which "sort of" conduct
electricity, but not enthusiastically.
• The ideal point spread function (PSF) is the three-dimensional diffraction pattern of light
emitted from an infinitely small point source in the specimen and transmitted to the image
plane through a high numerical aperture (NA) objective.
• The Modulation Transfer Function (MTF) is a measure of the ability of an optical system
to transfer various levels of detail from object to image. Performance is measured in terms
of contrast (degrees of gray), or of modulation, produced for a perfect source of that detail
level.
12.
12
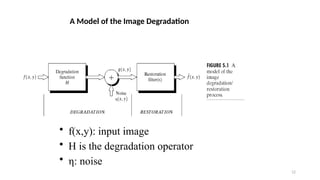
• f(x,y): inputimage
• H is the degradation operator
• η: noise
A Model of the Image Degradation
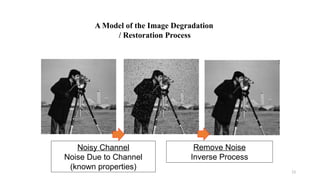
13.
13
Noisy Channel
Noise Dueto Channel
(known properties)
Remove Noise
Inverse Process
A Model of the Image Degradation
/ Restoration Process
14.
14
The majorproblem of noise in image comes up
during acquisition and/or transmission
Probability Density Function(PDF) tools are useful
for modeling a broad range of noise corruption situation
Spatial noise descriptor is the statistical behavior
of the intensity values in the noise component
Noise Models
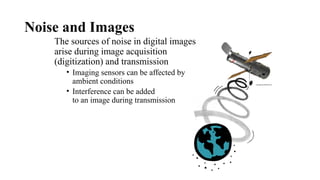
Noise and Images
Thesources of noise in digital images
arise during image acquisition
(digitization) and transmission
• Imaging sensors can be affected by
ambient conditions
• Interference can be added
to an image during transmission
17.
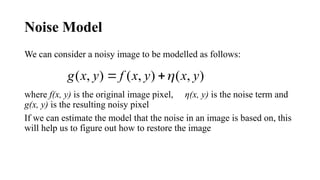
Noise Model
We canconsider a noisy image to be modelled as follows:
where f(x, y) is the original image pixel, η(x, y) is the noise term and
g(x, y) is the resulting noisy pixel
If we can estimate the model that the noise in an image is based on, this
will help us to figure out how to restore the image
)
,
(
)
,
(
)
,
( y
x
y
x
f
y
x
g
18.
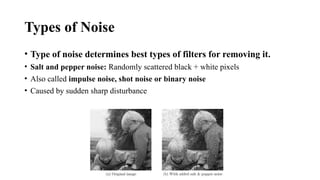
• Type ofnoise determines best types of filters for removing it.
• Salt and pepper noise: Randomly scattered black + white pixels
• Also called impulse noise, shot noise or binary noise
• Caused by sudden sharp disturbance
Types of Noise
19.
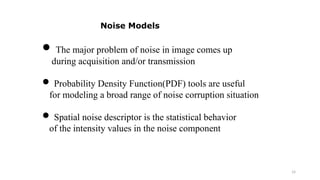
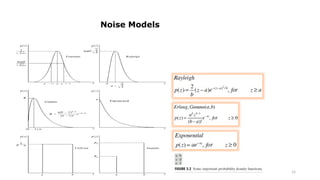
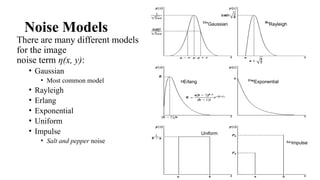
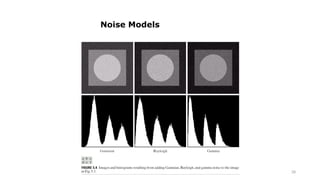
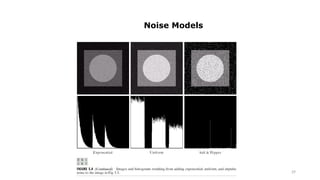
Noise Models GaussianRayleigh
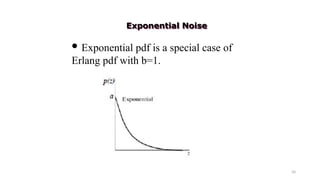
Erlang Exponential
Uniform
Impulse
There are many different models
for the image
noise term η(x, y):
• Gaussian
• Most common model
• Rayleigh
• Erlang
• Exponential
• Uniform
• Impulse
• Salt and pepper noise
20.
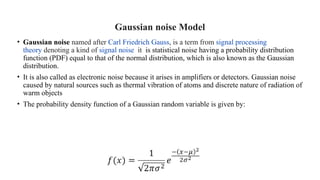
Gaussian noise Model
•Gaussian noise named after Carl Friedrich Gauss, is a term from signal processing
theory denoting a kind of signal noise it is statistical noise having a probability distribution
function (PDF) equal to that of the normal distribution, which is also known as the Gaussian
distribution.
• It is also called as electronic noise because it arises in amplifiers or detectors. Gaussian noise
caused by natural sources such as thermal vibration of atoms and discrete nature of radiation of
warm objects
• The probability density function of a Gaussian random variable is given by:
21.
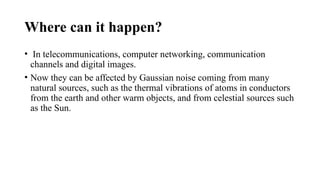
Where can ithappen?
• In telecommunications, computer networking, communication
channels and digital images.
• Now they can be affected by Gaussian noise coming from many
natural sources, such as the thermal vibrations of atoms in conductors
from the earth and other warm objects, and from celestial sources such
as the Sun.
22.
• Gaussian Noise:idealized form of white noise added to image,
normally distributed
I + Noise
• Speckle Noise: pixel values multiplied by random noise I (1 + Noise)
23.
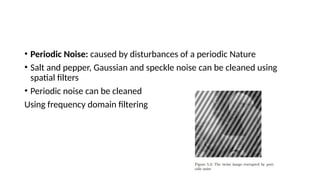
• Periodic Noise:caused by disturbances of a periodic Nature
• Salt and pepper, Gaussian and speckle noise can be cleaned using
spatial filters
• Periodic noise can be cleaned
Using frequency domain filtering
24.
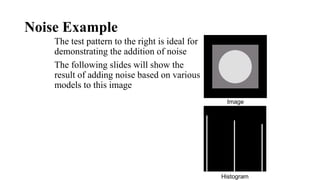
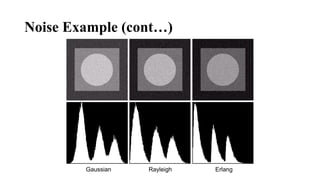
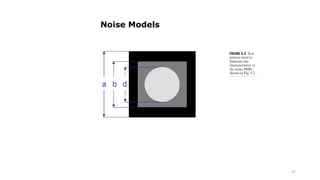
Noise Example
The testpattern to the right is ideal for
demonstrating the addition of noise
The following slides will show the
result of adding noise based on various
models to this image
Histogram to go here
Image
Histogram
35
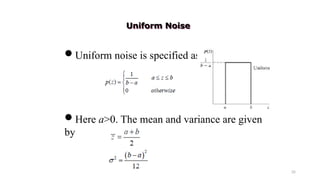
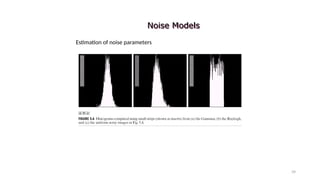
Uniform noise isspecified as
Here a>0. The mean and variance are given
by
Uniform Noise
36.
36
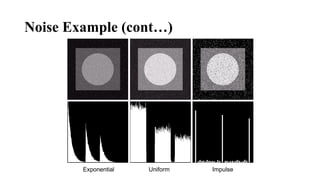
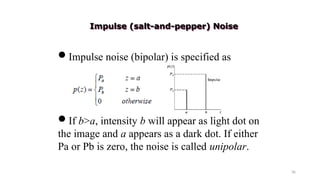
Impulse noise (bipolar)is specified as
If b>a, intensity b will appear as light dot on
the image and a appears as a dark dot. If either
Pa or Pb is zero, the noise is called unipolar.
Impulse (salt-and-pepper) Noise
37.
37
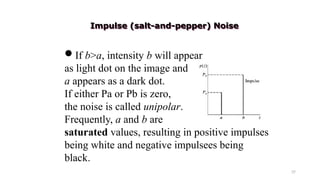
If b>a, intensityb will appear
as light dot on the image and
a appears as a dark dot.
If either Pa or Pb is zero,
the noise is called unipolar.
Frequently, a and b are
saturated values, resulting in positive impulses
being white and negative impulsees being
black.
Impulse (salt-and-pepper) Noise
38.
38
It ispossible to estimate the parameters of
the PDF from small patch of background
intensity, when only images are available
The shape of histogram identifies the closest
PDF match
Noise Models
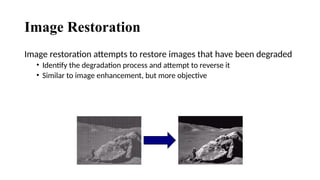
Image Restoration
Image restorationattempts to restore images that have been degraded
• Identify the degradation process and attempt to reverse it
• Similar to image enhancement, but more objective
41.
Image Restoration
• Removingnoise called Image Restoration
• Image restoration can be done in:
a. Spatial domain, or
b. Frequency domain
42.
42
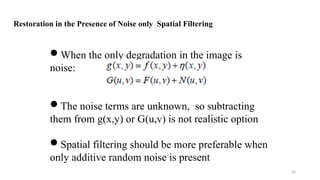
When the onlydegradation in the image is
noise:
The noise terms are unknown, so subtracting
them from g(x,y) or G(u,v) is not realistic option
Spatial filtering should be more preferable when
only additive random noise is present
Restoration in the Presence of Noise only Spatial Filtering
43.
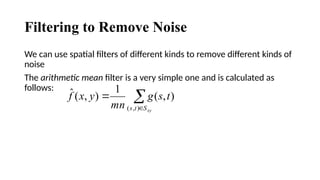
Filtering to RemoveNoise
We can use spatial filters of different kinds to remove different kinds of
noise
The arithmetic mean filter is a very simple one and is calculated as
follows:
xy
S
t
s
t
s
g
mn
y
x
f
)
,
(
)
,
(
1
)
,
(
ˆ
44.
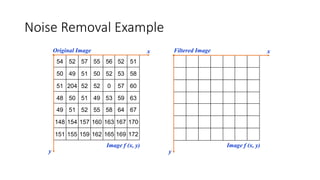
Noise Removal Example
5452 57 55 56 52 51
50 49 51 50 52 53 58
51 204 52 52 0 57 60
48 50 51 49 53 59 63
49 51 52 55 58 64 67
148 154 157 160 163 167 170
151 155 159 162 165 169 172
Original Image x
y
Image f (x, y)
Filtered Image x
y
Image f (x, y)
45.
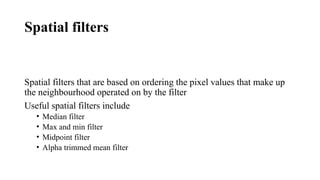
Spatial filters
Spatial filtersthat are based on ordering the pixel values that make up
the neighbourhood operated on by the filter
Useful spatial filters include
• Median filter
• Max and min filter
• Midpoint filter
• Alpha trimmed mean filter
46.
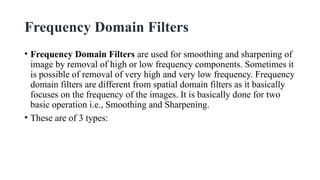
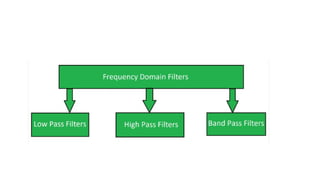
Frequency Domain Filters
•Frequency Domain Filters are used for smoothing and sharpening of
image by removal of high or low frequency components. Sometimes it
is possible of removal of very high and very low frequency. Frequency
domain filters are different from spatial domain filters as it basically
focuses on the frequency of the images. It is basically done for two
basic operation i.e., Smoothing and Sharpening.
• These are of 3 types:
48.
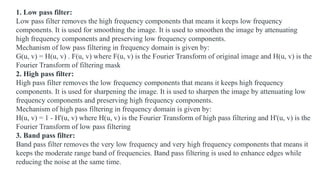
1. Low passfilter:
Low pass filter removes the high frequency components that means it keeps low frequency
components. It is used for smoothing the image. It is used to smoothen the image by attenuating
high frequency components and preserving low frequency components.
Mechanism of low pass filtering in frequency domain is given by:
G(u, v) = H(u, v) . F(u, v) where F(u, v) is the Fourier Transform of original image and H(u, v) is the
Fourier Transform of filtering mask
2. High pass filter:
High pass filter removes the low frequency components that means it keeps high frequency
components. It is used for sharpening the image. It is used to sharpen the image by attenuating low
frequency components and preserving high frequency components.
Mechanism of high pass filtering in frequency domain is given by:
H(u, v) = 1 - H'(u, v) where H(u, v) is the Fourier Transform of high pass filtering and H'(u, v) is the
Fourier Transform of low pass filtering
3. Band pass filter:
Band pass filter removes the very low frequency and very high frequency components that means it
keeps the moderate range band of frequencies. Band pass filtering is used to enhance edges while
reducing the noise at the same time.
50.
conclusion
• During imageacquisition and transmission, noise is seen in images.
• This is characterized by noise model. So study of noise model is very important part in image processing.
On the other hand, Image denoising is necessary action in image processing operation.
• Without the prior knowledge of noise model we cannot elaborate and perform denoising actions. Hence,
here we have reviewed and presented various noise models available in digital images.
• We addressed that noise models can be identified with the help of their origin.
• Noise models also designed by probability density function using mean, variance and mainly gray levels in
digital images.
#10 Charge Coupled Device (CCD)
A charge-coupled device (CCD) is a light-sensitive integrated circuit that captures images by converting photons to electrons. A CCD sensor breaks the image elements into pixels. Each pixel is converted into an electrical charge whose intensity is related to the intensity of light captured by that pixel.
CMOS (complementary metal-oxide semiconductor) is the semiconductor technology used in the transistors that are manufactured into most of today's computer microchips. Semiconductors are made of silicon and germanium, materials which "sort of" conduct electricity, but not enthusiastically.
The ideal point spread function (PSF) is the three-dimensional diffraction pattern of light emitted from an infinitely small point source in the specimen and transmitted to the image plane through a high numerical aperture (NA) objective.
The Modulation Transfer Function (MTF) is a measure of the ability of an optical system to transfer various levels of detail from object to image. Performance is measured in terms of contrast (degrees of gray), or of modulation, produced for a perfect source of that detail level.