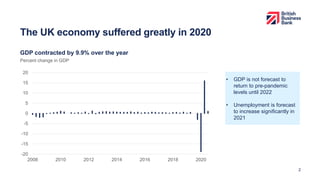
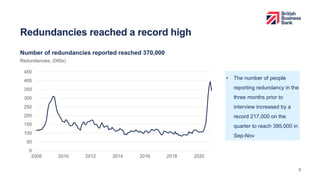
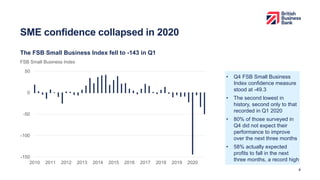
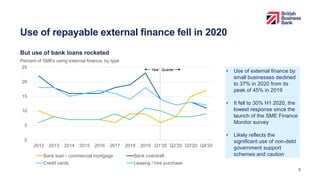
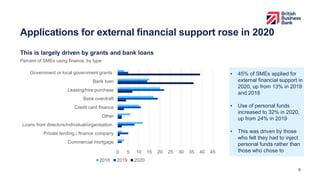
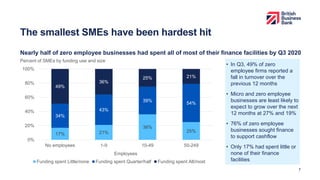
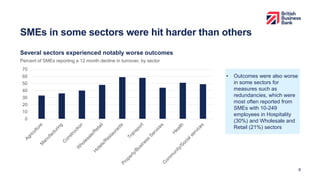
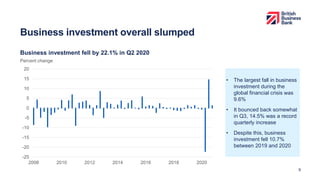
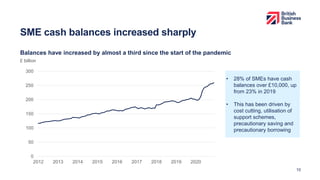
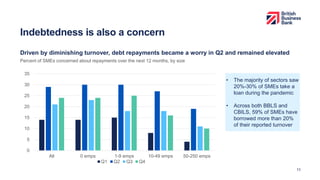
Small Business Finance
Markets report 20/21
Key findings
Alice Hu Wagner
10th March 2021
british-business-bank.co.uk
@BritishBBank
Official
Key findings
1
Please delete once read
IMAGE GUIDANCE
Click icon in the image box
icon to autofit within the
image box.
The UK economy suffered greatly in 2020
GDP contracted by 9.9% over the year
2
• GDP is not forecast to
return to pre-pandemic
levels until 2022
• Unemployment is forecast
to increase significantly in
2021
-20
-15
-10
-5
0
5
10
15
20
2008 2010 2012 2014 2016 2018 2020
Percent change in GDP
Redundancies reached a record high
Number of redundancies reported reached 370,000
3
• The number of people
reporting redundancy in the
three months prior to
interview increased by a
record 217,000 on the
quarter to reach 395,000 in
Sep-Nov
0
50
100
150
200
250
300
350
400
450
2008 2010 2012 2014 2016 2018 2020
Redundancies, (000s)
SME confidence collapsed in 2020
The FSB Small Business Index fell to -143 in Q1
4
-150
-100
-50
0
50
2010 2011 2012 2013 2014 2015 2016 2017 2018 2019 2020
• Q4 FSB Small Business
Index confidence measure
stood at -49.3
• The second lowest in
history, second only to that
recorded in Q1 2020
• 80% of those surveyed in
Q4 did not expect their
performance to improve
over the next three months
• 58% actually expected
profits to fall in the next
three months, a record high
FSB Small Business Index
Use of repayable external finance fell in 2020
5
• Use of external finance by
small businesses declined
to 37% in 2020 from its
peak of 45% in 2019
• It fell to 30% H1 2020, the
lowest response since the
launch of the SME Finance
Monitor survey
• Likely reflects the
significant use of non-debt
government support
schemes and caution
0
5
10
15
20
25
2012 2013 2014 2015 2016 2017 2018 2019 Q1'20 Q2'20 Q3'20 Q4'20
Bank loan / commercial mortgage Bank overdraft
Credit cards Leasing / hire purchase
But use of bank loans rocketed
Percent of SMEs using external finance, by type
Year Quarter
Applications for external financial support rose in 2020
6
• 45% of SMEs applied for
external financial support in
2020, up from 13% in 2019
and 2018
• Use of personal funds
increased to 32% in 2020,
up from 24% in 2019
• This was driven by those
who felt they had to inject
personal funds rather than
those who chose to
0 5 10 15 20 25 30 35 40 45
Commercial mortgage
Private lending / finance company
Loans from directors/individual/organisation
Other
Credit card finance
Bank overdraft
Leasing/hire purchase
Bank loan
Government or local government grants
2018 2019 2020
Percent of SMEs using finance, by type
This is largely driven by grants and bank loans
The smallest SMEs have been hardest hit
Nearly half of zero employee businesses had spent all of most of their finance facilities by Q3 2020
7
• In Q3, 49% of zero
employee firms reported a
fall in turnover over the
previous 12 months
• Micro and zero employee
businesses are least likely to
expect to grow over the next
12 months at 27% and 19%
• 76% of zero employee
businesses sought finance
to support cashflow
• Only 17% had spent little or
none of their finance
facilities
17% 21%
36%
25%
34%
43%
39%
54%
49%
36%
25% 21%
0%
20%
40%
60%
80%
100%
No employees 1-9 10-49 50-249
Employees
Funding spent Little/none Funding spent Quarter/half Funding spent All/most
Percent of SMEs by funding use and size
SMEs in some sectors were hit harder than others
Several sectors experienced notably worse outcomes
8
• Outcomes were also worse
in some sectors for
measures such as
redundancies, which were
most often reported from
SMEs with 10-249
employees in Hospitality
(30%) and Wholesale and
Retail (21%) sectors
Percent of SMEs reporting a 12 month decline in turnover, by sector
0
10
20
30
40
50
60
70
Business investment overall slumped
Business investment fell by 22.1% in Q2 2020
9
• The largest fall in business
investment during the
global financial crisis was
9.6%
• It bounced back somewhat
in Q3, 14.5% was a record
quarterly increase
• Despite this, business
investment fell 10.7%
between 2019 and 2020
-25
-20
-15
-10
-5
0
5
10
15
20
2008 2010 2012 2014 2016 2018 2020
Percent change
SME cash balances increased sharply
Balances have increased by almost a third since the start of the pandemic
10
• 28% of SMEs have cash
balances over £10,000, up
from 23% in 2019
• This has been driven by
cost cutting, utilisation of
support schemes,
precautionary saving and
precautionary borrowing
0
50
100
150
200
250
300
2012 2013 2014 2015 2016 2017 2018 2019 2020
£ billion
Indebtedness is also a concern
Driven by diminishing turnover, debt repayments became a worry in Q2 and remained elevated
11
• The majority of sectors saw
20%-30% of SMEs take a
loan during the pandemic
• Across both BBLS and
CBILS, 59% of SMEs have
borrowed more than 20%
of their reported turnover
0
5
10
15
20
25
30
35
All 0 emps 1-9 emps 10-49 emps 50-250 emps
Q1 Q2 Q3 Q4
Percent of SMEs concerned about repayments over the next 12 months, by size
Banks and alternative finance providers have
significant capacity to support further lending
12
• Banks have sufficient
capital to absorb around
£200bn of credit losses
• Non-bank lenders are
ready to return to the
market as demand for their
products returns
• Record fundraising in 2020
suggests VC funds have
sufficient capacity to invest
in high growth companies
in 2021 and beyond
0
2
4
6
8
10
12
14
16
18
2007 2008 2009 2010 2011 2012 2013 2014 2015 2016 2017 2018 2019 2020
Q3
CET1 capital ratio
Aggregate CET1 capital ratio of major UK banks have continued to increase
If confidence returns, we could see a boom in
investment and growth
13
14
Any questions?
british-business-bank.co.uk
@BritishBBank
Thank you

Presentation slides sbfm 2021 final

  • 1.
    Small Business Finance Marketsreport 20/21 Key findings Alice Hu Wagner 10th March 2021 british-business-bank.co.uk @BritishBBank Official
  • 2.
    Key findings 1 Please deleteonce read IMAGE GUIDANCE Click icon in the image box icon to autofit within the image box.
  • 3.
    The UK economysuffered greatly in 2020 GDP contracted by 9.9% over the year 2 • GDP is not forecast to return to pre-pandemic levels until 2022 • Unemployment is forecast to increase significantly in 2021 -20 -15 -10 -5 0 5 10 15 20 2008 2010 2012 2014 2016 2018 2020 Percent change in GDP
  • 4.
    Redundancies reached arecord high Number of redundancies reported reached 370,000 3 • The number of people reporting redundancy in the three months prior to interview increased by a record 217,000 on the quarter to reach 395,000 in Sep-Nov 0 50 100 150 200 250 300 350 400 450 2008 2010 2012 2014 2016 2018 2020 Redundancies, (000s)
  • 5.
    SME confidence collapsedin 2020 The FSB Small Business Index fell to -143 in Q1 4 -150 -100 -50 0 50 2010 2011 2012 2013 2014 2015 2016 2017 2018 2019 2020 • Q4 FSB Small Business Index confidence measure stood at -49.3 • The second lowest in history, second only to that recorded in Q1 2020 • 80% of those surveyed in Q4 did not expect their performance to improve over the next three months • 58% actually expected profits to fall in the next three months, a record high FSB Small Business Index
  • 6.
    Use of repayableexternal finance fell in 2020 5 • Use of external finance by small businesses declined to 37% in 2020 from its peak of 45% in 2019 • It fell to 30% H1 2020, the lowest response since the launch of the SME Finance Monitor survey • Likely reflects the significant use of non-debt government support schemes and caution 0 5 10 15 20 25 2012 2013 2014 2015 2016 2017 2018 2019 Q1'20 Q2'20 Q3'20 Q4'20 Bank loan / commercial mortgage Bank overdraft Credit cards Leasing / hire purchase But use of bank loans rocketed Percent of SMEs using external finance, by type Year Quarter
  • 7.
    Applications for externalfinancial support rose in 2020 6 • 45% of SMEs applied for external financial support in 2020, up from 13% in 2019 and 2018 • Use of personal funds increased to 32% in 2020, up from 24% in 2019 • This was driven by those who felt they had to inject personal funds rather than those who chose to 0 5 10 15 20 25 30 35 40 45 Commercial mortgage Private lending / finance company Loans from directors/individual/organisation Other Credit card finance Bank overdraft Leasing/hire purchase Bank loan Government or local government grants 2018 2019 2020 Percent of SMEs using finance, by type This is largely driven by grants and bank loans
  • 8.
    The smallest SMEshave been hardest hit Nearly half of zero employee businesses had spent all of most of their finance facilities by Q3 2020 7 • In Q3, 49% of zero employee firms reported a fall in turnover over the previous 12 months • Micro and zero employee businesses are least likely to expect to grow over the next 12 months at 27% and 19% • 76% of zero employee businesses sought finance to support cashflow • Only 17% had spent little or none of their finance facilities 17% 21% 36% 25% 34% 43% 39% 54% 49% 36% 25% 21% 0% 20% 40% 60% 80% 100% No employees 1-9 10-49 50-249 Employees Funding spent Little/none Funding spent Quarter/half Funding spent All/most Percent of SMEs by funding use and size
  • 9.
    SMEs in somesectors were hit harder than others Several sectors experienced notably worse outcomes 8 • Outcomes were also worse in some sectors for measures such as redundancies, which were most often reported from SMEs with 10-249 employees in Hospitality (30%) and Wholesale and Retail (21%) sectors Percent of SMEs reporting a 12 month decline in turnover, by sector 0 10 20 30 40 50 60 70
  • 10.
    Business investment overallslumped Business investment fell by 22.1% in Q2 2020 9 • The largest fall in business investment during the global financial crisis was 9.6% • It bounced back somewhat in Q3, 14.5% was a record quarterly increase • Despite this, business investment fell 10.7% between 2019 and 2020 -25 -20 -15 -10 -5 0 5 10 15 20 2008 2010 2012 2014 2016 2018 2020 Percent change
  • 11.
    SME cash balancesincreased sharply Balances have increased by almost a third since the start of the pandemic 10 • 28% of SMEs have cash balances over £10,000, up from 23% in 2019 • This has been driven by cost cutting, utilisation of support schemes, precautionary saving and precautionary borrowing 0 50 100 150 200 250 300 2012 2013 2014 2015 2016 2017 2018 2019 2020 £ billion
  • 12.
    Indebtedness is alsoa concern Driven by diminishing turnover, debt repayments became a worry in Q2 and remained elevated 11 • The majority of sectors saw 20%-30% of SMEs take a loan during the pandemic • Across both BBLS and CBILS, 59% of SMEs have borrowed more than 20% of their reported turnover 0 5 10 15 20 25 30 35 All 0 emps 1-9 emps 10-49 emps 50-250 emps Q1 Q2 Q3 Q4 Percent of SMEs concerned about repayments over the next 12 months, by size
  • 13.
    Banks and alternativefinance providers have significant capacity to support further lending 12 • Banks have sufficient capital to absorb around £200bn of credit losses • Non-bank lenders are ready to return to the market as demand for their products returns • Record fundraising in 2020 suggests VC funds have sufficient capacity to invest in high growth companies in 2021 and beyond 0 2 4 6 8 10 12 14 16 18 2007 2008 2009 2010 2011 2012 2013 2014 2015 2016 2017 2018 2019 2020 Q3 CET1 capital ratio Aggregate CET1 capital ratio of major UK banks have continued to increase
  • 14.
    If confidence returns,we could see a boom in investment and growth 13
  • 15.
  • 16.