Download to read offline

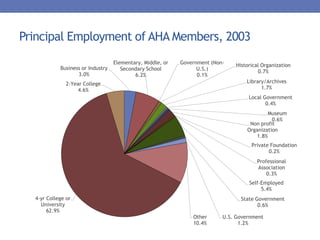
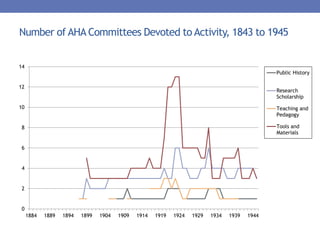

The document discusses the past and present of public history as presented at the American Historical Association meeting in New York City on January 3, 2015. It includes statistics on the employment distribution of AHA members across various sectors, trends in historical societies, and membership in history-related positions over time. Key speakers at the meeting were Marla Miller, Rob Townsend, Denise Meringolo, and Will Walker.


