Download to read offline

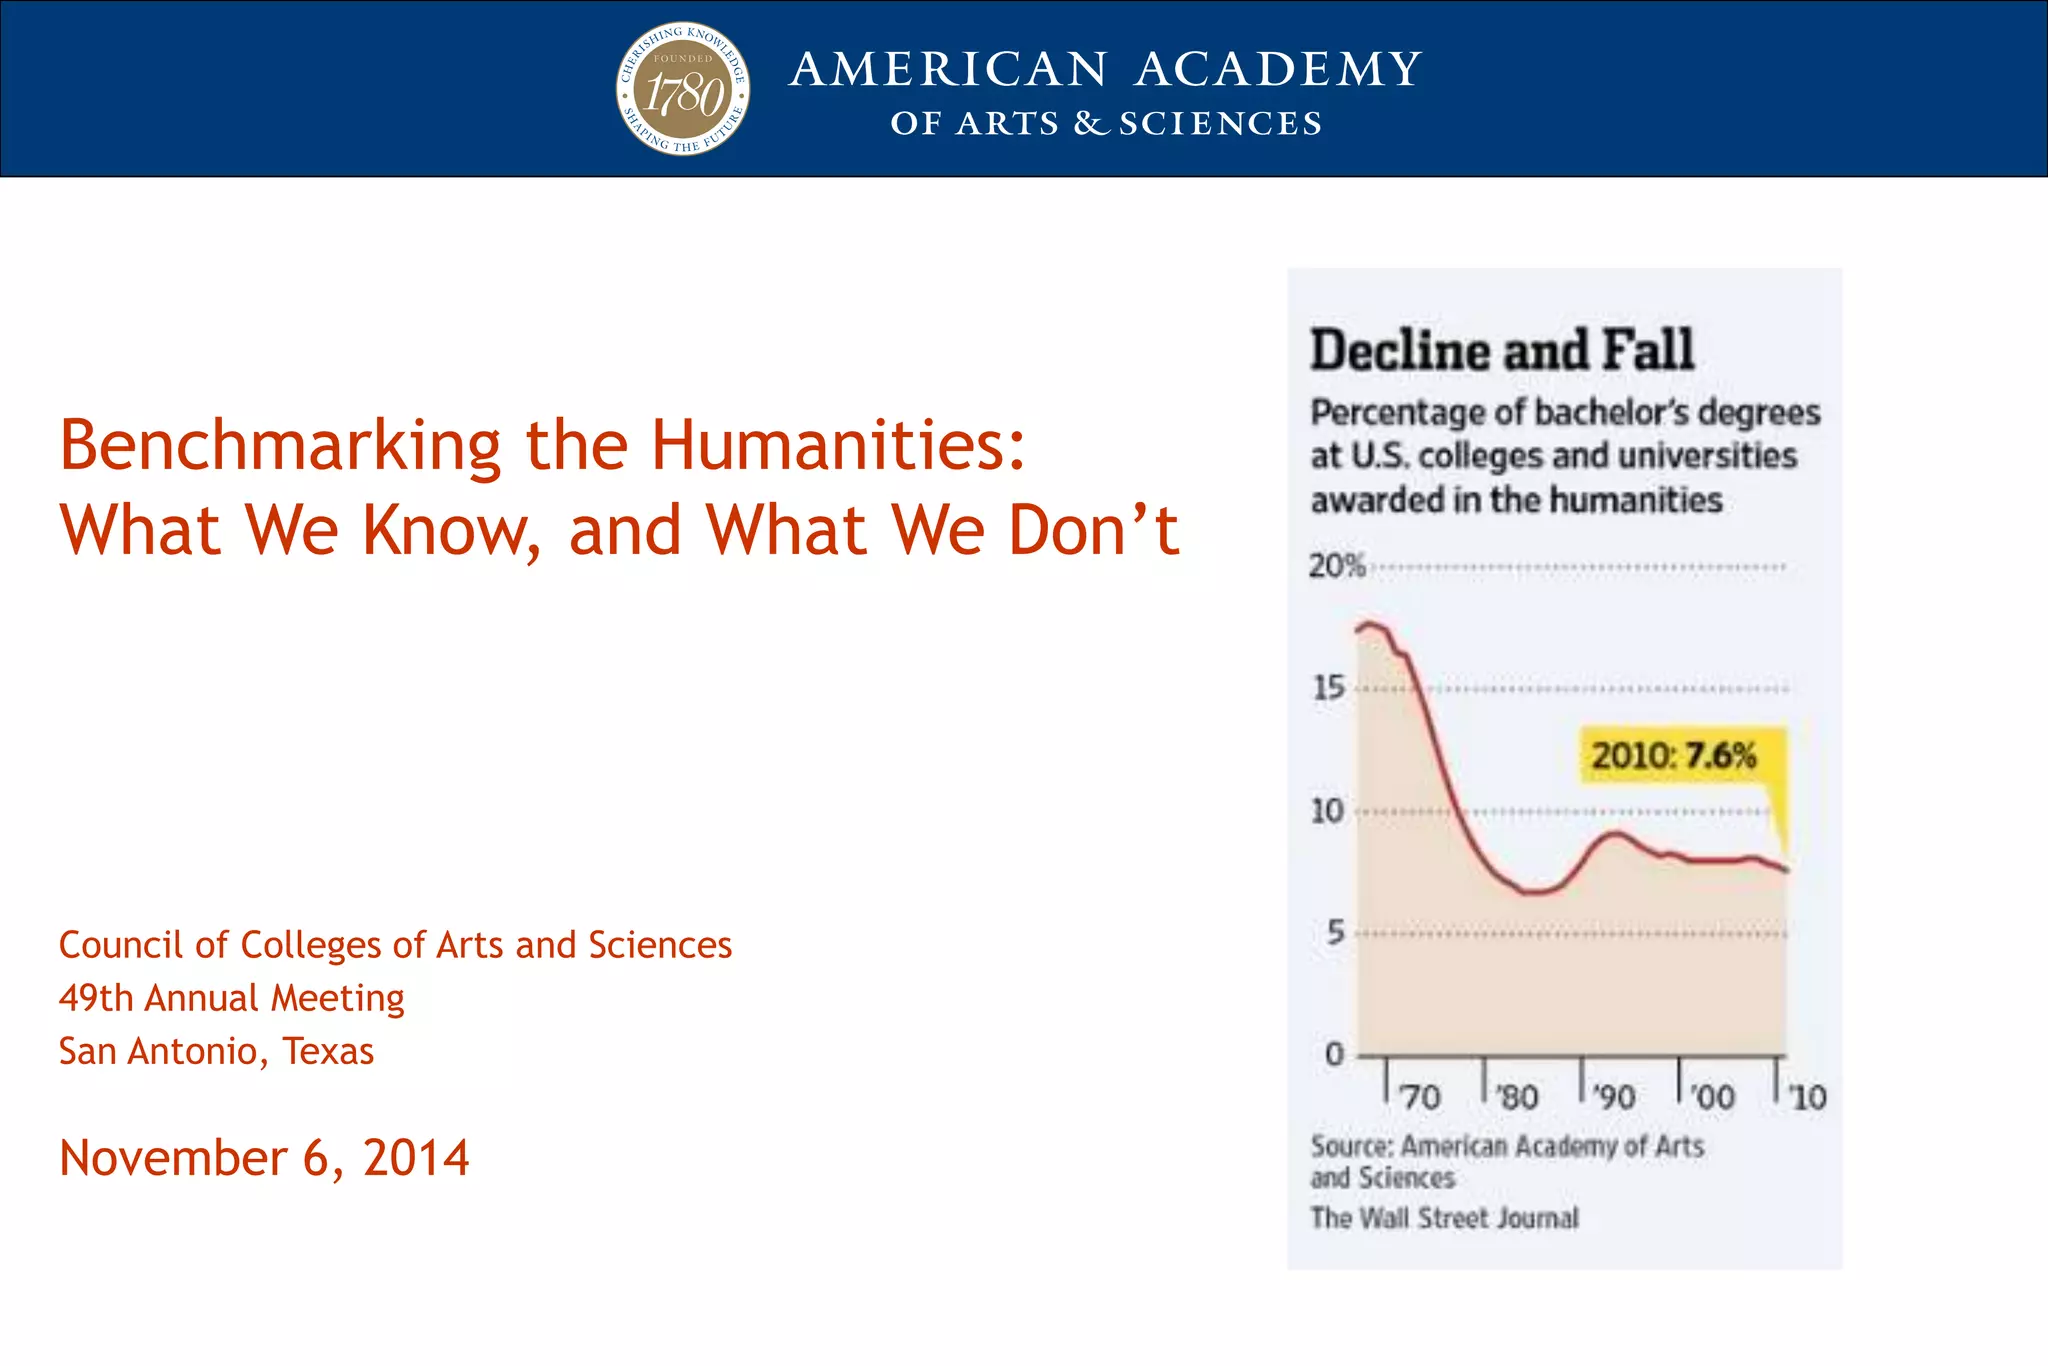
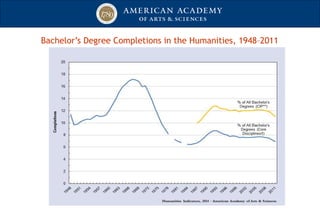
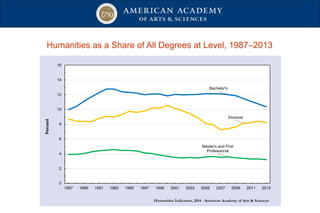
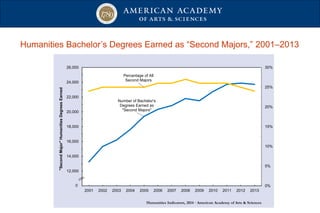
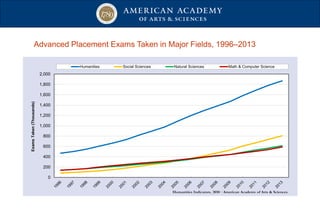
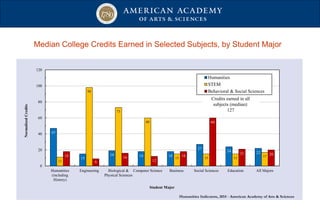
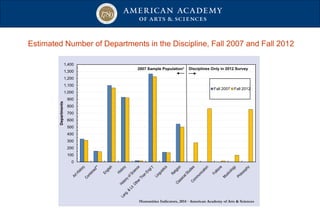
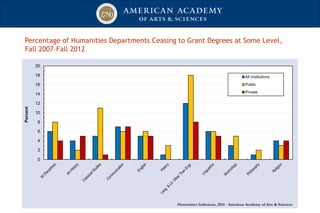
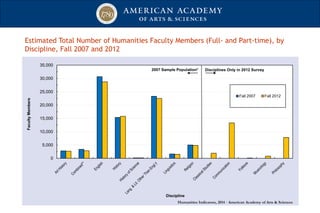
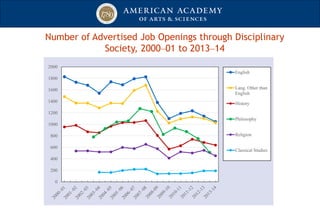
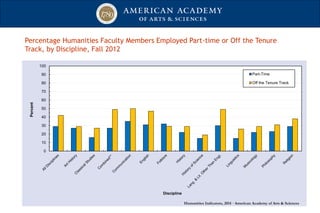
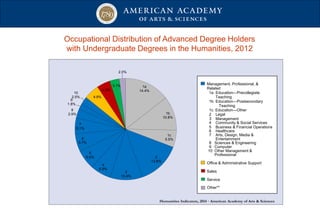
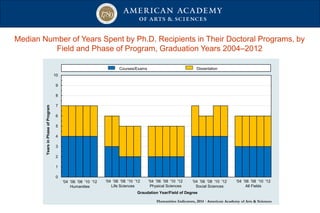

The document presents an overview of trends in humanities education, including bachelor's degree completions, departmental changes, and faculty employment between 1948 and 2014. It highlights the declining share of humanities degrees, the rise of second majors, and employment patterns for graduates in various occupations. Additionally, it covers digital humanities engagement and the earnings of degree holders across different fields.


