This document contains instructions for modifying percentage graphics in Excel charts. It explains how to double-click on graphics to change the percentage, select the Design and Edit Data options in Chart Tools to modify the number, and then adjust the location of the percentage text. The inner colored ring will automatically adjust to the new percentage. It also provides a tip for saving graphics as enhanced metafiles to use in other documents at any size.
Project Status KPI Dashboard Showing Completed Tasks And Task In ProgressSlideTeam
Present with our project status Kpi dashboard showing completed tasks and task in progress, if you are looking for an appealing business presentation to fetch the attention of your audience. Graphic of project performance and project status is displayed here with three performance indicators showing, completed tasks, tasks in progress and not stated tasks. You can prioritize your status for completion of your tasks through this kpi PPT deck and craft your outcome. This PowerPoint template is equipped with various tremendous characteristic features that can serve the best out of your presentation and improve the vision of your Company. It’s a contentious market today thus it becomes important to include the foremost services and schemes in your business and marketing strategies in order to stay at the summit. Just switch on the download button and get started. They will be the perfect fit for the biggest of concepts. Initiate action to improve infrastructure with our Project Status Kpi Dashboard Showing Completed Tasks And Task In Progress. Be an enabler for industry. https://bit.ly/3hF0JG5
HR Dashboard Employee Type Employee TenureSlideTeam
"You can download this product from SlideTeam.net"
Presenting this set of slides with name - Hr Dashboard Employee Type Employee Tenure. This is a six stage process. The stages in this process are Hr Dashboard, Human Resource Dashboard, Hr Kpi. https://bit.ly/3oVDnOJ
Project Status Kpi Dashboard Showing Delivery Roadmap And Resource AllocationSlideTeam
"You can download this product from SlideTeam.net"
Evaluate how effectively project is performing with our project status KPI dashboard showing delivery roadmap and resource allocation. This presentation slide of project status dashboard has been designed by our professional team members and will help you ensure that projects get completed on time. Our project show key performance indicator PPT slide can be used by project managers to display project related information and make their team to understand work process to lead the project towards long-term goals. This project roadmap planning layout allows you to focus on your vision, direction, and strategic initiative and to create a comprehensive and actionable project dashboard. Our project management KPI dashboard slideshow is data driven layout and help your measure the project metrics and provides actionable and visually understandable approach. Our project management dashboard PPT slide can be used to exhibit information like project lag time, resource utilization, cost overhead, maximum risk and cost performance index range. Build greater credibility with our Project Status Kpi Dashboard Showing Delivery Roadmap And Resource Allocation. Illustrate your expertise beyond all doubt. https://bit.ly/3Dflj7H
This presentation shows you a few different ideas on how to bring your presentations up a notch by presenting data in a more creative way. We'll show you exactly how to recreate each design. Don't forget to check out the helpful resources at the end of the deck.
This presentation was created 100% in PowerPoint. View more presentation and production ideas on our blog: https://www.macroproductions.net/blog/
KPI Dashboard Showing Employee Churn Key Metrics And Open PositionsSlideTeam
Presenting this set of slides with name - KPI Dashboard Showing Employee Churn Key Metrics And Open Positions. This is a four stage process. The stages in this process are Human Resource, HRM, Human Capital. https://bit.ly/3kJwii6
Financial Ratio KPI Dashboard Showing Revenue Net Profit Margin And Debt To E...SlideTeam
"You can download this product from SlideTeam.net"
Presenting this set of slides with name Financial Ratio Kpi Dashboard Showing Revenue Net Profit Margin And Debt To Equity. This is a five stage process. The stages in this process are Accounting Ratio, Financial Statement, Financial Ratio. https://bit.ly/3Cg1NZL
THE DATA GEEKHere’s the perfect infographic template.docxarnoldmeredith47041
THE DATA GEEK
Here’s the perfect infographic template for highlighting data! Double-click on the charts and graphs below to edit the style. Right click and choose “Edit Data” to update the values.
This pie chart is great for displaying percentages / parts of a whole.
Use the line graph below to compare values over time.
Like pie charts, these doughnut charts are great for showing parts of a whole.
Use the bar chart below to compare values.
Use this space to write a short conclusion for
your infographic and/or to provide a call-to-action.
Use this text box to give some more context about the data you’re displaying. How is it helping to drive home your main point(s)? Is there anything confusing that needs to be explained in more detail?
Use this text box to give some more context about the data you’re displaying. How is it helping to drive home your main point(s)? Is there anything confusing that needs to be explained in more detail?
Your logo here:
Chart1Example 1Example 2Example 3Example 4
Series 1
Label the x-axis here
Label the y-axis here
Here’s a column chart, great for comparing values.
4.3
2.5
3.5
4.5
Sheet1Series 1Example 14.3Example 22.5Example 33.5Example 44.5To update the chart, enter data into this table. The data is automatically saved in the chart.
Chart11st Qtr2nd Qtr3rd Qtr4th Qtr
Sales
8.2
3.2
1.4
1.2
Sheet1Sales1st Qtr8.22nd Qtr3.23rd Qtr1.44th Qtr1.2To update the chart, enter data into this table. The data is automatically saved in the chart.
Chart1Category 1Category 1Category 1Category 2Category 2Category 2Category 3Category 3Category 3Category 4Category 4Category 4
Series 1
Series 2
Series 3
Label the x-axis here
Label the y-axis here
4.3
2.4
2
2.5
4.4
2
3.5
1.8
3
4.5
2.8
5
Sheet1Series 1Series 2Series 3Category 14.32.42Category 22.54.42Category 33.51.83Category 44.52.85To update the chart, enter data into this table. The data is automatically saved in the chart.
Chart11st Qtr2nd Qtr
Sales
8.2
3.2
Sheet1Sales1st Qtr8.22nd Qtr3.2To update the chart, enter data into this table. The data is automatically saved in the chart.
Chart11st Qtr2nd Qtr
Sales
3.2
8.2
Sheet1Sales1st Qtr3.22nd Qtr8.2To update the chart, enter data into this table. The data is automatically saved in the chart.
Chart11st Qtr2nd Qtr
Sales
3.2
8.2
Sheet1Sales1st Qtr3.22nd Qtr8.2To update the chart, enter data into this table. The data is automatically saved in the chart.
Chart1Example 1Example 2Example 3Example 4
Series 1
Label the x-axis here
4.3
2.5
3.5
4.5
Sheet1Series 1Example 14.3Example 22.5Example 33.5Example 44.5To update the chart, enter data into this table. The data is automatically saved in the chart.
Use this space to write a short conclusion for
your infographic and/or to provide a call-to-action.
CONVEYING STATISTICS
There are times when we have a staggering amount of information that we can’t present with an image-heavy infographic. These times call for styles of design
that focus more on the fonts and how they can give yo.
Financial Performance KPI Dashboard Showing Payroll Headcount Ratio Cost Per ...SlideTeam
“You can download this product from SlideTeam.net”
Presenting this set of slides with name - Financial Performance KPI Dashboard Showing Payroll Headcount Ratio Cost Per Lead. This is a seven stage process. The stages in this process are Financial Performance, Financial Report, Financial Review. https://bit.ly/3ximKAE
Presenting this set of slides with name - Risk Management Kpi Dashboard Showing Overall Security Risk And Regulatory Compliance. This is a four stage process. The stages in this process are Risk Management, Risk Assessment, Project Risk. https://bit.ly/3tjCAZL
“You can download this product from SlideTeam.net”
Presenting this set of slides with name - Hr Dashboard Recruitment Performance Key Metrics. This is a four stage process. The stages in this process are Hr Dashboard, Human Resource Dashboard, Hr Kpi. https://bit.ly/2Y1GpqM
Project Status KPI Dashboard Showing Project Timeline And BudgetSlideTeam
“You can download this product from SlideTeam.net”
Presenting this set of slides with name - Project Status KPI Dashboard Showing Project Timeline And Budget. This is a five stage process. The stages in this process are Project Health Card, Project Performance, Project Status. https://bit.ly/3nHy7Pl
"You can download this product from SlideTeam.net"
Choose our project activities resource portfolio dashboards PowerPoint template and attract the attention of your team. This is a modernly designed PPT slide using excel linked charts. Charts are used for creating visual explanation of data and presenting business information in a simple and easy to understand way. When preparing business reports or business presentations the first step is deciding on the format of the charts you are going to use. Our project activities resource portfolio dashboards PowerPoint slideshow is commonly used to represent data that shows changes over time, which helps people visualize trends. Our data driven project activities resource portfolio Presentation visual slide is easy to understand and fully modifiable. The graphics are also beneficial for analyzing your business data and drawing out conclusions for future. So, make sure you use our overwhelming project activities resource portfolio dashboards PPT design and track your business performance in future. Check in to our Project Activities Resource Portfolio Dashboards world. Luxuriate in the facilities offered. https://bit.ly/3KMYNai
Call Center KPI Dashboard Showing Total Calls Average Answer Speed Abandon RateSlideTeam
"You can download this product from SlideTeam.net"
Presenting this set of slides with name - Call Center Kpi Dashboard Showing Total Calls Average Answer Speed Abandon Rate. This is a five stage process. The stages in this process are Call Center Agent, Customer Care, Client Support. https://bit.ly/3oaNrUs
Financial Ratio KPI Dashboard Showing Liquidity Ratio And Profitability RatioSlideTeam
“You can download this product from SlideTeam.net”
Presenting this set of slides with name - Financial Ratio Kpi Dashboard Showing Liquidity Ratio And Profitability Ratio. This is a three stage process. The stages in this process are Accounting Ratio, Financial Statement, Financial Ratio. https://bit.ly/3ET7IEl
"You can download this product from SlideTeam.net"
Presenting this set of slides with name - Performance Indicators Percentage Circle. This is a eleven stage process. The stages in this process are Percentage Circle, Percentage Round, Pie Chart. https://bit.ly/3HyPvgg
Presenting this set of slides with name - Financial Performance Kpi Dashboard Showing Gross Profit Margin Sales Growth Operating Cash Flow. This is a three stage process. The stages in this process are Financial Performance, Financial Report, Financial Review. https://bit.ly/38BiMaC
Open Position And New Roles Recruitment DashboardSlideTeam
Presenting this set of slides with name - Open Position And New Roles Recruitment Dashboard. This is a three stage process. The stages in this process are Staffing Plan, Recruitment, Staff Management. https://bit.ly/3Ac8ZUl
Project Status KPI Dashboard Showing Task SummarySlideTeam
"You can download this product from SlideTeam.net"
When your business leaders and client want you to give a project status update then you should be sure that your information is truly up-to-date! For this, you can make use of our professionally crafted Project Status KPI Dashboard PowerPoint template. Dashboards show a real-time, in-depth look at your projects, without the need to go through number of spreadsheets or reports. This is a four columns process that present the information related to the project such as task status, task summary by project, overdue task by project owner and number of tasks and total hours allocated by project start date line. This interactive dashboard presentation template can track timelines, budget, and tasks so you can focus on meeting your objectives. You can even create tailored project management dashboards for each team member, so that you can keep an eye on the status of your project. Being aware of the project status is important for your business growth as you provide a deadline to your client and you have to ensure you should meet it. Our presentation template helps you to achieve your business goals and share the information with the clients and team members whenever asked. Display information about equipment to carry with our Project Status Kpi Dashboard Showing Task Summary. Be able to cater for the journey. https://bit.ly/3hgLiCU
Hr Dashboard Number Of Employees Employee StructureSlideTeam
Presenting this set of slides with name - Hr Dashboard Number Of Employees Employee Structure. This is a four stage process. The stages in this process are Hr Dashboard, Human Resource Dashboard, Hr Kpi. https://bit.ly/3vHqCsA
Progress Bar Graph Layout Powerpoint GuideSlideTeam
"You can download this product from SlideTeam.net"
Get this Progress Bar Graph Layout PowerPoint template for visual display of the results of your progress with precision. Present comparisons between various categories of data over a set period. With this progress doughnut chart PowerPoint diagram, it’s easy to communicate information through data visualization. Doughnut charts support multiple statistics at once and make it readable at a glance. The complex algorithms or data become easy to interpret in the form of visuals than their numerical counterparts. This progress bar chart Excel PPT template can be widely put to use in representing progress in various sectors including business, analytics, statistics, mass media, etc. You can compare and analyze the data using this progress PPT graph. Project your growth and let your investors know where do you stand with the help of this status bar in Excel PPT template. Simplify the complex data in a presentable and visually pleasing way using this progress bar graph. Make your progress report more effective with this data visualization tool. Our designers at SlideTeam provide you with a high-quality doughnut and bar chart. Get it here to generate an effective presentation. https://bit.ly/3ncJazn
Manufacturing KPI Dashboard Showing Production Rate And Lost UnitsSlideTeam
"You can download this product from SlideTeam.net"
Track the productivity levels of a manufacturing process with our manufacturing KPI dashboard showing production rate and lost units. This presentation slide of manufacturing KPI dashboard has been designed by our team of professional team members and provides manufacturers valuable business insights to meet their organizational goals. Our manufacturing control panel PPT slide helpful you to define metrics to measure analyze and optimize production processes regarding their quantity, quality and various cost aspects. This excel linked presentation slide of production metrics can be used to visualize on graphs and charts to provide real-time monitoring for senior executives and give a warning message when volumes exceeds set thresholds. With the help of this production KPI template which shows production rate and lost units allows you to evaluate the quantities that your business can produce over time such as month, a semester or a year and help you compare those results to previous periods to stop anomalies, or to show the progress. Guard against bad habits with our Manufacturing Kpi Dashboard Showing Production Rate And Lost Units. Ensure you don't become complacent. https://bit.ly/3CRAfu0
"You can download this product from SlideTeam.net"
Presenting headcount comparison layout. This is a headcount comparison layout. This is a two stage process. The stages in this process are headcount, male female comparison, male female ratio. https://bit.ly/3HumhQG
Implicitly or explicitly all competing businesses employ a strategy to select a mix
of marketing resources. Formulating such competitive strategies fundamentally
involves recognizing relationships between elements of the marketing mix (e.g.,
price and product quality), as well as assessing competitive and market conditions
(i.e., industry structure in the language of economics).
What are the main advantages of using HR recruiter services.pdfHumanResourceDimensi1
HR recruiter services offer top talents to companies according to their specific needs. They handle all recruitment tasks from job posting to onboarding and help companies concentrate on their business growth. With their expertise and years of experience, they streamline the hiring process and save time and resources for the company.
Attending a job Interview for B1 and B2 Englsih learnersErika906060
It is a sample of an interview for a business english class for pre-intermediate and intermediate english students with emphasis on the speking ability.
RMD24 | Retail media: hoe zet je dit in als je geen AH of Unilever bent? Heid...BBPMedia1
Grote partijen zijn al een tijdje onderweg met retail media. Ondertussen worden in dit domein ook de kansen zichtbaar voor andere spelers in de markt. Maar met die kansen ontstaan ook vragen: Zelf retail media worden of erop adverteren? In welke fase van de funnel past het en hoe integreer je het in een mediaplan? Wat is nu precies het verschil met marketplaces en Programmatic ads? In dit half uur beslechten we de dilemma's en krijg je antwoorden op wanneer het voor jou tijd is om de volgende stap te zetten.
Kseniya Leshchenko: Shared development support service model as the way to ma...Lviv Startup Club
Kseniya Leshchenko: Shared development support service model as the way to make small projects with small budgets profitable for the company (UA)
Kyiv PMDay 2024 Summer
Website – www.pmday.org
Youtube – https://www.youtube.com/startuplviv
FB – https://www.facebook.com/pmdayconference
Premium MEAN Stack Development Solutions for Modern BusinessesSynapseIndia
Stay ahead of the curve with our premium MEAN Stack Development Solutions. Our expert developers utilize MongoDB, Express.js, AngularJS, and Node.js to create modern and responsive web applications. Trust us for cutting-edge solutions that drive your business growth and success.
Know more: https://www.synapseindia.com/technology/mean-stack-development-company.html
The world of search engine optimization (SEO) is buzzing with discussions after Google confirmed that around 2,500 leaked internal documents related to its Search feature are indeed authentic. The revelation has sparked significant concerns within the SEO community. The leaked documents were initially reported by SEO experts Rand Fishkin and Mike King, igniting widespread analysis and discourse. For More Info:- https://news.arihantwebtech.com/search-disrupted-googles-leaked-documents-rock-the-seo-world/
LA HUG - Video Testimonials with Chynna Morgan - June 2024Lital Barkan
Have you ever heard that user-generated content or video testimonials can take your brand to the next level? We will explore how you can effectively use video testimonials to leverage and boost your sales, content strategy, and increase your CRM data.🤯
We will dig deeper into:
1. How to capture video testimonials that convert from your audience 🎥
2. How to leverage your testimonials to boost your sales 💲
3. How you can capture more CRM data to understand your audience better through video testimonials. 📊
Discover the innovative and creative projects that highlight my journey throu...dylandmeas
Discover the innovative and creative projects that highlight my journey through Full Sail University. Below, you’ll find a collection of my work showcasing my skills and expertise in digital marketing, event planning, and media production.
VAT Registration Outlined In UAE: Benefits and Requirementsuae taxgpt
Vat Registration is a legal obligation for businesses meeting the threshold requirement, helping companies avoid fines and ramifications. Contact now!
https://viralsocialtrends.com/vat-registration-outlined-in-uae/
Falcon stands out as a top-tier P2P Invoice Discounting platform in India, bridging esteemed blue-chip companies and eager investors. Our goal is to transform the investment landscape in India by establishing a comprehensive destination for borrowers and investors with diverse profiles and needs, all while minimizing risk. What sets Falcon apart is the elimination of intermediaries such as commercial banks and depository institutions, allowing investors to enjoy higher yields.
Memorandum Of Association Constitution of Company.pptseri bangash
www.seribangash.com
A Memorandum of Association (MOA) is a legal document that outlines the fundamental principles and objectives upon which a company operates. It serves as the company's charter or constitution and defines the scope of its activities. Here's a detailed note on the MOA:
Contents of Memorandum of Association:
Name Clause: This clause states the name of the company, which should end with words like "Limited" or "Ltd." for a public limited company and "Private Limited" or "Pvt. Ltd." for a private limited company.
https://seribangash.com/article-of-association-is-legal-doc-of-company/
Registered Office Clause: It specifies the location where the company's registered office is situated. This office is where all official communications and notices are sent.
Objective Clause: This clause delineates the main objectives for which the company is formed. It's important to define these objectives clearly, as the company cannot undertake activities beyond those mentioned in this clause.
www.seribangash.com
Liability Clause: It outlines the extent of liability of the company's members. In the case of companies limited by shares, the liability of members is limited to the amount unpaid on their shares. For companies limited by guarantee, members' liability is limited to the amount they undertake to contribute if the company is wound up.
https://seribangash.com/promotors-is-person-conceived-formation-company/
Capital Clause: This clause specifies the authorized capital of the company, i.e., the maximum amount of share capital the company is authorized to issue. It also mentions the division of this capital into shares and their respective nominal value.
Association Clause: It simply states that the subscribers wish to form a company and agree to become members of it, in accordance with the terms of the MOA.
Importance of Memorandum of Association:
Legal Requirement: The MOA is a legal requirement for the formation of a company. It must be filed with the Registrar of Companies during the incorporation process.
Constitutional Document: It serves as the company's constitutional document, defining its scope, powers, and limitations.
Protection of Members: It protects the interests of the company's members by clearly defining the objectives and limiting their liability.
External Communication: It provides clarity to external parties, such as investors, creditors, and regulatory authorities, regarding the company's objectives and powers.
https://seribangash.com/difference-public-and-private-company-law/
Binding Authority: The company and its members are bound by the provisions of the MOA. Any action taken beyond its scope may be considered ultra vires (beyond the powers) of the company and therefore void.
Amendment of MOA:
While the MOA lays down the company's fundamental principles, it is not entirely immutable. It can be amended, but only under specific circumstances and in compliance with legal procedures. Amendments typically require shareholder
[Note: This is a partial preview. To download this presentation, visit:
https://www.oeconsulting.com.sg/training-presentations]
Sustainability has become an increasingly critical topic as the world recognizes the need to protect our planet and its resources for future generations. Sustainability means meeting our current needs without compromising the ability of future generations to meet theirs. It involves long-term planning and consideration of the consequences of our actions. The goal is to create strategies that ensure the long-term viability of People, Planet, and Profit.
Leading companies such as Nike, Toyota, and Siemens are prioritizing sustainable innovation in their business models, setting an example for others to follow. In this Sustainability training presentation, you will learn key concepts, principles, and practices of sustainability applicable across industries. This training aims to create awareness and educate employees, senior executives, consultants, and other key stakeholders, including investors, policymakers, and supply chain partners, on the importance and implementation of sustainability.
LEARNING OBJECTIVES
1. Develop a comprehensive understanding of the fundamental principles and concepts that form the foundation of sustainability within corporate environments.
2. Explore the sustainability implementation model, focusing on effective measures and reporting strategies to track and communicate sustainability efforts.
3. Identify and define best practices and critical success factors essential for achieving sustainability goals within organizations.
CONTENTS
1. Introduction and Key Concepts of Sustainability
2. Principles and Practices of Sustainability
3. Measures and Reporting in Sustainability
4. Sustainability Implementation & Best Practices
To download the complete presentation, visit: https://www.oeconsulting.com.sg/training-presentations
Cracking the Workplace Discipline Code Main.pptxWorkforce Group
Cultivating and maintaining discipline within teams is a critical differentiator for successful organisations.
Forward-thinking leaders and business managers understand the impact that discipline has on organisational success. A disciplined workforce operates with clarity, focus, and a shared understanding of expectations, ultimately driving better results, optimising productivity, and facilitating seamless collaboration.
Although discipline is not a one-size-fits-all approach, it can help create a work environment that encourages personal growth and accountability rather than solely relying on punitive measures.
In this deck, you will learn the significance of workplace discipline for organisational success. You’ll also learn
• Four (4) workplace discipline methods you should consider
• The best and most practical approach to implementing workplace discipline.
• Three (3) key tips to maintain a disciplined workplace.
2. 75% 25% 50% 87%
75% 25% 50% 87%
75% 25% 16%
This is a chart with graphics
To change the %, double-click on the graphic.
Select Design within Chart Tools on the ribbon
then select Edit Data. In the Excel table, change
the number in B2 to your %. Click outside of B2
and close the dialog.
You will need to re-adjust the location of %
number in the center.
The inner colored ring will automatically adjust
in size to reflect the new %.
Percent chart elements
Dots
Excel chart
Outer oval
COOL TRICK
Need to use the graphic in another document.
Right-click on the graphic you want.
Choose Save As Picture and select Enhanced
Windows Metafile (.emf).
Now you have a graphic that you can use for
print and you can scale to any size
75% 25% 50% 87%
2
4. 50%
25%
70%
38%
6.5 out of 10 males…
2.3
females…
Works with
any vector
shape
Graphic percentages
Works with any native or Bezier graphic
COOL TRICK
1
2
1
2
4
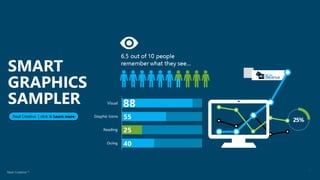
9. SMART
GRAPHICS
SAMPLER
Neal Creative | click & Learn more
6.5 out of 10 people
remember what they see…
40
25
55
88
Doing
Reading
Graphic Icons
Visual
25%
Editor's Notes
TIP │Use color to tell story, arrange multiple graphics together, add icons on top of charts to create custom graphics.
EDITABLE GRAPHIC AT END OF PRESENTATION
This slide contains the editable pieces that were used to build infographic sample
Icons – Eye, PC