Progress Bar Graph Layout Powerpoint Guide

"You can download this product from SlideTeam.net" Get this Progress Bar Graph Layout PowerPoint template for visual display of the results of your progress with precision. Present comparisons between various categories of data over a set period. With this progress doughnut chart PowerPoint diagram, it’s easy to communicate information through data visualization. Doughnut charts support multiple statistics at once and make it readable at a glance. The complex algorithms or data become easy to interpret in the form of visuals than their numerical counterparts. This progress bar chart Excel PPT template can be widely put to use in representing progress in various sectors including business, analytics, statistics, mass media, etc. You can compare and analyze the data using this progress PPT graph. Project your growth and let your investors know where do you stand with the help of this status bar in Excel PPT template. Simplify the complex data in a presentable and visually pleasing way using this progress bar graph. Make your progress report more effective with this data visualization tool. Our designers at SlideTeam provide you with a high-quality doughnut and bar chart. Get it here to generate an effective presentation. https://bit.ly/3ncJazn

Recommended
Recommended
More Related Content
Similar to Progress Bar Graph Layout Powerpoint Guide
Similar to Progress Bar Graph Layout Powerpoint Guide (20)
More from SlideTeam
More from SlideTeam (20)
Recently uploaded
Recently uploaded (20)
Progress Bar Graph Layout Powerpoint Guide
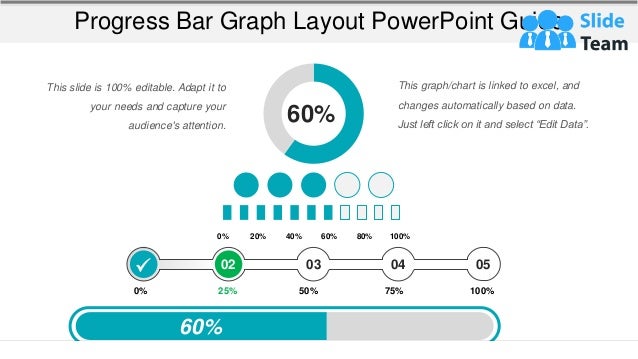
- 1. Progress Bar Graph Layout PowerPoint Guide 0% 25% 50% 75% 100% 60% 03 04 05 02 0% 20% 40% 60% 80% 100% 60% This graph/chart is linked to excel, and changes automatically based on data. Just left click on it and select “Edit Data”. This slide is 100% editable. Adapt it to your needs and capture your audience's attention.
- 2. All images are 100% editable in PowerPoint Change color, size and orientation of any icon to your liking”
- 3. 1. Select the Graph and right click -> Select "Edit Data" 2. An excel matrix will automatically show up 3. Enter the values based on your requirements and hit enter 4. The Graph/Chart shape will automatically adjust according to your data, and anytime you can go and change the value again Edit Excel-linked Chart This is a Data Driven Chart/Graph and the shape automatically adjusts according to your data 1 2 3
- 4. Edit Color 1. Select the shape to change the color and Right click the object( click any object which you want to change color) 2. Choose Format Data Series in the dialog box. 3. Choose “Fill” in the Format Shape box then “Solid” or “Gradient” depending on the appearance of the object. Change colour as shown in the picture. 1 2 3
- 5. Select From Thousands Of Editable Icons On Every Topic These icons are available at the Icons section on www.slideteam.net