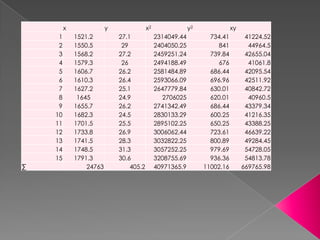
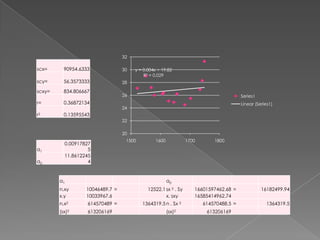
This document contains a table of 15 data points measuring x, y, x^2, y^2, and xy values. It then performs linear regression analysis to find the line of best fit between x and y. The linear regression equation is y = 0.004x + 19.82 with an R^2 value of 0.029, indicating a weak correlation between x and y.