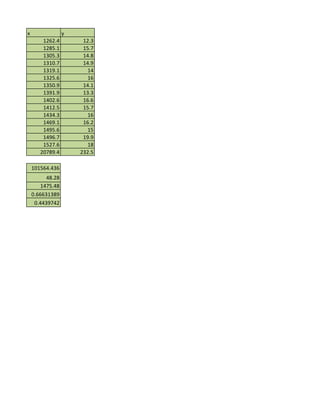
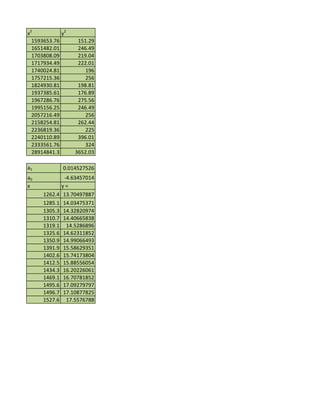
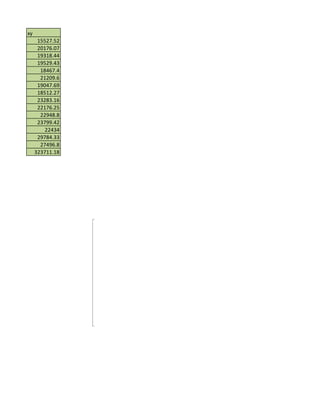
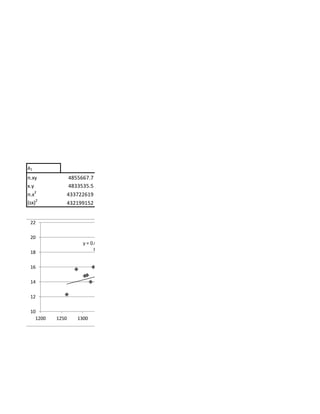
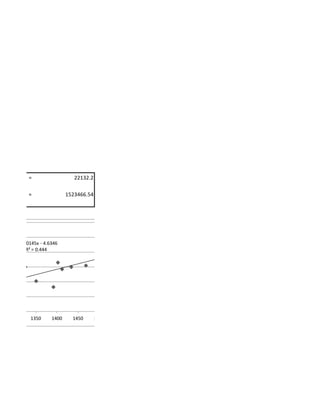
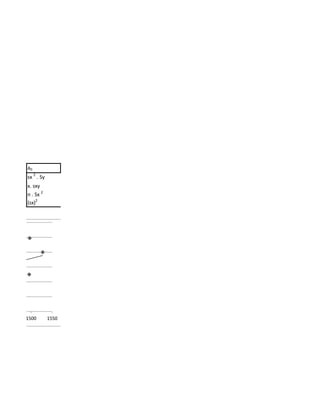
The document contains data on x and y values for 16 data points. It calculates the sum, mean, standard deviation, correlation coefficient, and line of best fit equation for the data. The line of best fit is determined to be y = 0.0145x - 4.6346 with an R2 value of 0.444, indicating a moderate positive correlation between x and y.