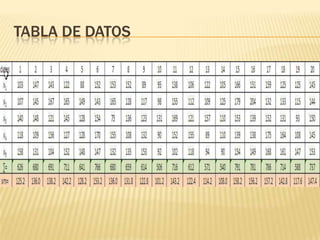
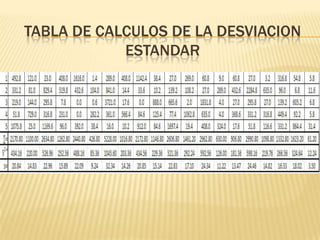
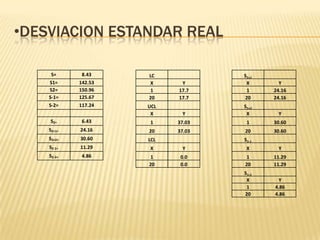
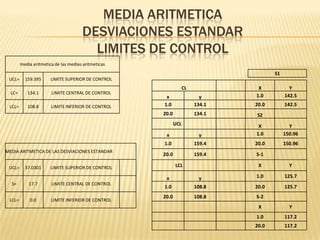
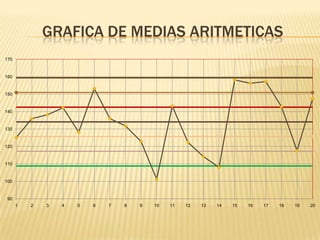
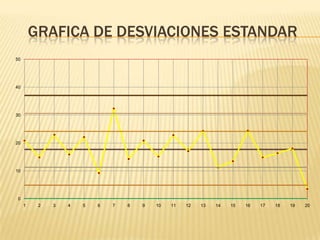
This document contains calculations and charts related to statistical process control. It includes tables of data and calculations of the mean and standard deviation. Line graphs show the mean and standard deviation over time, along with control limits calculated as the mean ±1, 2, or 3 standard deviations. The purpose is to monitor a process and identify any points outside the control limits that may indicate the process is becoming unstable or unpredictable.