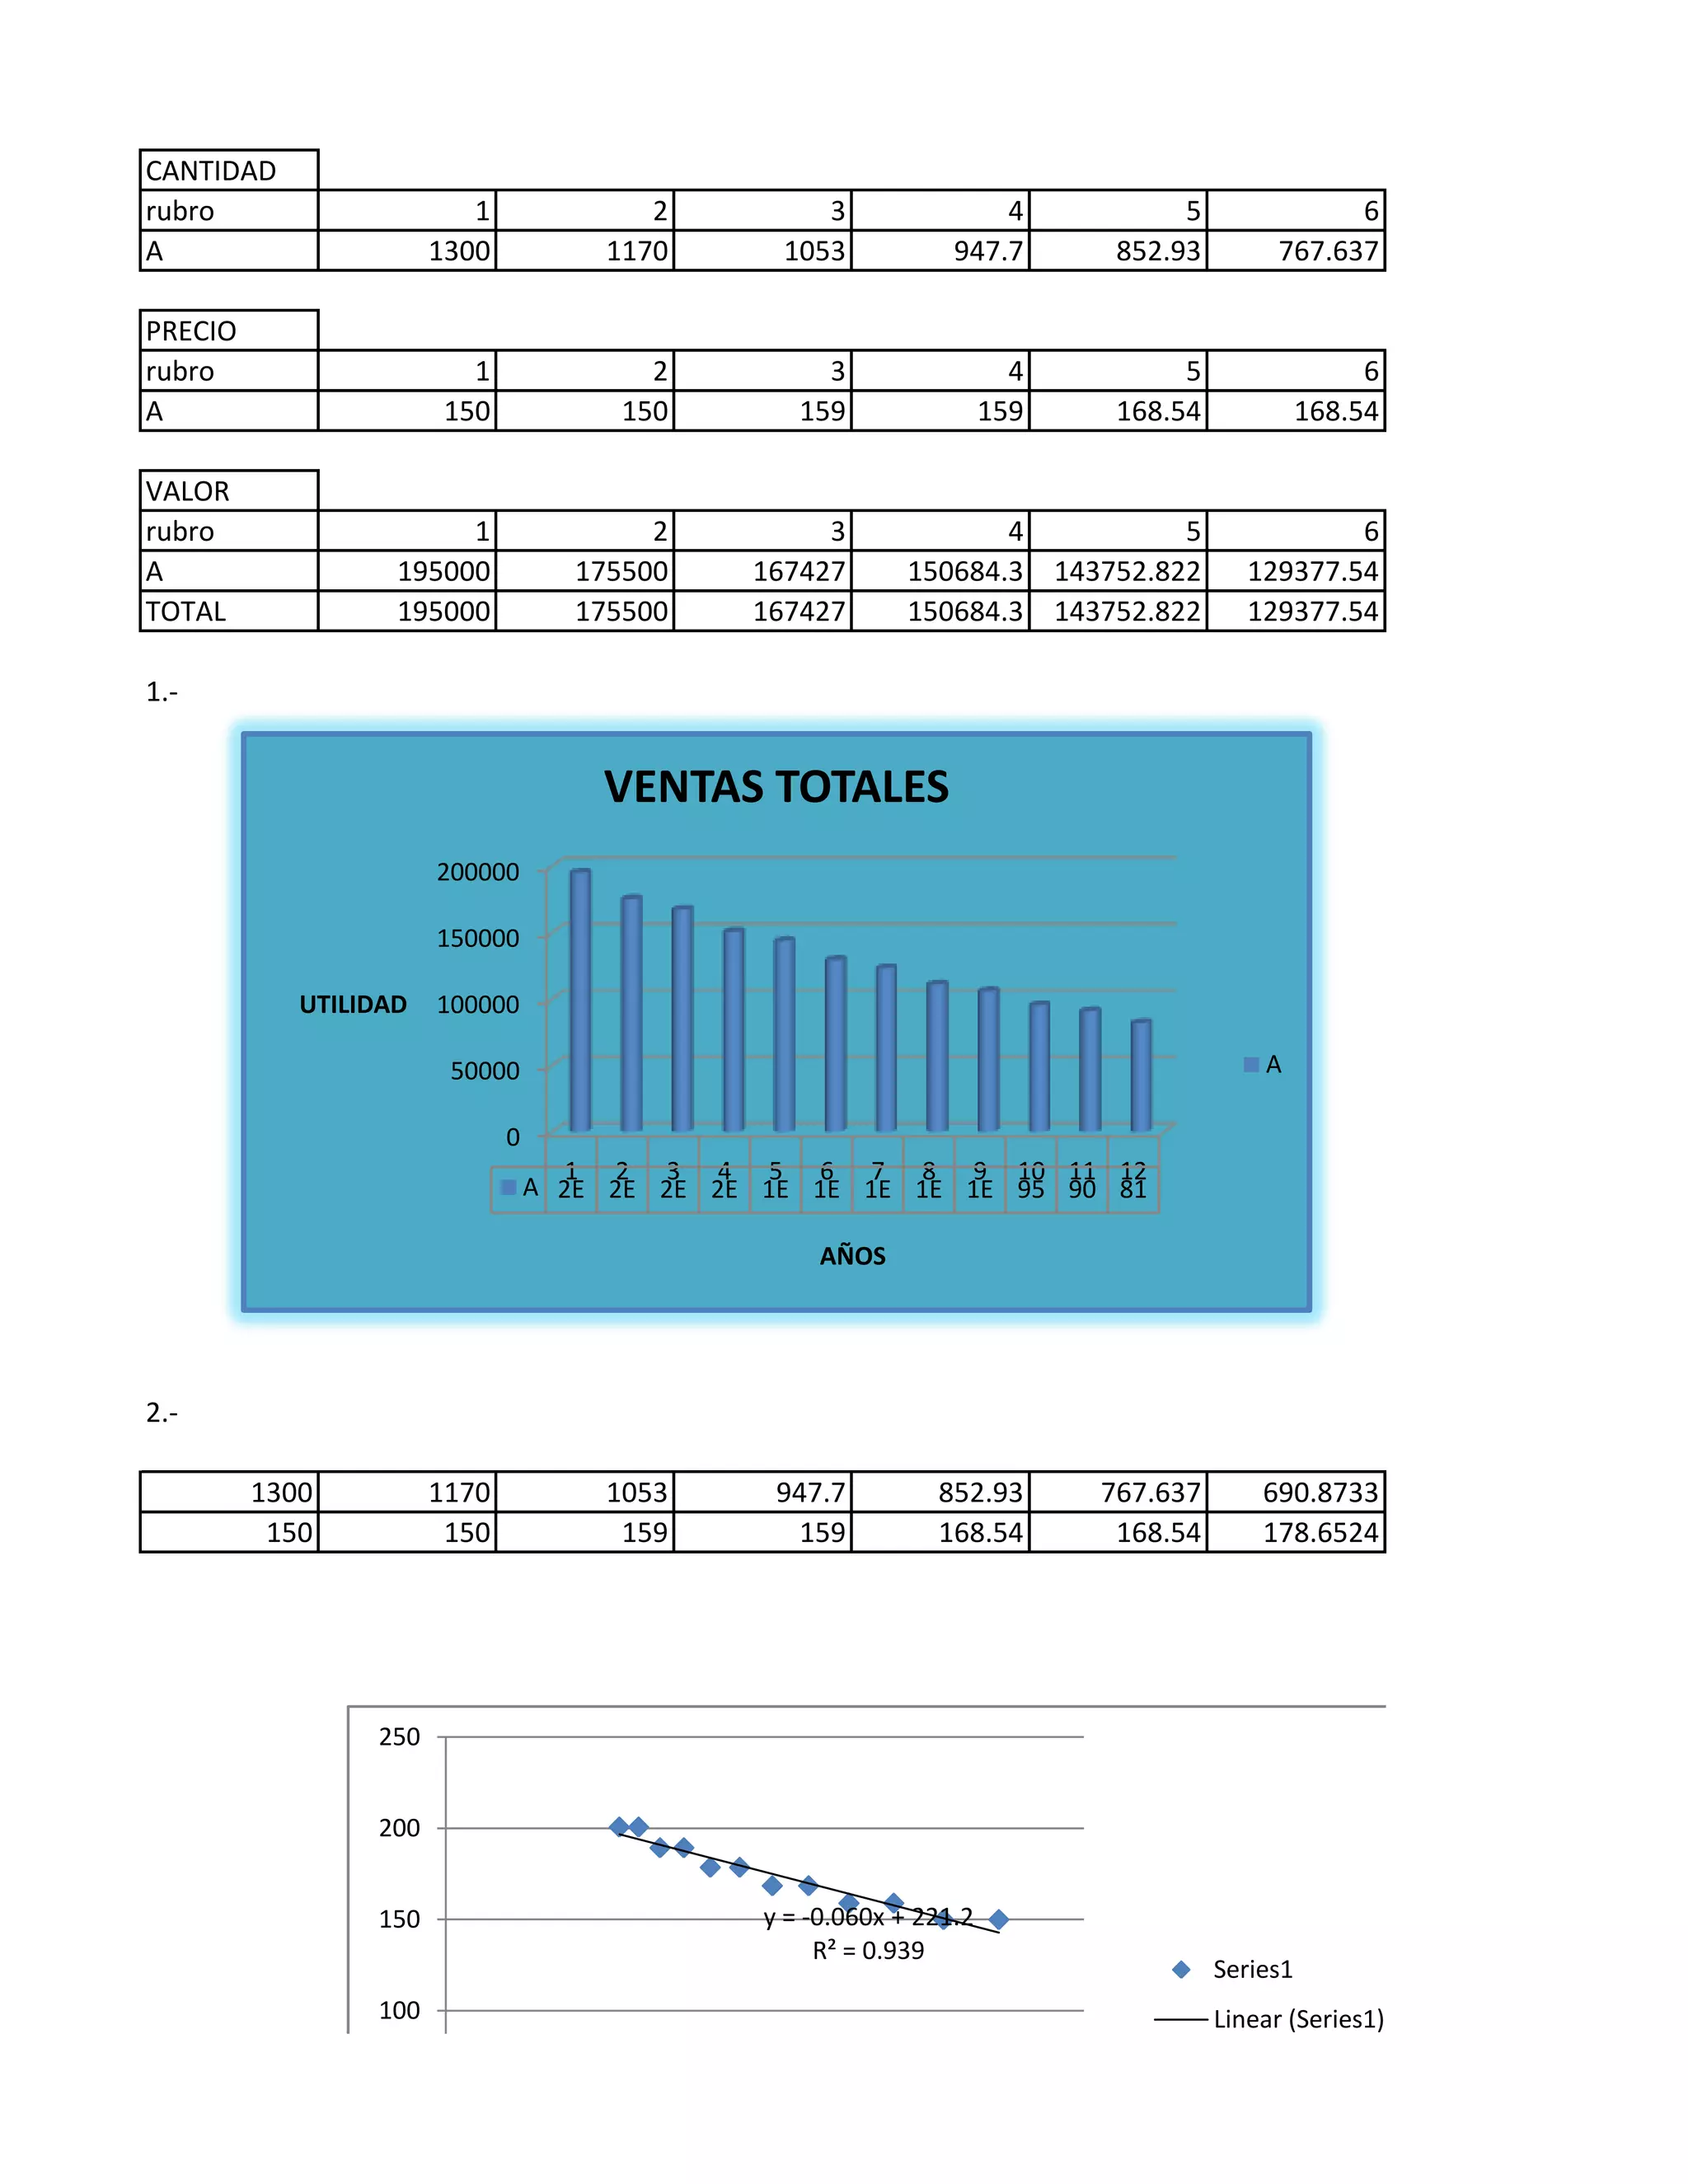
1. The document contains tables showing quantity, price, and value over 6 periods for item A. The total value decreases each period from S/.195,000 to S/.129,377.54.
2. A graph shows total sales for item A over 12 years, decreasing from S/.195,000 in year 1 to S/.123,426.17 in year 7.
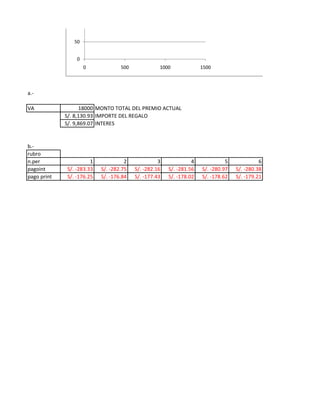
3. Another graph shows a linear relationship between quantity and price for item A, with a correlation coefficient of 0.939, indicating a strong positive linear relationship.