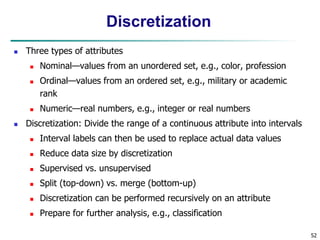
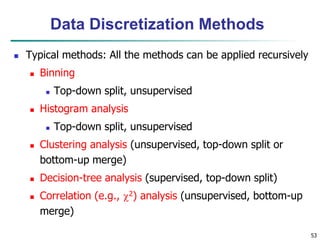
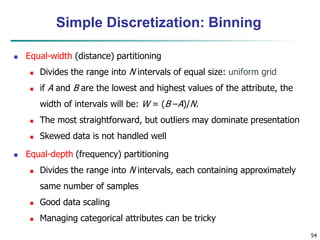
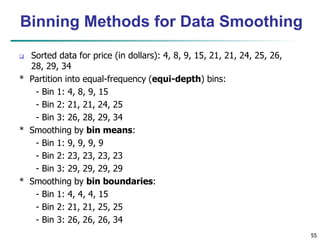
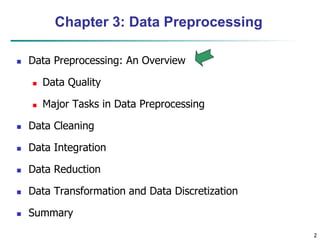
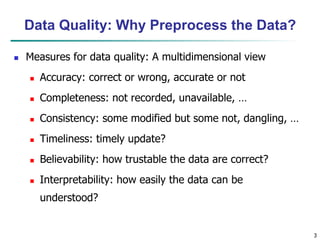
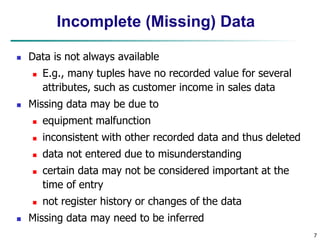
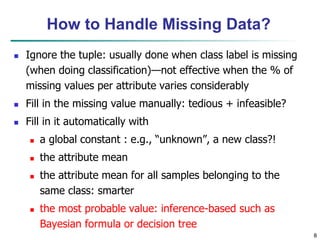
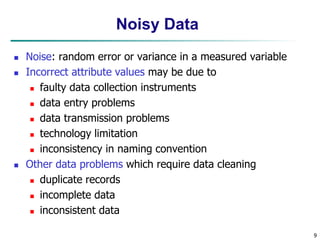
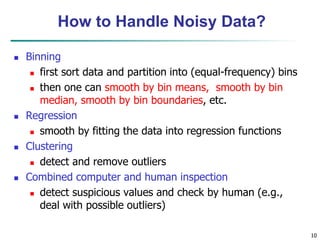
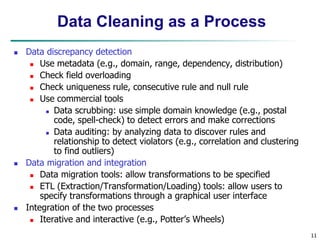
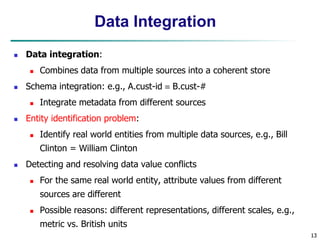
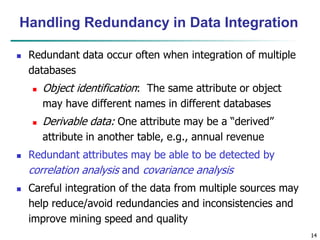
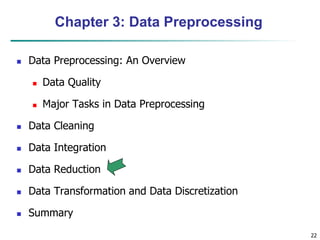
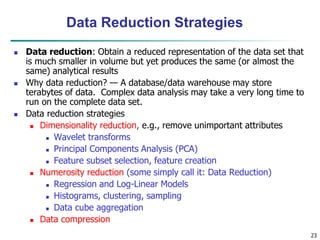
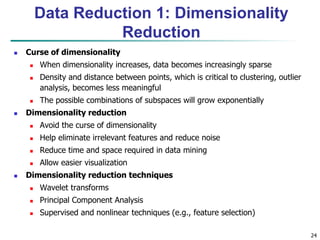
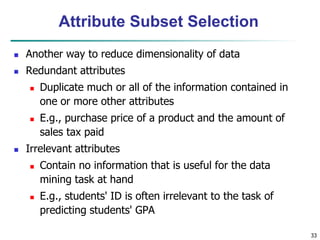
This document summarizes key concepts from Chapter 3 of the textbook "Data Mining: Concepts and Techniques". It discusses the importance of data preprocessing, which includes tasks like data cleaning, integration, reduction, and transformation. Specific techniques are described for handling missing/noisy data, data integration when combining multiple sources, and reducing dimensionality through feature selection or dimension reduction methods like PCA. The goal of preprocessing is to prepare raw data into a format suitable for data mining algorithms.


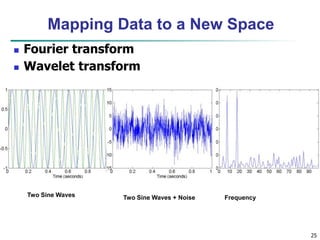
![28
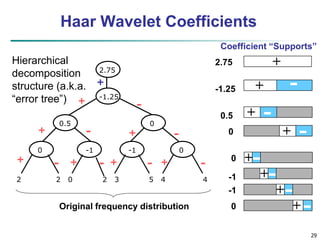
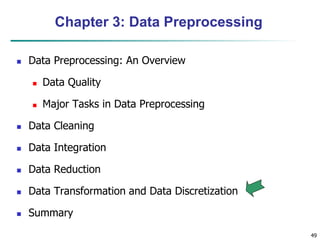
Wavelet Decomposition
Wavelets: A math tool for space-efficient hierarchical
decomposition of functions
S = [2, 2, 0, 2, 3, 5, 4, 4] can be transformed to S^ =
[23/4, -11/4, 1/2, 0, 0, -1, -1, 0]
Compression: many small detail coefficients can be
replaced by 0’s, and only the significant coefficients are
retained](https://image.slidesharecdn.com/03preprocessing-220923050834-006fc9e1/85/Preprocessing-ppt-28-320.jpg)
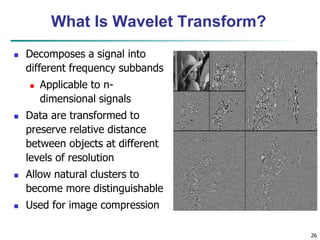
![51
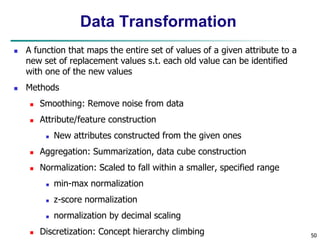
Normalization
Min-max normalization: to [new_minA, new_maxA]
Ex. Let income range $12,000 to $98,000 normalized to [0.0,
1.0]. Then $73,000 is mapped to
Z-score normalization (μ: mean, σ: standard deviation):
Ex. Let μ = 54,000, σ = 16,000. Then
Normalization by decimal scaling
716
.
0
0
)
0
0
.
1
(
000
,
12
000
,
98
000
,
12
600
,
73
A
A
A
A
A
A
min
new
min
new
max
new
min
max
min
v
v _
)
_
_
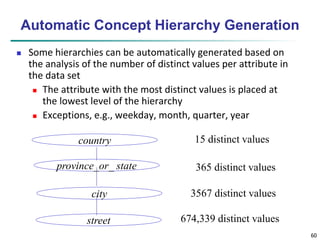
(
'
A
A
v
v
'
j
v
v
10
' Where j is the smallest integer such that Max(|ν’|) < 1
225
.
1
000
,
16
000
,
54
600
,
73
](https://image.slidesharecdn.com/03preprocessing-220923050834-006fc9e1/85/Preprocessing-ppt-51-320.jpg)