What is Statistics?
•is that it is a set of methods for dealing with numerical facts.
• the use of mathematical and statistical methods to analyze and interpret data
gathered during psychological studies.
3.
The two majorareas of statistics
• Descriptive statistics provide a concise description of a collection of
quantitative information. Numbers provide convenient summaries and allow us
to evaluate some observation relative to others. It includes such as mean,
median, and mode.
ex. Got a score of 54 in math you probably want to know what the 54 means. If you
discover that 54 put in the top 5% of the class, then you assume have a good chance to
get 1.00 grade. If you put in the bottom 5%, then you might get the fail grade of 3.00.
4.
• Inferential statisticsis a tool that statisticians use to draw conclusions about
the characteristics of a population, and drawn from the characteristics of a
sample. It is also used to determine how certain they can be of the reliability of
those conclusion. The area of inferential statistics called hypothesis testing
is a decision-making process for evaluating the statements about a population,
based on the information gathered from the samples. Including linear
regression analysis, analysis of variance (ANOVA), logit/Probit models, and
null hypothesis testing.
Ex. To know how many people watch TV by gathering sample survey you can infer the
percentage of people who saw film.
5.
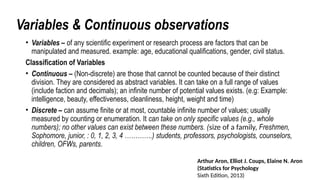
Variables & Continuousobservations
• Variables – of any scientific experiment or research process are factors that can be
manipulated and measured. example: age, educational qualifications, gender, civil status.
Classification of Variables
• Continuous – (Non-discrete) are those that cannot be counted because of their distinct
division. They are considered as abstract variables. It can take on a full range of values
(include faction and decimals); an infinite number of potential values exists. (e.g: Example:
intelligence, beauty, effectiveness, cleanliness, height, weight and time)
• Discrete – can assume finite or at most, countable infinite number of values; usually
measured by counting or enumeration. It can take on only specific values (e.g., whole
numbers); no other values can exist between these numbers. (size of a family, Freshmen,
Sophomore, junior, : 0, 1, 2, 3, 4 ………….) students, professors, psychologists, counselors,
children, OFWs, parents.
Arthur Aron, Elliot J. Coups, Elaine N. Aron
(Statistics for Psychology
Sixth Edition, 2013)
6.
• Qualitative variable– is a variable that can give categorical responses. Example:
occupation, gender, civil status, religious affiliation, political parties.
• Quantitative variable – takes on numerical values representing an amount or quantity..
Example: height, salary, number of children, weight, time
• Independent Variables – variables that the researcher controls or manipulate in
accordance with the purpose of the investigation.
• Dependent Variables – variables that are measures based on the effect of the
independent variables. This is sometime called an outcome variable.
Example: The researcher would like to determine the predictive validity of entrance
requirements for freshman students, the independent variables are the national
achievement test, entrance examination and school grade. The dependent variable is the
performance in first year college.
7.
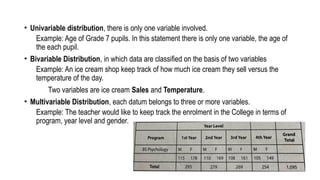
• Univariable distribution,there is only one variable involved.
Example: Age of Grade 7 pupils. In this statement there is only one variable, the age of
the each pupil.
• Bivariable Distribution, in which data are classified on the basis of two variables
Example: An ice cream shop keep track of how much ice cream they sell versus the
temperature of the day.
Two variables are ice cream Sales and Temperature.
• Multivariable Distribution, each datum belongs to three or more variables.
Example: The teacher would like to keep track the enrolment in the College in terms of
program, year level and gender.
8.
• Hypothesis testingis the process of drawing conclusions about whether a particular
relation between variables is supported by the evidence.
• A between-groups research design is an experiment in which participants experience
one, and only one, level of the independent variable. (different participants use in different
condition e.g T-test independent ).
• A within-group research design is a study in which the different levels of the independent
variable are experienced by all participants in the study. (same participants assigned to all
conditions with repeated measurements e.g T-test… dependent ).
9.
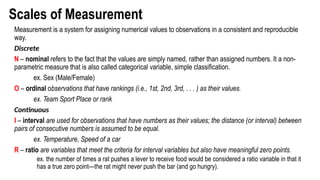
Scales of Measurement
Measurementis a system for assigning numerical values to observations in a consistent and reproducible
way.
Discrete
N – nominal refers to the fact that the values are simply named, rather than assigned numbers. It a non-
parametric measure that is also called categorical variable, simple classification.
ex. Sex (Male/Female)
O – ordinal observations that have rankings (i.e., 1st, 2nd, 3rd, . . . ) as their values.
ex. Team Sport Place or rank
Continuous
I – interval are used for observations that have numbers as their values; the distance (or interval) between
pairs of consecutive numbers is assumed to be equal.
ex. Temperature, Speed of a car
R – ratio are variables that meet the criteria for interval variables but also have meaningful zero points.
ex. the number of times a rat pushes a lever to receive food would be considered a ratio variable in that it
has a true zero point—the rat might never push the bar (and go hungry).
10.
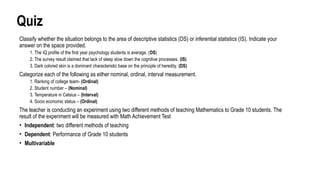
Quiz
Classify whether thesituation belongs to the area of descriptive statistics (DS) or inferential statistics (IS). Indicate your
answer on the space provided.
1. The IQ profile of the first year psychology students is average. (DS)
2. The survey result claimed that lack of sleep slow down the cognitive processes. (IS)
3. Dark colored skin is a dominant characteristic base on the principle of heredity. (DS)
Categorize each of the following as either nominal, ordinal, interval measurement.
1. Ranking of college team- (Ordinal)
2. Student number – (Nominal)
3. Temperature in Celsius – (Interval)
4. Socio economic status – (Ordinal)
The teacher is conducting an experiment using two different methods of teaching Mathematics to Grade 10 students. The
result of the experiment will be measured with Math Achievement Test
• Independent: two different methods of teaching
• Dependent: Performance of Grade 10 students
• Multivariable
11.
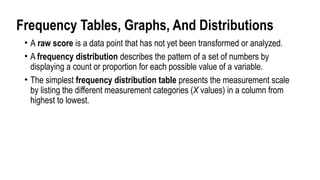
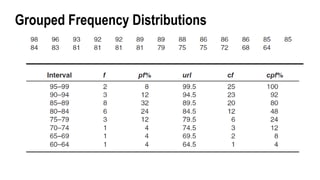
Frequency Tables, Graphs,And Distributions
• A raw score is a data point that has not yet been transformed or analyzed.
• A frequency distribution describes the pattern of a set of numbers by
displaying a count or proportion for each possible value of a variable.
• The simplest frequency distribution table presents the measurement scale
by listing the different measurement categories (X values) in a column from
highest to lowest.
12.
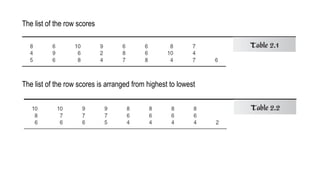
The list ofthe row scores
The list of the row scores is arranged from highest to lowest
13.
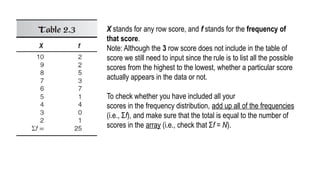
X stands forany row score, and f stands for the frequency of
that score.
Note: Although the 3 row score does not include in the table of
score we still need to input since the rule is to list all the possible
scores from the highest to the lowest, whether a particular score
actually appears in the data or not.
To check whether you have included all your
scores in the frequency distribution, add up all of the frequencies
(i.e., Σf), and make sure that the total is equal to the number of
scores in the array (i.e., check that Σf = N).
14.
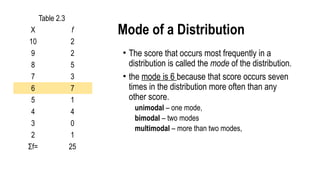
Mode of aDistribution
• The score that occurs most frequently in a
distribution is called the mode of the distribution.
• the mode is 6 because that score occurs seven
times in the distribution more often than any
other score.
unimodal – one mode,
bimodal – two modes
multimodal – more than two modes,
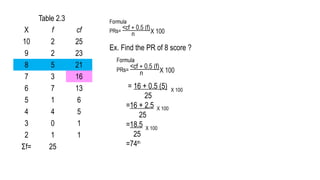
Table 2.3
X f
10 2
9 2
8 5
7 3
6 7
5 1
4 4
3 0
2 1
Σf= 25
15.
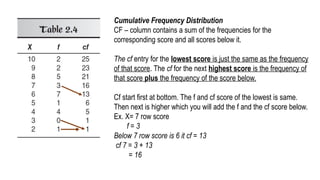
Cumulative Frequency Distribution
CF– column contains a sum of the frequencies for the
corresponding score and all scores below it.
The cf entry for the lowest score is just the same as the frequency
of that score. The cf for the next highest score is the frequency of
that score plus the frequency of the score below.
Cf start first at bottom. The f and cf score of the lowest is same.
Then next is higher which you will add the f and the cf score below.
Ex. X= 7 row score
f = 3
Below 7 row score is 6 it cf = 13
cf 7 = 3 + 13
= 16
16.
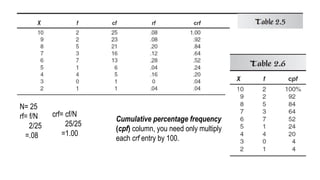
N= 25
rf= f/N
2/25
=.08
Cumulativepercentage frequency
(cpf) column, you need only multiply
each crf entry by 100.
crf= cf/N
25/25
=1.00
17.
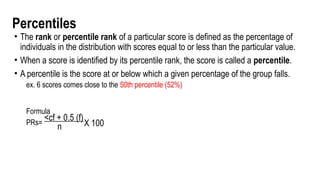
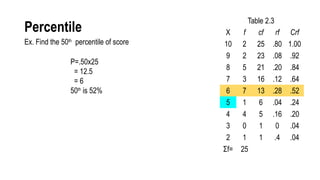
Percentiles
• The rankor percentile rank of a particular score is defined as the percentage of
individuals in the distribution with scores equal to or less than the particular value.
• When a score is identified by its percentile rank, the score is called a percentile.
• A percentile is the score at or below which a given percentage of the group falls.
ex. 6 scores comes close to the 50th percentile (52%)
Formula
PRs=
<cf + 0.5 (f)
n X 100
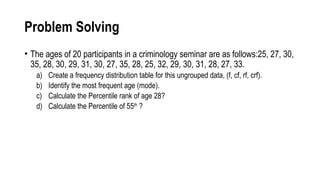
Problem Solving
• Theages of 20 participants in a criminology seminar are as follows:25, 27, 30,
35, 28, 30, 29, 31, 30, 27, 35, 28, 25, 32, 29, 30, 31, 28, 27, 33.
a) Create a frequency distribution table for this ungrouped data, (f, cf, rf, crf).
b) Identify the most frequent age (mode).
c) Calculate the Percentile rank of age 28?
d) Calculate the Percentile of 55th
?
21.
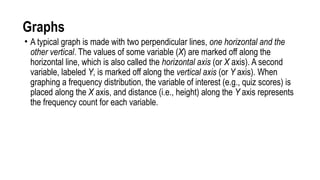
Graphs
• A typicalgraph is made with two perpendicular lines, one horizontal and the
other vertical. The values of some variable (X) are marked off along the
horizontal line, which is also called the horizontal axis (or X axis). A second
variable, labeled Y, is marked off along the vertical axis (or Y axis). When
graphing a frequency distribution, the variable of interest (e.g., quiz scores) is
placed along the X axis, and distance (i.e., height) along the Y axis represents
the frequency count for each variable.
22.
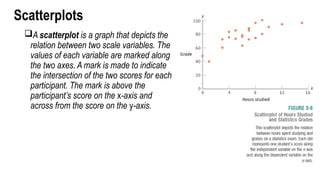
Scatterplots
A scatterplot isa graph that depicts the
relation between two scale variables. The
values of each variable are marked along
the two axes. A mark is made to indicate
the intersection of the two scores for each
participant. The mark is above the
participant’s score on the x-axis and
across from the score on the y-axis.
23.
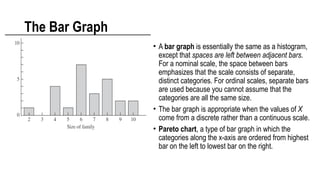
• A bargraph is essentially the same as a histogram,
except that spaces are left between adjacent bars.
For a nominal scale, the space between bars
emphasizes that the scale consists of separate,
distinct categories. For ordinal scales, separate bars
are used because you cannot assume that the
categories are all the same size.
• The bar graph is appropriate when the values of X
come from a discrete rather than a continuous scale.
• Pareto chart, a type of bar graph in which the
categories along the x-axis are ordered from highest
bar on the left to lowest bar on the right.
The Bar Graph
24.
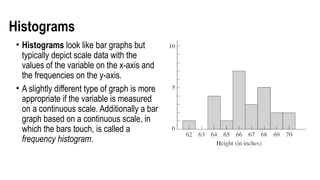
Histograms
• Histograms looklike bar graphs but
typically depict scale data with the
values of the variable on the x-axis and
the frequencies on the y-axis.
• A slightly different type of graph is more
appropriate if the variable is measured
on a continuous scale. Additionally a bar
graph based on a continuous scale, in
which the bars touch, is called a
frequency histogram.
25.
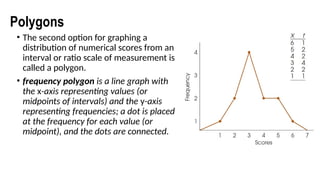
Polygons
• The secondoption for graphing a
distribution of numerical scores from an
interval or ratio scale of measurement is
called a polygon.
• frequency polygon is a line graph with
the x-axis representing values (or
midpoints of intervals) and the y-axis
representing frequencies; a dot is placed
at the frequency for each value (or
midpoint), and the dots are connected.
26.
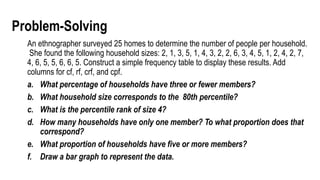
Problem-Solving
An ethnographer surveyed25 homes to determine the number of people per household.
She found the following household sizes: 2, 1, 3, 5, 1, 4, 3, 2, 2, 6, 3, 4, 5, 1, 2, 4, 2, 7,
4, 6, 5, 5, 6, 6, 5. Construct a simple frequency table to display these results. Add
columns for cf, rf, crf, and cpf.
a. What percentage of households have three or fewer members?
b. What household size corresponds to the 80th percentile?
c. What is the percentile rank of size 4?
d. How many households have only one member? To what proportion does that
correspond?
e. What proportion of households have five or more members?
f. Draw a bar graph to represent the data.
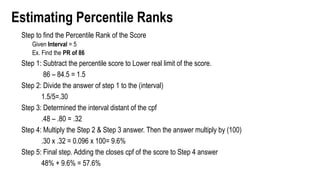
Estimating Percentile Ranks
Stepto find the Percentile Rank of the Score
Given Interval = 5
Ex. Find the PR of 86
Step 1: Subtract the percentile score to Lower real limit of the score.
86 – 84.5 = 1.5
Step 2: Divide the answer of step 1 to the (interval)
1.5/5=.30
Step 3: Determined the interval distant of the cpf
.48 – .80 = .32
Step 4: Multiply the Step 2 & Step 3 answer. Then the answer multiply by (100)
.30 x .32 = 0.096 x 100= 9.6%
Step 5: Final step. Adding the closes cpf of the score to Step 4 answer
48% + 9.6% = 57.6%
31.
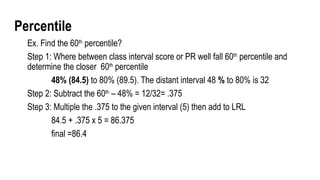
Percentile
Ex. Find the60th
percentile?
Step 1: Where between class interval score or PR well fall 60th
percentile and
determine the closer 60th
percentile
48% (84.5) to 80% (89.5). The distant interval 48 % to 80% is 32
Step 2: Subtract the 60th
– 48% = 12/32= .375
Step 3: Multiple the .375 to the given interval (5) then add to LRL
84.5 + .375 x 5 = 86.375
final =86.4