Downloaded 217 times


![[1]](https://image.slidesharecdn.com/7829b59c-4a0d-4342-bf7f-e4d92830d867-151209090511-lva1-app6891/85/ppt-4-320.jpg)
![[2]](https://image.slidesharecdn.com/7829b59c-4a0d-4342-bf7f-e4d92830d867-151209090511-lva1-app6891/85/ppt-5-320.jpg)

![[3]](https://image.slidesharecdn.com/7829b59c-4a0d-4342-bf7f-e4d92830d867-151209090511-lva1-app6891/85/ppt-7-320.jpg)


![Components :
Receptor
The receptor is in contact with the
anlyte (i.e. the sample) and its prime
duty to provide high selectivity
towards the desired analyte in the
presence of other chemical species .
It also transforms the analyte
concentration into a chemical or
physical output signal with a defined
sensitivity .
[4]](https://image.slidesharecdn.com/7829b59c-4a0d-4342-bf7f-e4d92830d867-151209090511-lva1-app6891/85/ppt-16-320.jpg)
![Components :
Transducer
The transducer is another crucial
component of the sensor.
The transducer converts the signal
generated by the receptor to a
readable value .
[5]](https://image.slidesharecdn.com/7829b59c-4a0d-4342-bf7f-e4d92830d867-151209090511-lva1-app6891/85/ppt-17-320.jpg)


![References
[1] Liang Fenga , Xiao Li , Hui Li , Wei Yanga, Liang Chena, Yafeng Guana,
Enhancement of sensitivity of paper-based sensor array for the identification of
heavy-metal ions, Science Direct, Analytica Chimica Acta 780 (2013) 74– 80.
[2] Klaus Koren, Michael Kühl, A simple laminated paper-based sensor for
temperature sensing and imaging, Science Direct, Sensors and Actuators B 210
(2015) 124–128.
[3] http://www.uv.es/positive/loc.html
[4] Non-invasive wearable electrochemical sensors: a review Amay J. Bandodkar and
Joseph Wang Department of Nano Engineering, University of California, San Diego La
Jolla, CA 92093, USA . Trends in Biotechnology July 2014, Vol. 32, No. 7.
[5] Yufen Zhang, Dominic Rochefort, Fast and effective paper based sensor for self-
diagnosis of bacterial vaginosis, Science Direct, Analytica Chimica Acta 800 (2013) 87–
94.](https://image.slidesharecdn.com/7829b59c-4a0d-4342-bf7f-e4d92830d867-151209090511-lva1-app6891/85/ppt-52-320.jpg)
![[6]Danielle Cristhina Melo Ferreira , Gabriela Furlan Giordano , Caio Césardos Santos
Penteado Soares, Jessica Fernanda Afonsode Oliveira , Renata Kelly Mendes , Maria
Helena Piazzetta , Angelo Luiz Gobbi , Mateus Borba Cardoso, Optical paper based
sensor for ascorbic acid quantification using silver nanoparticles, Science Direct,
Talanta141(2015)188–194.
[7]Shenguang Ge, LinaZhang, YanZhang, HaiyunLiu, JiadongHuang, MeiYan, Jinghua
Yu, Electrochemical K-562 cells sensor based on origami paper device for point-of-
care testing, Science Direct, Talanta141(2015)05-008.
[8]Lianghui Huang, Peng Jiang, Dong Wang, Yuanfang Luo, Mufang Li, Hoseon
Lee,Rosario A. Gerhardt, A novel paper-based flexible ammonia gas sensor via silver
and SWNT-PABS inkjet printing, Science Direct, Sensors and Actuators B 197 (2014)
308–313.
[9]Agne Swerin, Isabel Mira, Ink-jettable paper-based sensor for charged
macromolecules and surfactants, Science Direct, Sensors and Actuators B 195 (2014)
389–395.
References](https://image.slidesharecdn.com/7829b59c-4a0d-4342-bf7f-e4d92830d867-151209090511-lva1-app6891/85/ppt-53-320.jpg)
![References
[10]M. Rahmat, W. Maulinaa, Isnaeni, D.Y.N. Miftah, N. Sukmawati, E. Rustamia,M.
Azis, K.B. Seminar, A.S. Yuwono, Y.H. Cho, H. Alatas, Development of a novel ozone
gas sensor based on sol–gel fabricated photonic crystal, Science direct, Sensors and
Actuators A 220 (2014) 53–61.
[11]Haitao Cheng, Gang Shao, Siamak Ebadi, Xinhua Ren, Kyle Harris, Jian Liu,
Chengying Xu, Linan An, Xun Gong, Evanescent-mode-resonator-based and antenna-
integrated wireless passive pressure sensors for harsh-environment applications,
Science direct, Sensors and Actuators A 220 (2014) 22–33.
[12]K. Bremera, M. Meinhardt-Wollweber, T. Thiel, G. Werner, T. Sun,K.T.V. Grattan, B.
Roth, Sewerage tunnel leakage detection using a fibre optic moisture-detecting
sensor system, Science direct, Sensors and Actuators A 220 (2014) 62–68.
[13]Jinquan Yanga, Jianwei Chenb, Yikai Zhoub, Kangbing Wua A nano-copper
electrochemical sensor for sensitive detection of chemical oxygen ,Science direct,
Sensors and Actuators B 153 (2011) 78–82.](https://image.slidesharecdn.com/7829b59c-4a0d-4342-bf7f-e4d92830d867-151209090511-lva1-app6891/85/ppt-54-320.jpg)


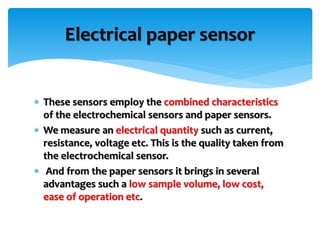
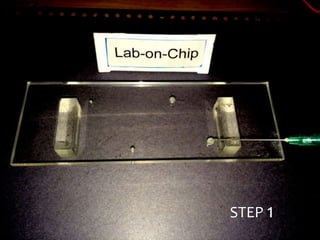
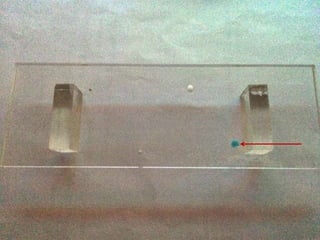
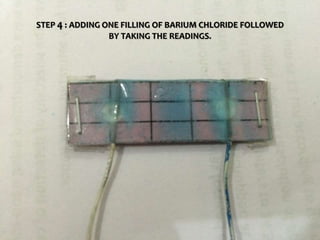
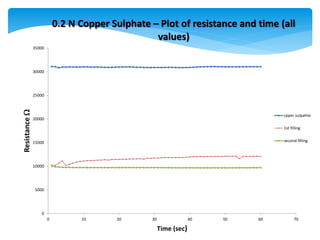
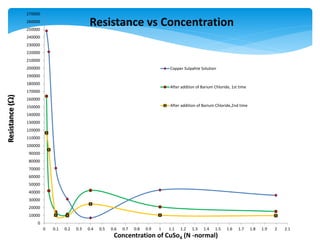
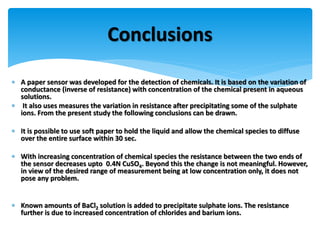
1) An electrical paper sensor was developed to detect chemicals such as sulphate ions. The sensor measured resistance of solutions containing copper sulphate at various concentrations. 2) As copper sulphate concentration increased from 0.02N to 0.4N, resistance decreased, then slightly increased, indicating the sensor is more sensitive at lower concentrations. 3) Barium chloride was added, precipitating some sulphate ions. Resistance decreased confirming the presence of sulphate ions. The experiment validated the sensor for quantitative analysis of sulphate ions.


