The document summarizes the evolution of Earth from its formation to present day. It describes how:
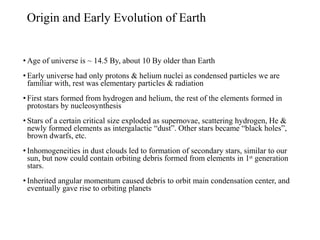
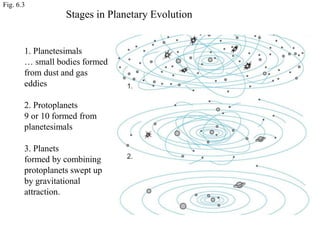
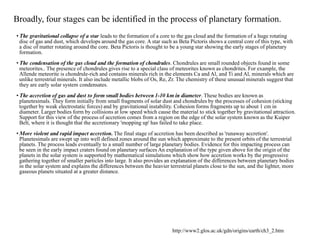
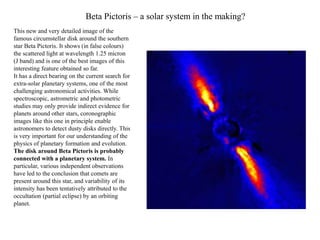
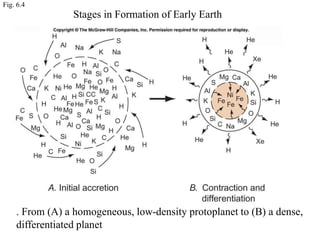
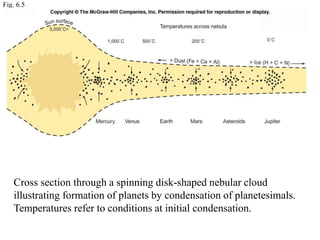
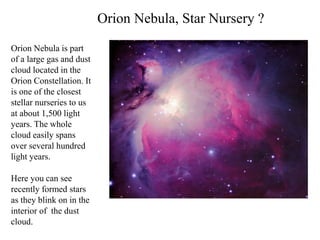
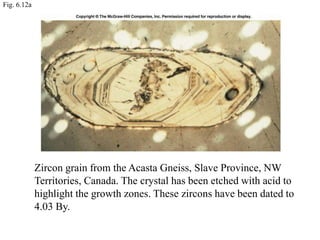
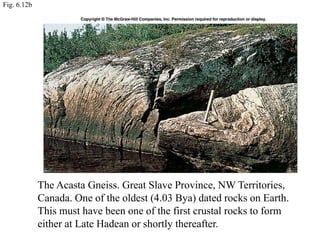
- Dust and gas coalesced from the solar nebula to form planetesimals and eventually Earth around 4.5 billion years ago.
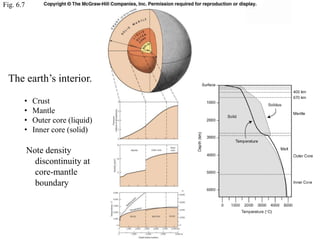
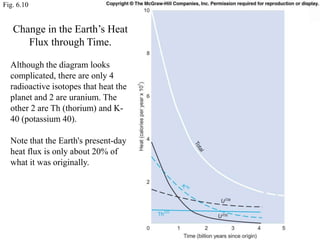
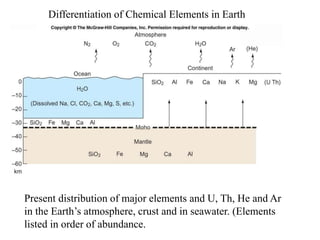
- Early Earth was mostly molten due to heavy bombardment and radioactive decay. The heat allowed the planet to differentiate into a core, mantle, and crust.
- As Earth cooled, water and an atmosphere formed. Photosynthetic life evolved and increased oxygen in the atmosphere around 2.4 billion years ago.
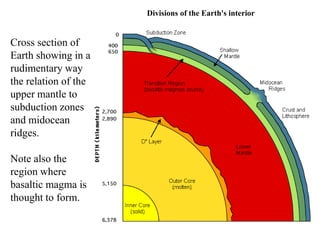
- Plate tectonics and volcanism have continuously recycled Earth's crust and regulated temperatures and atmospheric gases through geologic time.