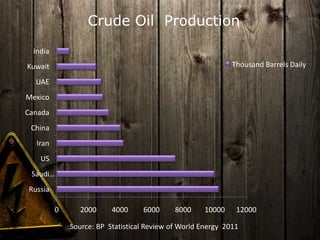
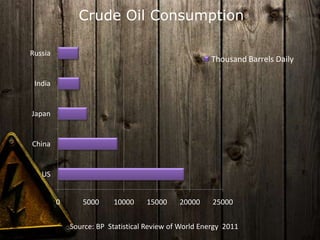
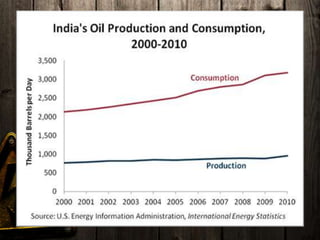
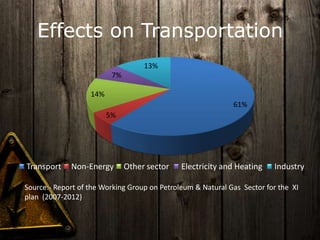
Impact Of Crude Oil Price
On Indian Economy
Presented By
• Nilesh Patil – 23
• Manali Gaonkar - 7
• Priti Raut - 29
• Abhijit Patil-21
What Crude Oil
• Crude oil is a naturally-occurring substance found
in certain rock formations in the earth.
• It is a dark, sticky liquid classified as a
hydrocarbon. This means, it is a compound
containing mainly carbon and hydrogen.
• Crude oil is highly flammable and can be burned
to create energy.
• Petroleum= Petra (Rock) + Oleum (Oil) (Latin)
Crude Oil Production
Source: BP Statistical Review of World Energy 2011
0 2000 4000 6000 8000 10000 12000
Russia
Saudi…
US
Iran
China
Canada
Mexico
UAE
Kuwait
India
Thousand Barrels Daily
Crude Oil Consumption
Source: BP Statistical Review of World Energy 2011
0 5000 10000 15000 20000 25000
US
China
Japan
India
Russia
Thousand Barrels Daily
Source: BP Statistical Review of World Energy 2011
India’s Oil Import
11%
18%
5%
10%
22%
34%
Iran Saudi Arabia Other
Western Hemisphere Africa Other Middle East
Source: Global Trade Atlas
Energy Consumption In India
24%
1%
24%
2%
42%
7%
Oil
Nuclear
Combustible Renewables and Waste
Other Renewables
Coal
Source: The International Energy Agency
Consumption of Major Petroleum
Products
9%
8%
36%
7%
40%
LPG Kerosene
Diesel Petrol
All other products
Source: Ministry of Petroleum Basic Statics
Source:- Energy Information Administration and Bureau of Labor Statistics 2012
Crude Oil Price
Factor affecting crude oil price
• World oil demand
• World oil supply
• Weather conditions
• Government policy
• Political Conditions
• Futures Market
Subsidy
• India’s subsidy bill zoomed to Rs 2.16 trillion or
2.5% of GDP .
• It was due to two reason:
 High Crude Oil prices
 Fertilizer subsidies, primarily on account of
imported non-urea fertilizers.
• Last year budget government pegged curde oil
price of brent at $90. This year they kept the
same at $115.
• Next year government has reduced the budgeted
amount for oil subsidy to Rs43580 crore.
Crude Oil Subsidy
0
20000
40000
60000
80000
Crude Oil Subsidy
Chart Title
2010-11 2011-12
Rs in Cr
78% jump
Source: Budget document
Impact of increase in oil prices on
growth and inflation levels in India
International
oil
prices per
barrel ($)
Increase in
international
oil prices (%)
Extent of fall in
manufacturing
sector
(%)
Extent of fall in
GDP growth
(%)
Extent of
increase in WPI
(%)
50 38.9 2.1 0.4 1.5
60 66.7 9.7 1.9 3.6
70 94.2 16.9 3.4 5.7
80 122.2 24.5 4.9 7.9
140 126.1 29.7 7.3 7.2
Source:- Extractive Industries for Development Report
GDP=Private Consumption + Gross Investment + Govt Spending + ( Export – Import).
Inflation
• Crude oil price move up or down, inflation
follows in the same direction.
• Crude oil price increases, it’s directly
affects the rate inflation. When the prices
went to high of more than $100/barrel in
2008, the inflation also went up to
12.27% which was highest for India in
previous two decade.
Effects on Transportation
61%
5%
14%
7%
13%
Transport Non-Energy Other sector Electricity and Heating Industry
Source:- Report of the Working Group on Petroleum & Natural Gas Sector for the XI
plan (2007-2012)
• The transport sector is clearly dominant in
petroleum product consumption.
• Transport sector consumes 60% of total
petroleum products.
• Road transport accounts for an even
higher percentage of energy consumption.
Steps taken by the govt. and
RBI
 What Govt. did ?
1. Provided huge amount of subsidies to oil
companies to keep them solvent.
2. This increased domestic prices of diesel and
petrol.
3. Start looking for alternate energy options to
prevent future oil shocks.
 What RBI did?
Increase in CRR, Repo rates.
(i.e. used monetary tools to calm down the heat)
Conclusion
To summarize the study
When Oil prices Moves UP :
1.Inflation increases
2.Govt. spending on subsidy increases
3.Foreign currency reserves reduce
4.Our export becomes weaker
5.GDP is affected negatively
6.Share market crumbles
7.Investment decreases
Thank You

Ppppppppppppppppppppp

  • 1.
    Impact Of CrudeOil Price On Indian Economy Presented By • Nilesh Patil – 23 • Manali Gaonkar - 7 • Priti Raut - 29 • Abhijit Patil-21
  • 2.
    What Crude Oil •Crude oil is a naturally-occurring substance found in certain rock formations in the earth. • It is a dark, sticky liquid classified as a hydrocarbon. This means, it is a compound containing mainly carbon and hydrogen. • Crude oil is highly flammable and can be burned to create energy. • Petroleum= Petra (Rock) + Oleum (Oil) (Latin)
  • 3.
    Crude Oil Production Source:BP Statistical Review of World Energy 2011 0 2000 4000 6000 8000 10000 12000 Russia Saudi… US Iran China Canada Mexico UAE Kuwait India Thousand Barrels Daily
  • 4.
    Crude Oil Consumption Source:BP Statistical Review of World Energy 2011 0 5000 10000 15000 20000 25000 US China Japan India Russia Thousand Barrels Daily
  • 5.
    Source: BP StatisticalReview of World Energy 2011
  • 6.
    India’s Oil Import 11% 18% 5% 10% 22% 34% IranSaudi Arabia Other Western Hemisphere Africa Other Middle East Source: Global Trade Atlas
  • 7.
    Energy Consumption InIndia 24% 1% 24% 2% 42% 7% Oil Nuclear Combustible Renewables and Waste Other Renewables Coal Source: The International Energy Agency
  • 8.
    Consumption of MajorPetroleum Products 9% 8% 36% 7% 40% LPG Kerosene Diesel Petrol All other products Source: Ministry of Petroleum Basic Statics
  • 10.
    Source:- Energy InformationAdministration and Bureau of Labor Statistics 2012 Crude Oil Price
  • 11.
    Factor affecting crudeoil price • World oil demand • World oil supply • Weather conditions • Government policy • Political Conditions • Futures Market
  • 12.
    Subsidy • India’s subsidybill zoomed to Rs 2.16 trillion or 2.5% of GDP . • It was due to two reason:  High Crude Oil prices  Fertilizer subsidies, primarily on account of imported non-urea fertilizers. • Last year budget government pegged curde oil price of brent at $90. This year they kept the same at $115. • Next year government has reduced the budgeted amount for oil subsidy to Rs43580 crore.
  • 13.
    Crude Oil Subsidy 0 20000 40000 60000 80000 CrudeOil Subsidy Chart Title 2010-11 2011-12 Rs in Cr 78% jump Source: Budget document
  • 14.
    Impact of increasein oil prices on growth and inflation levels in India International oil prices per barrel ($) Increase in international oil prices (%) Extent of fall in manufacturing sector (%) Extent of fall in GDP growth (%) Extent of increase in WPI (%) 50 38.9 2.1 0.4 1.5 60 66.7 9.7 1.9 3.6 70 94.2 16.9 3.4 5.7 80 122.2 24.5 4.9 7.9 140 126.1 29.7 7.3 7.2 Source:- Extractive Industries for Development Report GDP=Private Consumption + Gross Investment + Govt Spending + ( Export – Import).
  • 15.
    Inflation • Crude oilprice move up or down, inflation follows in the same direction. • Crude oil price increases, it’s directly affects the rate inflation. When the prices went to high of more than $100/barrel in 2008, the inflation also went up to 12.27% which was highest for India in previous two decade.
  • 16.
    Effects on Transportation 61% 5% 14% 7% 13% TransportNon-Energy Other sector Electricity and Heating Industry Source:- Report of the Working Group on Petroleum & Natural Gas Sector for the XI plan (2007-2012)
  • 17.
    • The transportsector is clearly dominant in petroleum product consumption. • Transport sector consumes 60% of total petroleum products. • Road transport accounts for an even higher percentage of energy consumption.
  • 18.
    Steps taken bythe govt. and RBI  What Govt. did ? 1. Provided huge amount of subsidies to oil companies to keep them solvent. 2. This increased domestic prices of diesel and petrol. 3. Start looking for alternate energy options to prevent future oil shocks.  What RBI did? Increase in CRR, Repo rates. (i.e. used monetary tools to calm down the heat)
  • 19.
    Conclusion To summarize thestudy When Oil prices Moves UP : 1.Inflation increases 2.Govt. spending on subsidy increases 3.Foreign currency reserves reduce 4.Our export becomes weaker 5.GDP is affected negatively 6.Share market crumbles 7.Investment decreases
  • 20.