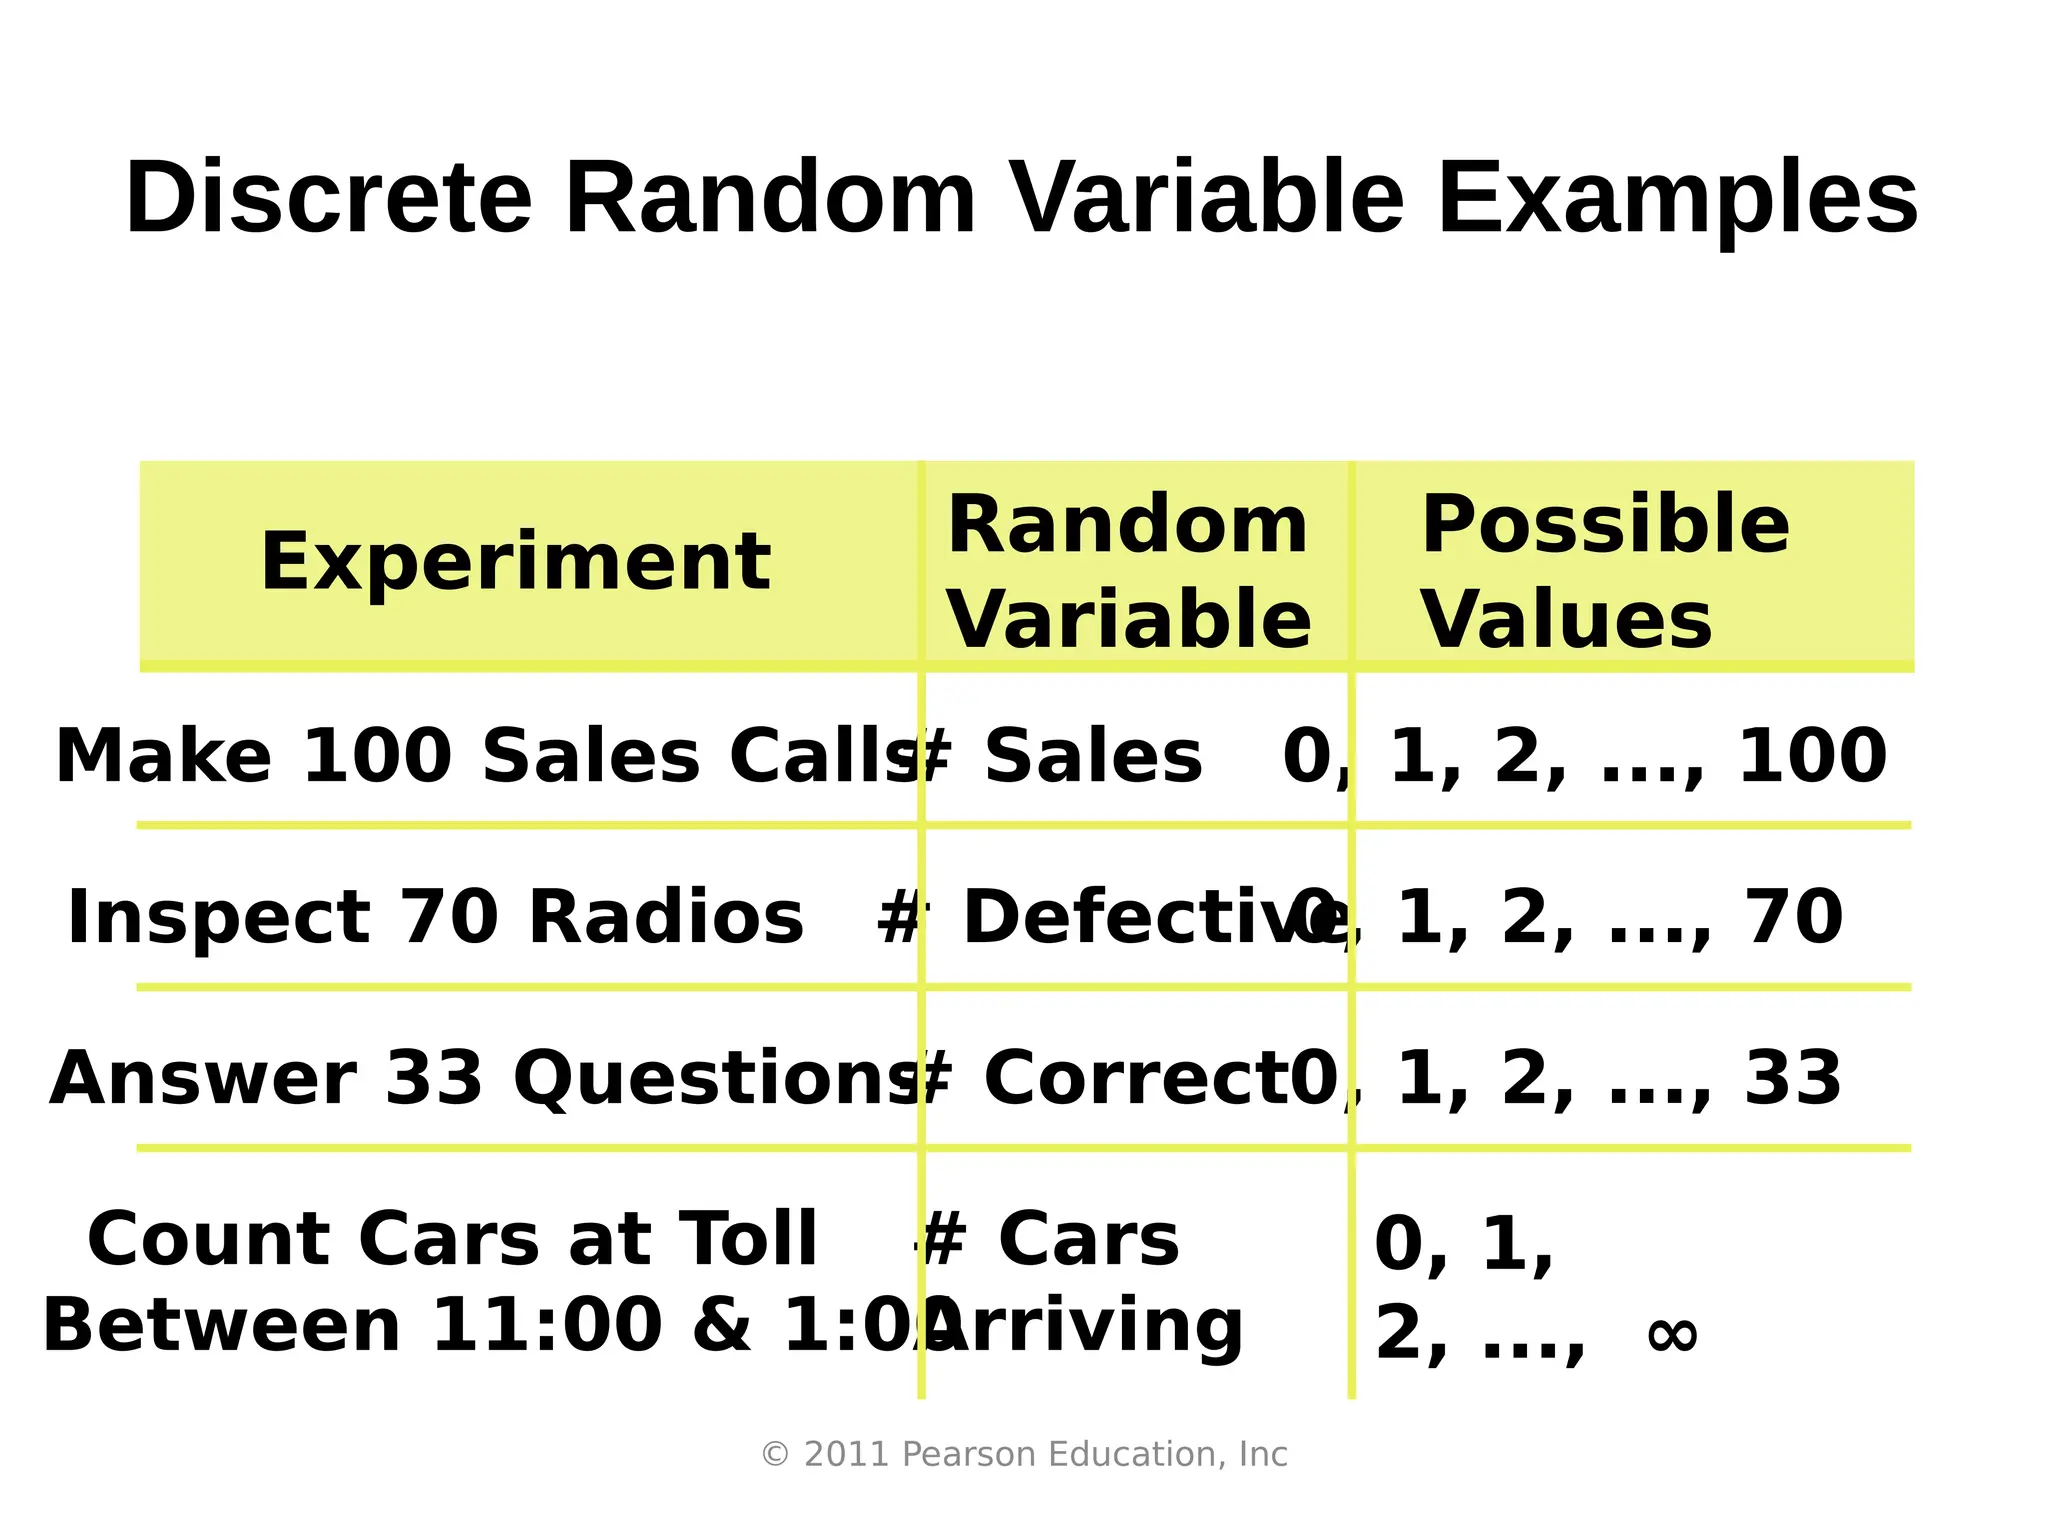
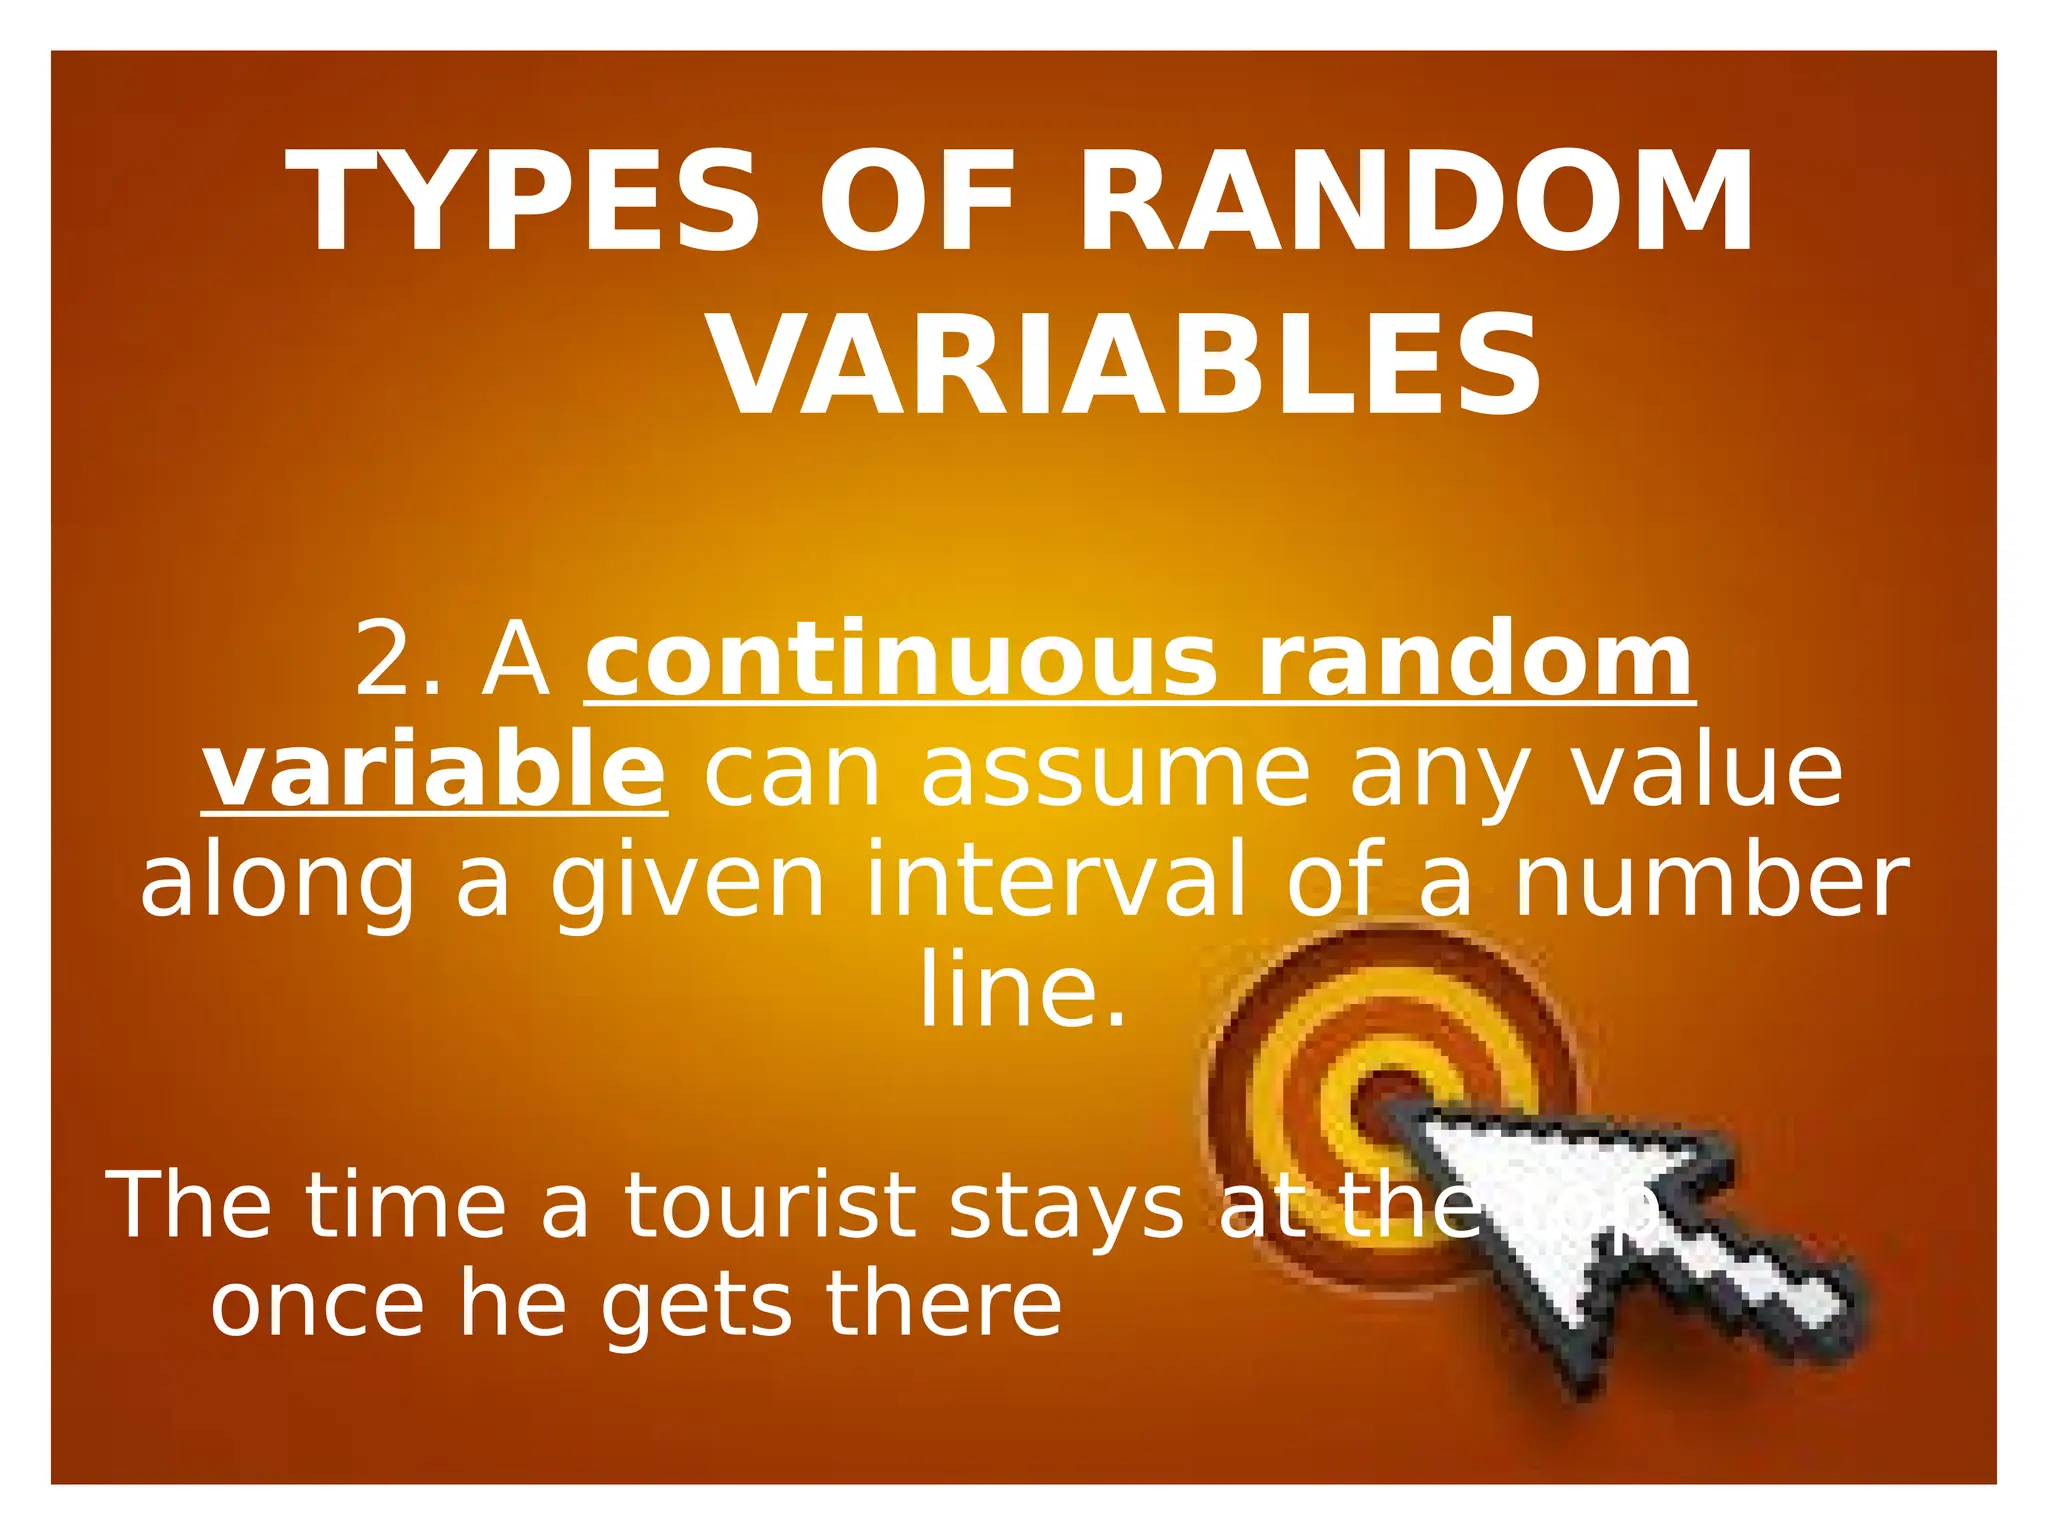
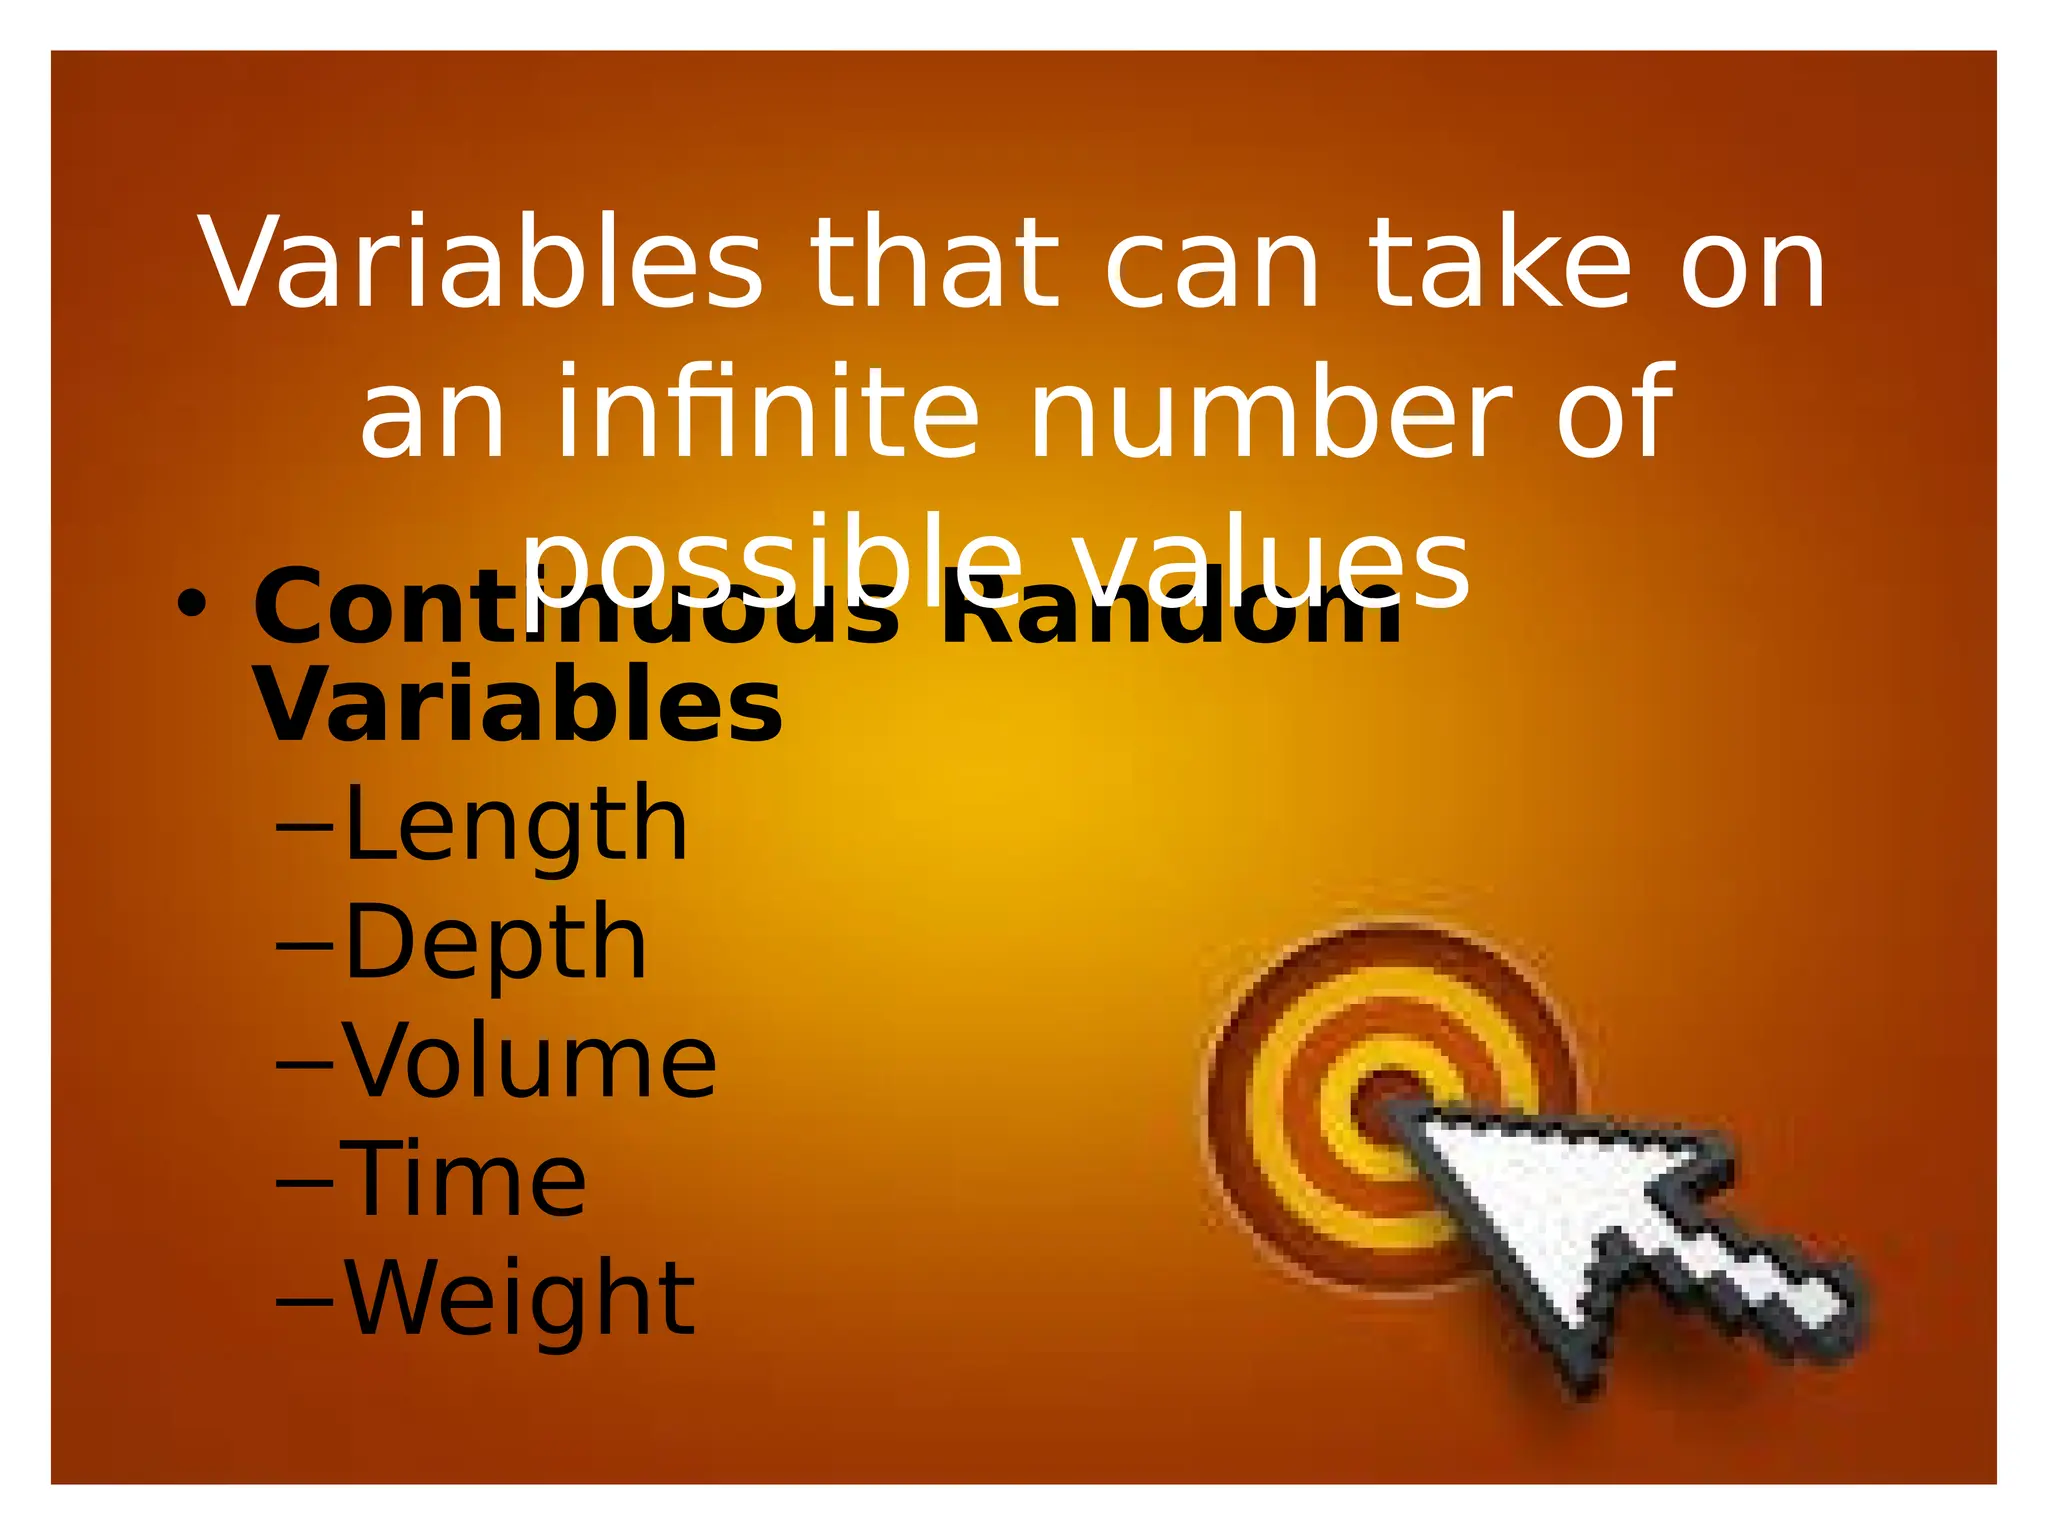
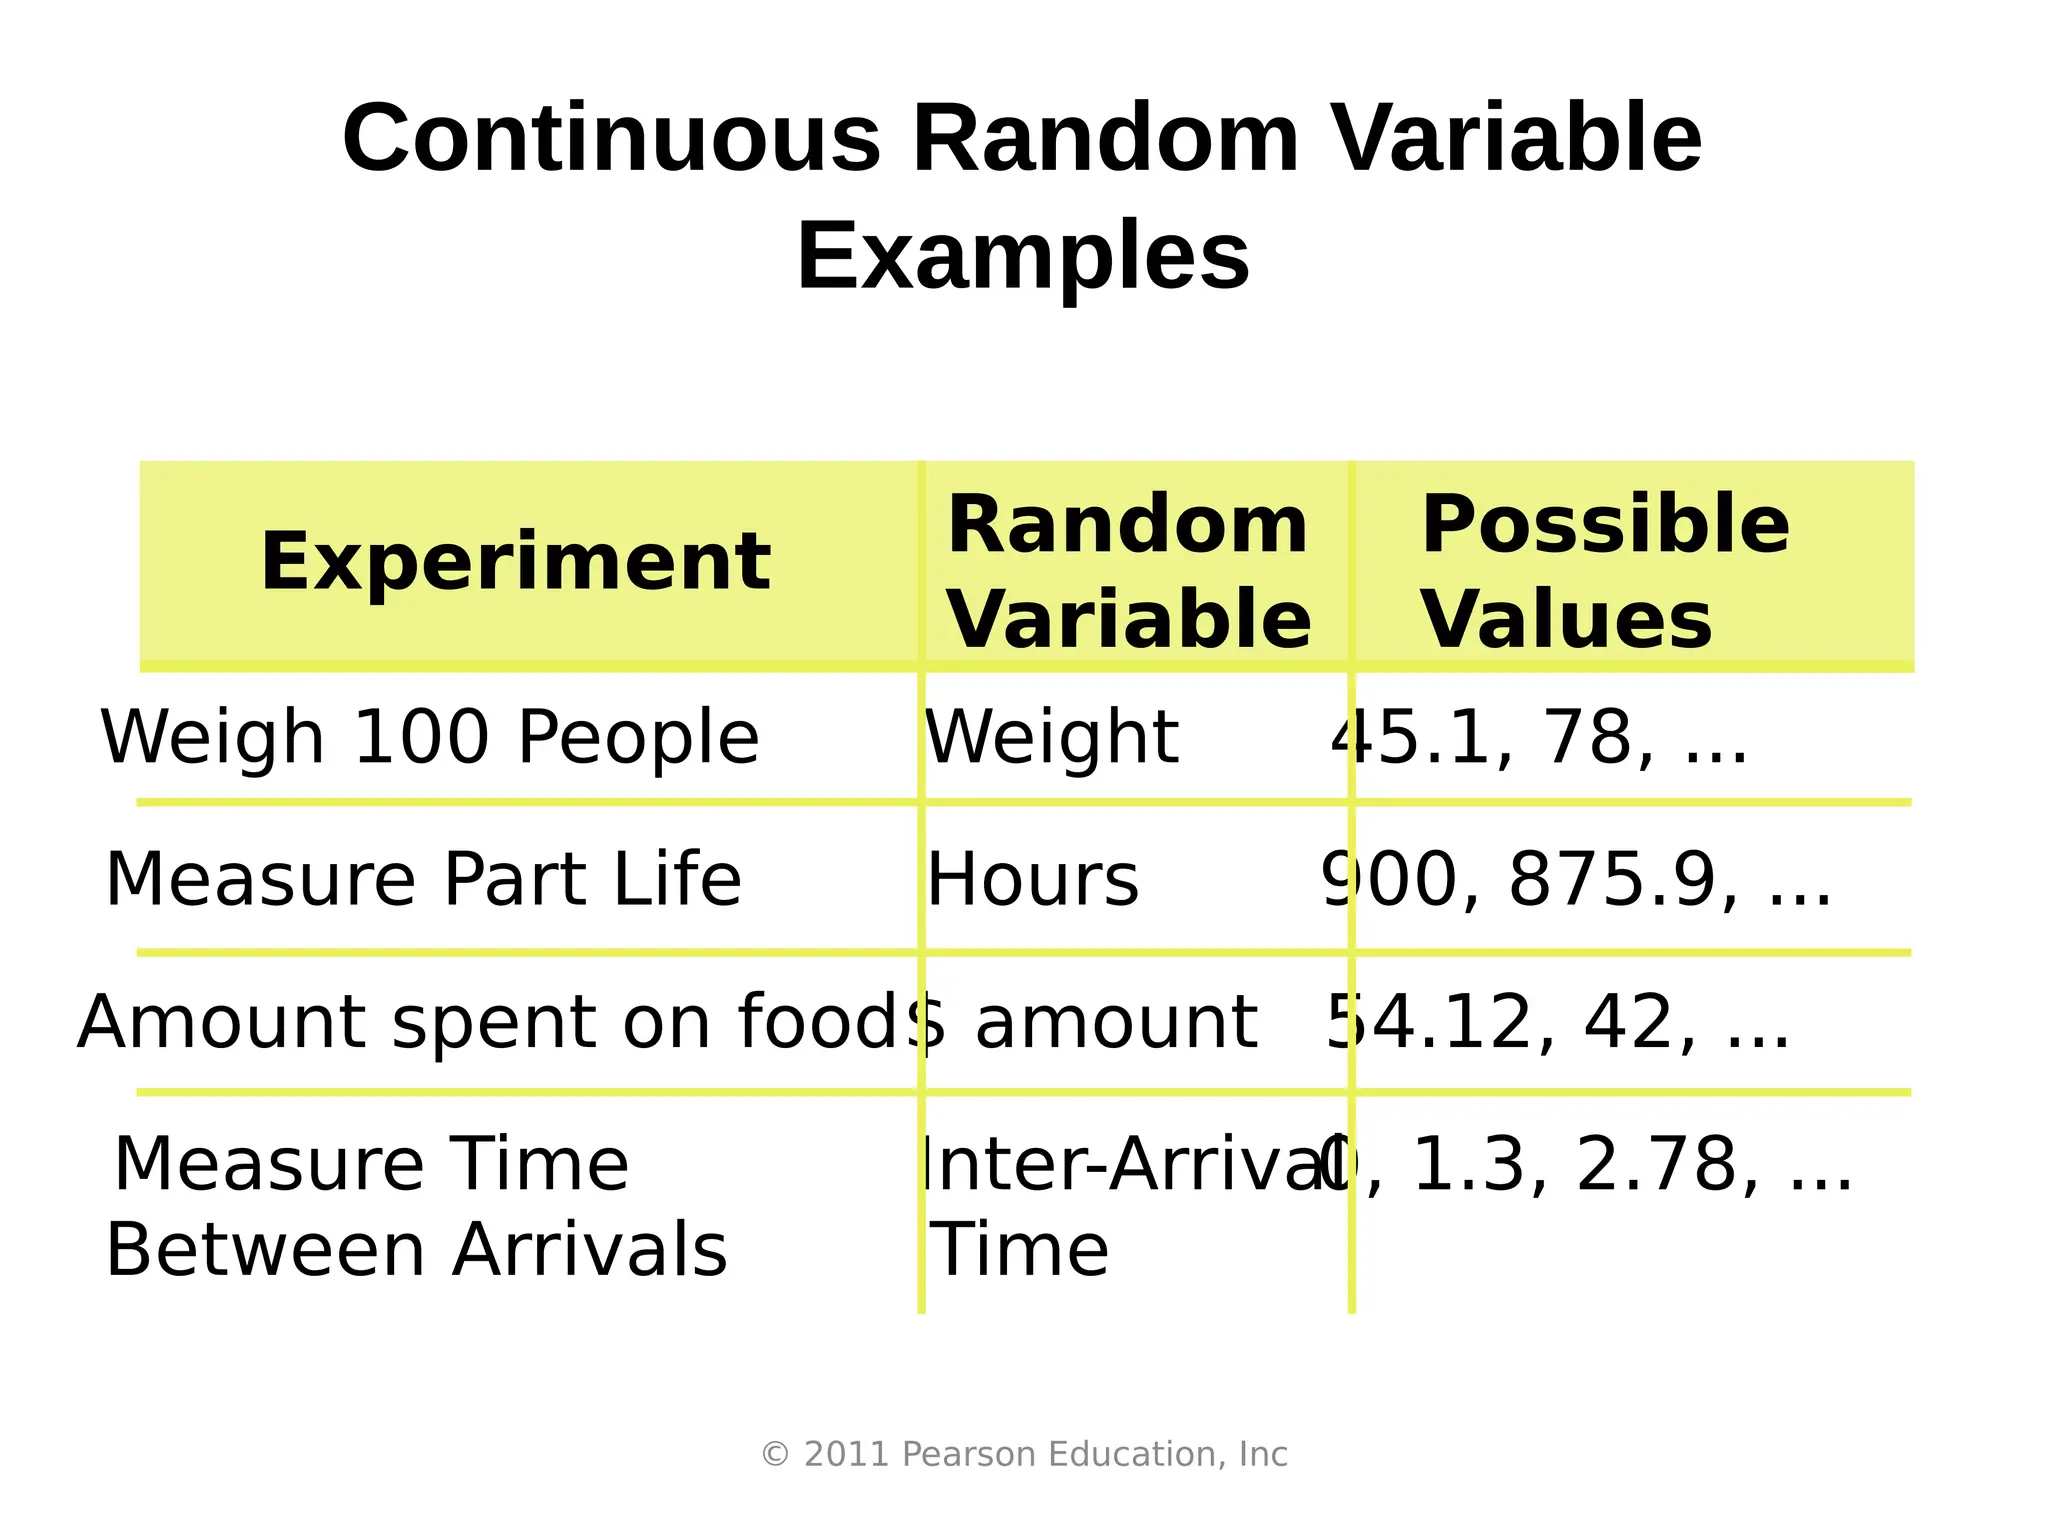
This document introduces the concept of a random variable through examples and definitions. It explains that a random variable is a quantity whose value is determined by the outcome of a random phenomenon. Random variables can be either discrete or continuous, and their possible values are determined by the sample space of the random experiment. The document provides examples of defining and finding the possible values of random variables based on coin tosses, ball drawings from an urn, and other random experiments.
This document discusses different types of variables that can be studied in research. It defines a variable as a measurable characteristic that can change or vary. Variables are categorized as either continuous or discrete. Discrete variables can only take on distinct, countable values and include nominal and ordinal variables. Continuous variables can assume any value within a given range and include interval and ratio variables. Examples of each type of variable are provided.
Random Variables Probability Distribution and its properties Stats anf Probab...ziarraagbayani
This document discusses random variables and their properties. It defines a random variable as a set whose elements are numbers assigned to outcomes of an experiment. Random variables can be discrete or continuous. Discrete random variables represent count data and take on countable values, while continuous random variables represent measured data and take on values along a continuous scale. Examples of each type are provided to illustrate the difference. The document also discusses identifying random variables and their possible values from descriptions.
This document discusses different types of measurement variables. It begins by defining measurement variables as unknown attributes that can take quantitative or qualitative values. It then describes the four main types of measurement variables: nominal, ordinal, interval, and ratio. For each type, it provides examples and characteristics. Nominal variables categorize data without order, ordinal variables rank data, interval variables use equal distances on a scale, and ratio variables have a true zero point.
This document contains a summary of key concepts in statistics:
- Statistics involves collecting and analyzing data to make inferences about populations. It has two broad areas: descriptive statistics which organizes data, and inferential statistics which makes conclusions about populations based on samples.
- Variables can be either qualitative (represent categories) or quantitative (represent numerical amounts). Examples of each are given.
- Random variables assign numerical values to outcomes of experiments. They can be either discrete (countable outcomes) or continuous (measured on a scale). Examples of each are provided.
This document discusses discrete and continuous random variables. It defines a random variable as a numerical value that describes the outcomes of a chance process. Discrete random variables can be counted, like the number of coins in your pocket, while continuous variables cannot be counted and take on any value within a range, like age which can have fractional values. The document provides examples of discrete variables like the number of books owned and continuous variables like temperature. It concludes that a variable is discrete if it can be counted, and continuous if it can take any value between two points.
Monte Carlo simulation is a numerical method used to model probabilistic outcomes in complex systems. It works by simulating random variables many times according to a probability distribution. This allows estimating statistics like expected values. In finance, it is commonly used to price exotic options by simulating the behavior of the underlying asset over time and calculating the option payoff. The method proceeds in stages: defining distributions, simulating variables, repeating to increase accuracy. It is flexible but computationally intensive.
Statistics involves collecting, describing, and analyzing data. There are two main areas: descriptive statistics which describes sample data, and inferential statistics which draws conclusions about populations from samples. A population is the entire set being studied, while a sample is a subset of the population. Variables are characteristics being measured, and can be either qualitative (categorical) or quantitative (numerical). Data is collected through experiments or surveys using sampling methods to obtain a representative sample from the population. There is usually variability in data that statistics aims to measure and characterize.
The document discusses various methods of measuring risk and volatility in investments. It defines key terms like return, risk, standard deviation and volatility. It then explains different models used to measure volatility like EWMA, ARCH, GARCH and VaR. For EWMA, it provides the formula and explains how it is used to estimate volatility. For ARCH and GARCH models, it describes the concepts and formulas for ARCH(1), GARCH(1,1) and how they model conditional heteroskedasticity. Finally, it explains the variance-covariance and Monte Carlo methods to calculate Value at Risk (VaR).
This document discusses random variables and probability distributions. It begins by introducing random variables and how they can be either discrete or continuous. Discrete random variables can take on countable values, while continuous can take on any value within an interval. Several examples of each are given, such as number of sales (discrete) and length (continuous). The document then discusses how to describe and find the probability distribution of a discrete random variable using a graph, table, or formula. It provides an example of a probability mass function and the expected values and variance of discrete random variables. Finally, it gives an example of calculating probabilities of winning or losing a bet in roulette.
This document discusses random variables and probability distributions. It begins by introducing random variables and how they can be either discrete or continuous. Discrete random variables can take on countable values, while continuous can be any value within a given interval. Several examples of each are provided like number of sales (discrete) and length (continuous). The document then discusses exploring random variables through an activity of tossing coins and calculating the number of tails. It also covers probability distributions for discrete random variables through graphs, tables, or formulas. Expected values and variance of discrete random variables are defined using summation notation.
This document discusses terminology and concepts related to measurement and error. It defines true value, accuracy, and precision. There are two types of errors - determinate (systematic) errors which have a known cause, and indeterminate (random) errors which cannot be determined. Accuracy refers to closeness to the true value while precision refers to reproducibility. The standard deviation allows for more variation in a sample compared to the population. When combining uncertainties from multiple measurements, relative uncertainties should be summed for multiplication and division, while absolute uncertainties are summed for addition and subtraction. Significant figures refer to the reliable digits in a measurement and rules govern how many are retained in calculations.
Statistics is the science of collecting, organizing, summarizing, analyzing, and interpreting data. It can be divided into descriptive statistics, which summarizes data through measures like mean, median, and standard deviation, and analytical statistics, which makes inferences about populations from samples using methods like hypothesis testing and regression analysis. Statistics is widely applied in fields such as business, health science, finance, and marketing to analyze data and make decisions.
Static characteristics in mechanical measurements & metrologyChirag Solanki
The document discusses various static characteristics involved in mechanical measurement and metrology. It defines static characteristics as those that are constant or slowly varying over time, such as static calibration, sensitivity, error, linearity, threshold, resolution, hysteresis, drift, span and range. It provides examples of measuring pressure, temperature and sensitivity. It also explains concepts such as error, types of errors, linearity, and other static characteristics.
Power Notes: Measurements and Dealing with Datajmori
This document provides instructions for a chemistry class assignment. Students are asked to bring specific supplies including a pencil, colored pencils, and stapled assignments. They must update their assignment log online and submit a stapled assignment. The document then reviews power notes on measurements and dealing with data that students must complete for homework. It instructs students to log into the classroom website to view the slideshow and take notes by paraphrasing, abbreviating, and highlighting the material, which is due the next day. Students are also told their seats will be changed for the next class.
This document provides an overview of key concepts in statistics including:
- Descriptive statistics such as frequency distributions which organize and summarize data
- Inferential statistics which make estimates or predictions about populations based on samples
- Types of variables including quantitative, qualitative, discrete and continuous
- Levels of measurement including nominal, ordinal, interval and ratio
- Common measures of central tendency (mean, median, mode) and dispersion (range, standard deviation)
This tutorial explain the measure of central tendency (Mean, Median and Mode in detail with suitable working examples pictures. The tutorial also teach the excel commands for calculation of Mean, Median and Mode.
This slide is special for master students (MIBS & MIFB) in UUM. Also useful for readers who are interested in the topic of contemporary Islamic banking.
How to Add Chatter in the odoo 17 ERP ModuleCeline George
In Odoo, the chatter is like a chat tool that helps you work together on records. You can leave notes and track things, making it easier to talk with your team and partners. Inside chatter, all communication history, activity, and changes will be displayed.
How to Fix the Import Error in the Odoo 17Celine George
An import error occurs when a program fails to import a module or library, disrupting its execution. In languages like Python, this issue arises when the specified module cannot be found or accessed, hindering the program's functionality. Resolving import errors is crucial for maintaining smooth software operation and uninterrupted development processes.
How to Make a Field Mandatory in Odoo 17Celine George
In Odoo, making a field required can be done through both Python code and XML views. When you set the required attribute to True in Python code, it makes the field required across all views where it's used. Conversely, when you set the required attribute in XML views, it makes the field required only in the context of that particular view.
A workshop hosted by the South African Journal of Science aimed at postgraduate students and early career researchers with little or no experience in writing and publishing journal articles.
বাংলাদেশের অর্থনৈতিক সমীক্ষা ২০২৪ [Bangladesh Economic Review 2024 Bangla.pdf] কম্পিউটার , ট্যাব ও স্মার্ট ফোন ভার্সন সহ সম্পূর্ণ বাংলা ই-বুক বা pdf বই " সুচিপত্র ...বুকমার্ক মেনু 🔖 ও হাইপার লিংক মেনু 📝👆 যুক্ত ..
আমাদের সবার জন্য খুব খুব গুরুত্বপূর্ণ একটি বই ..বিসিএস, ব্যাংক, ইউনিভার্সিটি ভর্তি ও যে কোন প্রতিযোগিতা মূলক পরীক্ষার জন্য এর খুব ইম্পরট্যান্ট একটি বিষয় ...তাছাড়া বাংলাদেশের সাম্প্রতিক যে কোন ডাটা বা তথ্য এই বইতে পাবেন ...
তাই একজন নাগরিক হিসাবে এই তথ্য গুলো আপনার জানা প্রয়োজন ...।
বিসিএস ও ব্যাংক এর লিখিত পরীক্ষা ...+এছাড়া মাধ্যমিক ও উচ্চমাধ্যমিকের স্টুডেন্টদের জন্য অনেক কাজে আসবে ...
Leveraging Generative AI to Drive Nonprofit InnovationTechSoup
In this webinar, participants learned how to utilize Generative AI to streamline operations and elevate member engagement. Amazon Web Service experts provided a customer specific use cases and dived into low/no-code tools that are quick and easy to deploy through Amazon Web Service (AWS.)
More Related Content
Similar to power point presentation for statistics and probability
The document discusses various methods of measuring risk and volatility in investments. It defines key terms like return, risk, standard deviation and volatility. It then explains different models used to measure volatility like EWMA, ARCH, GARCH and VaR. For EWMA, it provides the formula and explains how it is used to estimate volatility. For ARCH and GARCH models, it describes the concepts and formulas for ARCH(1), GARCH(1,1) and how they model conditional heteroskedasticity. Finally, it explains the variance-covariance and Monte Carlo methods to calculate Value at Risk (VaR).
This document discusses random variables and probability distributions. It begins by introducing random variables and how they can be either discrete or continuous. Discrete random variables can take on countable values, while continuous can take on any value within an interval. Several examples of each are given, such as number of sales (discrete) and length (continuous). The document then discusses how to describe and find the probability distribution of a discrete random variable using a graph, table, or formula. It provides an example of a probability mass function and the expected values and variance of discrete random variables. Finally, it gives an example of calculating probabilities of winning or losing a bet in roulette.
This document discusses random variables and probability distributions. It begins by introducing random variables and how they can be either discrete or continuous. Discrete random variables can take on countable values, while continuous can be any value within a given interval. Several examples of each are provided like number of sales (discrete) and length (continuous). The document then discusses exploring random variables through an activity of tossing coins and calculating the number of tails. It also covers probability distributions for discrete random variables through graphs, tables, or formulas. Expected values and variance of discrete random variables are defined using summation notation.
This document discusses terminology and concepts related to measurement and error. It defines true value, accuracy, and precision. There are two types of errors - determinate (systematic) errors which have a known cause, and indeterminate (random) errors which cannot be determined. Accuracy refers to closeness to the true value while precision refers to reproducibility. The standard deviation allows for more variation in a sample compared to the population. When combining uncertainties from multiple measurements, relative uncertainties should be summed for multiplication and division, while absolute uncertainties are summed for addition and subtraction. Significant figures refer to the reliable digits in a measurement and rules govern how many are retained in calculations.
Statistics is the science of collecting, organizing, summarizing, analyzing, and interpreting data. It can be divided into descriptive statistics, which summarizes data through measures like mean, median, and standard deviation, and analytical statistics, which makes inferences about populations from samples using methods like hypothesis testing and regression analysis. Statistics is widely applied in fields such as business, health science, finance, and marketing to analyze data and make decisions.
Static characteristics in mechanical measurements & metrologyChirag Solanki
The document discusses various static characteristics involved in mechanical measurement and metrology. It defines static characteristics as those that are constant or slowly varying over time, such as static calibration, sensitivity, error, linearity, threshold, resolution, hysteresis, drift, span and range. It provides examples of measuring pressure, temperature and sensitivity. It also explains concepts such as error, types of errors, linearity, and other static characteristics.
Power Notes: Measurements and Dealing with Datajmori
This document provides instructions for a chemistry class assignment. Students are asked to bring specific supplies including a pencil, colored pencils, and stapled assignments. They must update their assignment log online and submit a stapled assignment. The document then reviews power notes on measurements and dealing with data that students must complete for homework. It instructs students to log into the classroom website to view the slideshow and take notes by paraphrasing, abbreviating, and highlighting the material, which is due the next day. Students are also told their seats will be changed for the next class.
This document provides an overview of key concepts in statistics including:
- Descriptive statistics such as frequency distributions which organize and summarize data
- Inferential statistics which make estimates or predictions about populations based on samples
- Types of variables including quantitative, qualitative, discrete and continuous
- Levels of measurement including nominal, ordinal, interval and ratio
- Common measures of central tendency (mean, median, mode) and dispersion (range, standard deviation)
This tutorial explain the measure of central tendency (Mean, Median and Mode in detail with suitable working examples pictures. The tutorial also teach the excel commands for calculation of Mean, Median and Mode.
This slide is special for master students (MIBS & MIFB) in UUM. Also useful for readers who are interested in the topic of contemporary Islamic banking.
How to Add Chatter in the odoo 17 ERP ModuleCeline George
In Odoo, the chatter is like a chat tool that helps you work together on records. You can leave notes and track things, making it easier to talk with your team and partners. Inside chatter, all communication history, activity, and changes will be displayed.
How to Fix the Import Error in the Odoo 17Celine George
An import error occurs when a program fails to import a module or library, disrupting its execution. In languages like Python, this issue arises when the specified module cannot be found or accessed, hindering the program's functionality. Resolving import errors is crucial for maintaining smooth software operation and uninterrupted development processes.
How to Make a Field Mandatory in Odoo 17Celine George
In Odoo, making a field required can be done through both Python code and XML views. When you set the required attribute to True in Python code, it makes the field required across all views where it's used. Conversely, when you set the required attribute in XML views, it makes the field required only in the context of that particular view.
A workshop hosted by the South African Journal of Science aimed at postgraduate students and early career researchers with little or no experience in writing and publishing journal articles.
বাংলাদেশের অর্থনৈতিক সমীক্ষা ২০২৪ [Bangladesh Economic Review 2024 Bangla.pdf] কম্পিউটার , ট্যাব ও স্মার্ট ফোন ভার্সন সহ সম্পূর্ণ বাংলা ই-বুক বা pdf বই " সুচিপত্র ...বুকমার্ক মেনু 🔖 ও হাইপার লিংক মেনু 📝👆 যুক্ত ..
আমাদের সবার জন্য খুব খুব গুরুত্বপূর্ণ একটি বই ..বিসিএস, ব্যাংক, ইউনিভার্সিটি ভর্তি ও যে কোন প্রতিযোগিতা মূলক পরীক্ষার জন্য এর খুব ইম্পরট্যান্ট একটি বিষয় ...তাছাড়া বাংলাদেশের সাম্প্রতিক যে কোন ডাটা বা তথ্য এই বইতে পাবেন ...
তাই একজন নাগরিক হিসাবে এই তথ্য গুলো আপনার জানা প্রয়োজন ...।
বিসিএস ও ব্যাংক এর লিখিত পরীক্ষা ...+এছাড়া মাধ্যমিক ও উচ্চমাধ্যমিকের স্টুডেন্টদের জন্য অনেক কাজে আসবে ...
Leveraging Generative AI to Drive Nonprofit InnovationTechSoup
In this webinar, participants learned how to utilize Generative AI to streamline operations and elevate member engagement. Amazon Web Service experts provided a customer specific use cases and dived into low/no-code tools that are quick and easy to deploy through Amazon Web Service (AWS.)
Chapter wise All Notes of First year Basic Civil Engineering.pptxDenish Jangid
Chapter wise All Notes of First year Basic Civil Engineering
Syllabus
Chapter-1
Introduction to objective, scope and outcome the subject
Chapter 2
Introduction: Scope and Specialization of Civil Engineering, Role of civil Engineer in Society, Impact of infrastructural development on economy of country.
Chapter 3
Surveying: Object Principles & Types of Surveying; Site Plans, Plans & Maps; Scales & Unit of different Measurements.
Linear Measurements: Instruments used. Linear Measurement by Tape, Ranging out Survey Lines and overcoming Obstructions; Measurements on sloping ground; Tape corrections, conventional symbols. Angular Measurements: Instruments used; Introduction to Compass Surveying, Bearings and Longitude & Latitude of a Line, Introduction to total station.
Levelling: Instrument used Object of levelling, Methods of levelling in brief, and Contour maps.
Chapter 4
Buildings: Selection of site for Buildings, Layout of Building Plan, Types of buildings, Plinth area, carpet area, floor space index, Introduction to building byelaws, concept of sun light & ventilation. Components of Buildings & their functions, Basic concept of R.C.C., Introduction to types of foundation
Chapter 5
Transportation: Introduction to Transportation Engineering; Traffic and Road Safety: Types and Characteristics of Various Modes of Transportation; Various Road Traffic Signs, Causes of Accidents and Road Safety Measures.
Chapter 6
Environmental Engineering: Environmental Pollution, Environmental Acts and Regulations, Functional Concepts of Ecology, Basics of Species, Biodiversity, Ecosystem, Hydrological Cycle; Chemical Cycles: Carbon, Nitrogen & Phosphorus; Energy Flow in Ecosystems.
Water Pollution: Water Quality standards, Introduction to Treatment & Disposal of Waste Water. Reuse and Saving of Water, Rain Water Harvesting. Solid Waste Management: Classification of Solid Waste, Collection, Transportation and Disposal of Solid. Recycling of Solid Waste: Energy Recovery, Sanitary Landfill, On-Site Sanitation. Air & Noise Pollution: Primary and Secondary air pollutants, Harmful effects of Air Pollution, Control of Air Pollution. . Noise Pollution Harmful Effects of noise pollution, control of noise pollution, Global warming & Climate Change, Ozone depletion, Greenhouse effect
Text Books:
1. Palancharmy, Basic Civil Engineering, McGraw Hill publishers.
2. Satheesh Gopi, Basic Civil Engineering, Pearson Publishers.
3. Ketki Rangwala Dalal, Essentials of Civil Engineering, Charotar Publishing House.
4. BCP, Surveying volume 1
it describes the bony anatomy including the femoral head , acetabulum, labrum . also discusses the capsule , ligaments . muscle that act on the hip joint and the range of motion are outlined. factors affecting hip joint stability and weight transmission through the joint are summarized.
This presentation includes basic of PCOS their pathology and treatment and also Ayurveda correlation of PCOS and Ayurvedic line of treatment mentioned in classics.
How to Manage Your Lost Opportunities in Odoo 17 CRMCeline George
Odoo 17 CRM allows us to track why we lose sales opportunities with "Lost Reasons." This helps analyze our sales process and identify areas for improvement. Here's how to configure lost reasons in Odoo 17 CRM
How to Build a Module in Odoo 17 Using the Scaffold MethodCeline George
Odoo provides an option for creating a module by using a single line command. By using this command the user can make a whole structure of a module. It is very easy for a beginner to make a module. There is no need to make each file manually. This slide will show how to create a module using the scaffold method.
Main Java[All of the Base Concepts}.docxadhitya5119
This is part 1 of my Java Learning Journey. This Contains Custom methods, classes, constructors, packages, multithreading , try- catch block, finally block and more.
2. COURSE DESCRIPTION
At the end of the course, the
students must know how to find
the mean and variance of a
random variable, to apply sampling
techniques and distributions,
to estimate population mean and
proportion, to perform hypothesis
testing on population mean and
proportion, and to perform
correlation and regression
5. A. VARIABLES
A variable is a
characteristic or
condition that can
change or take on
different values.
6. RANDOM
VARIABLES
1. Random Variable (RV): A
numeric outcome that
results from an experiment
2. For each element of an
experiment’s sample space,
the random variable can
take on exactly one value
7. RANDOM
VARIABLES
3. Random Variables are
denoted by upper case
letters (Y)
4. A random variable assumes
numerical values associated
with the random outcome of an
8. TYPES OF RANDOM
VARIABLES
1. A discrete random
variable can assume a
countable number of values.
Number of steps to the top of the
Eiffel Tower
9. Discrete variables are
countable in a finite amount of
time. For example, you can
count the change in your
pocket. You can count the
money in your bank account.
You could also count the
amount of money
in everyone’s bank account. It
might take you a long time to
count that last item, but the
10. Discrete Random Variables
Number of sales
Number of calls
Shares of stock
People in line
Mistakes per page
Variables that can only
take on a finite number of
values
12. TYPES OF RANDOM
VARIABLES
2. A continuous random
variable can assume any value
along a given interval of a number
line.
The time a tourist stays at the top
once he gets there
16. 1. The number of goods
sold in a retail store
2. Volume of gasoline
consumed by an
automatic car
3. Names listed in a voting
center
4. Outcomes when tossing
a coin
17. 6. Diastolic blood pressure
7. Thickness of a book
8. Intensity of earthquake
9. The components of
vectors
10. Color of hair
18. Activity 3.1 – A
Identify if the given
information/condition is a
Continuous or Discrete
Variable
19. 1. Amount of sugar intake
in a day
2. Number of SUV along
EDSA during rush hour
3. Number of students
present during the
Christmas Party
celebration
4. Average height of Grade
20. 5. The number of home
runs in a baseball game
6. Final score in a Quarterly
Assessment
7. Distance in meters of JHS
and SHS buildings.
21. 8. Gender of a new born
baby
9. Body temperature
10. Speed of a motorcycle