
Recommended
Recommended
More Related Content
What's hot
What's hot (19)
Similar to Power Plant Remaining Life Assessment Case Study – Crimson Publishers
Similar to Power Plant Remaining Life Assessment Case Study – Crimson Publishers (20)
More from CrimsonPublishersRDMS
More from CrimsonPublishersRDMS (20)
Recently uploaded
Recently uploaded (20)
Power Plant Remaining Life Assessment Case Study – Crimson Publishers
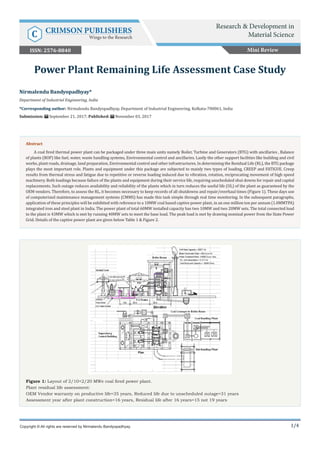
- 1. 1/4 Figure 1: Layout of 2/10+2/20 MWe coal fired power plant. Plant residual life assessment: OEM Vendor warranty on productive life=35 years, Reduced life due to unscheduled outage=31 years Assessment year after plant construction=16 years, Residual life after 16 years=15 not 19 years Nirmalendu Bandyopadhyay* Department of Industrial Engineering, India *Corresponding author: Nirmalendu Bandyopadhyay, Department of Industrial Engineering, Kolkata-700061, India Submission: September 21, 2017; Published: November 03, 2017 Power Plant Remaining Life Assessment Case Study Copyright © All rights are reserved by Nirmalendu Bandyopadhyay. Abstract A coal fired thermal power plant can be packaged under three main units namely Boiler, Turbine and Generators (BTG) with ancillaries , Balance of plants (BOP) like fuel, water, waste handling systems, Environmental control and ancillaries. Lastly the other support facilities like building and civil works, plant roads, drainage, land preparation, Environmental control and other infrastructures. In determining the Residual Life (RL), the BTG package plays the most important role. Plants and equipment under this package are subjected to mainly two types of loading, CREEP and FATIGUE. Creep results from thermal stress and fatigue due to repetitive or reverse loading induced due to vibration, rotation, reciprocating movement of high speed machinery. Both loadings because failure of the plants and equipment during their service life, requiring unscheduled shut downs for repair and capital replacements. Such outage reduces availability and reliability of the plants which in turn reduces the useful life (UL) of the plant as guaranteed by the OEM vendors. Therefore, to assess the RL, it becomes necessary to keep records of all shutdowns and repair/overhaul times (Figure 1). These days use of computerized maintenance management systems (CMMS) has made this task simple through real time monitoring. In the subsequent paragraphs, application of these principles will be exhibited with reference to a 10MW coal based captive power plant, in an one million ton per annum (1.0MMTPA) integrated iron and steel plant in India. The power plant of total 60MW installed capacity has two 10MW and two 20MW sets. The total connected load to the plant is 43MW which is met by running 40MW sets to meet the base load. The peak load is met by drawing nominal power from the State Power Grid. Details of the captive power plant are given below Table 1 & Figure 2. Mini Review Research & Development in Material ScienceC CRIMSON PUBLISHERS Wings to the Research ISSN: 2576-8840
- 2. How to cite this article: Nirmalendu B. Power Plant Remaining Life Assessment Case Study. Res Dev Material Sci. 1(5). RDMS.000523. 2017. DOI: 10.31031/RDMS.2017.01.000523 Research & Development in Material Science 2/4 Res Dev Material Sci Table 1: Unit No 1 2 3 4 Installed (Year) 1939 1939 1949 1949 Turbine All Reaction Generator (MW) 10 10 20 20 Volts (KV) 11 11 11 11 Frequency (Hz) 50 50 50 50 Power factor(cos ø) 0.75 0.75 0.73 0.73 Steam consumption (Kg/Kwh) 5.4 5.4 5.4 5.4 Figure 2 Assessment of Residual Life (RL) of the 10MW Units The units were set up and commissioned in the year 1939. The Productive Life Cycle or Useful Life (UL) of the units was given by the OEM vendor as 35 years subject to regular maintenance, annual overhaul and capital replacement programs as specified in his manual, being done by the plant management and maintenance team. The first assessment was done in the year 1955 or 16 years after it was commissioned. The record of its performance is exhibited below Table 2. Plant productive life (UL) during that year=1 year x0.94x0.94 0.88 years=323 days Assuming similar performance in subsequent years, the OEM warranty 35 years gets reduced to 35x0.88=31.0 years. Therefore, from the 16th year the residual Life (RL) of the plant becomes 15 years not 35-16=19 years. However, during the subsequent years, the mandatory shutdown could be reduced to 16 days increasing plant availability to 96%. Similarly, the meantime between two shutdowns increased to 176 days and average time to repair reduced to 8 days, thereby increasing plant reliability to 96%. This type of performance can be repeated and the UL of the plant increases to 365x0.96x0.96=336 days from 323 days per year or by 0.92 years /year. So the revised UL of the plant becomes 35x0.92=32 years. In other words, the RL becomes 32-16=16 years in place of 13 years.
- 3. How to cite this article: Nirmalendu B. Power Plant Remaining Life Assessment Case Study. Res Dev Material Sci. 1(5). RDMS.000523. 2017. DOI: 10.31031/RDMS.2017.01.000523 3/4 Res Dev Material SciResearch & Development in Material Science Table 2: Package BTG Plant mandatory shutdown in days/months(d/m) under OEM 21d/0.7m Plant reliability=344d/1.1m=94% Average meantime between two shutdowns 172d/5.7m Average time to repair/restart 11d/0.4m Plant reliability=172/183x100=94% Now let us consider unscheduled plant shutdowns due to equipment failure. In that particular year, there were 4 such shutdowns of 33 days or 1.1m and average meantime between two subsequent failures was 365–33/4=83 days. Average meantime to repair/ restart was 33/4=8.3 days. So, plant availability due to these unscheduled shutdowns was 332/365x100=91% and plant reliability goes down to 83/91.3x100=91%. So on this account the plant UL gets reduced to 1 yearx0.91x0.91=0.83 years=302 days. Assuming similar incidence in the subsequent years, the UL of the plant reduces to 35x0.83=29 years. Therefore, from the sixteenth year, the RL of the plant gets reduced to 29-16=13 years not 35-16=19 years. In similar manners, the RL of the BOP and Other Support Packages to be determined from plant operational database. Since BTG package is most critical and keeps the plant generating, the RL of this package shall be the RL of the whole plant even if the RL of the other packages are higher. For example, the RL of BOP should be higher due to storage facilities in its fuel and water systems. Thus breakdown of a conveyor in the coal handling plant or a pump in the water supply may make the availability and reliability high due to the presence of few days’ storage and thus redundancy. A Bar Chart Representation of the Plant RL shown below Figure 3. Analysis of Reasons for Reduced Performance of Critical BTG Package A review of the forced shutdown records show that out of 33, 4 have been due to overheating of the boiler drums. Previous measurement of the drum shell plate thickness showed reduced thickness of the plates due to abrasion of floating coal dust and ash which is due to insufficient combustion. The boilers were fired by sized coal travelling on stokers. So, inadequate combustion may be due to faster movement of the stoker and insufficient supply of air which was supplemented by LSHS oil firing. Both these were controlled and during the subsequent campaigns, the shut down due to overheating got reduced from nil to max 3 days. Out of 33 days 12 days were due to water tube and accessory leakage Outage due to malfunctioning of the turbine, resulting from excessive vibration, unbalanced rotor, blade angle distortion and excessive heating of the rotor shaft bearings. All these were corrected and the outage got reduced from 16 days to 4 days in the subsequent year. This improved the availability and reliability. Conclusions and Lessons Learned The useful service life of the plant can be bought at the OEM vendor level by reducing the accidental shutdowns from 33 days Figure 3: Plant and equipment performance during fill life cycle to assess residual lives. Designed service life of plant & equipment=35 years= 420 months.
- 4. How to cite this article: Nirmalendu B. Power Plant Remaining Life Assessment Case Study. Res Dev Material Sci. 1(5). RDMS.000523. 2017. DOI: 10.31031/RDMS.2017.01.000523 Research & Development in Material Science 4/4 Res Dev Material Sci per year to 21 days. By analyzing the other packages, it is possible to achieve this objective. When this is done, the useful productive life of the plant can be restored to 35 years, thus increasing the RL from any assessment year. By such assessment periodically, it is possible to identify the major areas where the plant management has to sanction capital replacement expenditures to keep the plant in healthy conditions and even enhance its useful productive life. Financial evaluation will show that handsome return on investments can be received through enhanced productive life of the plant Figure 4. Figure 4: Plant and equipment performance during full life cycle to assess residual lives. Designed service life of plant & equipment=30 years=360 months.