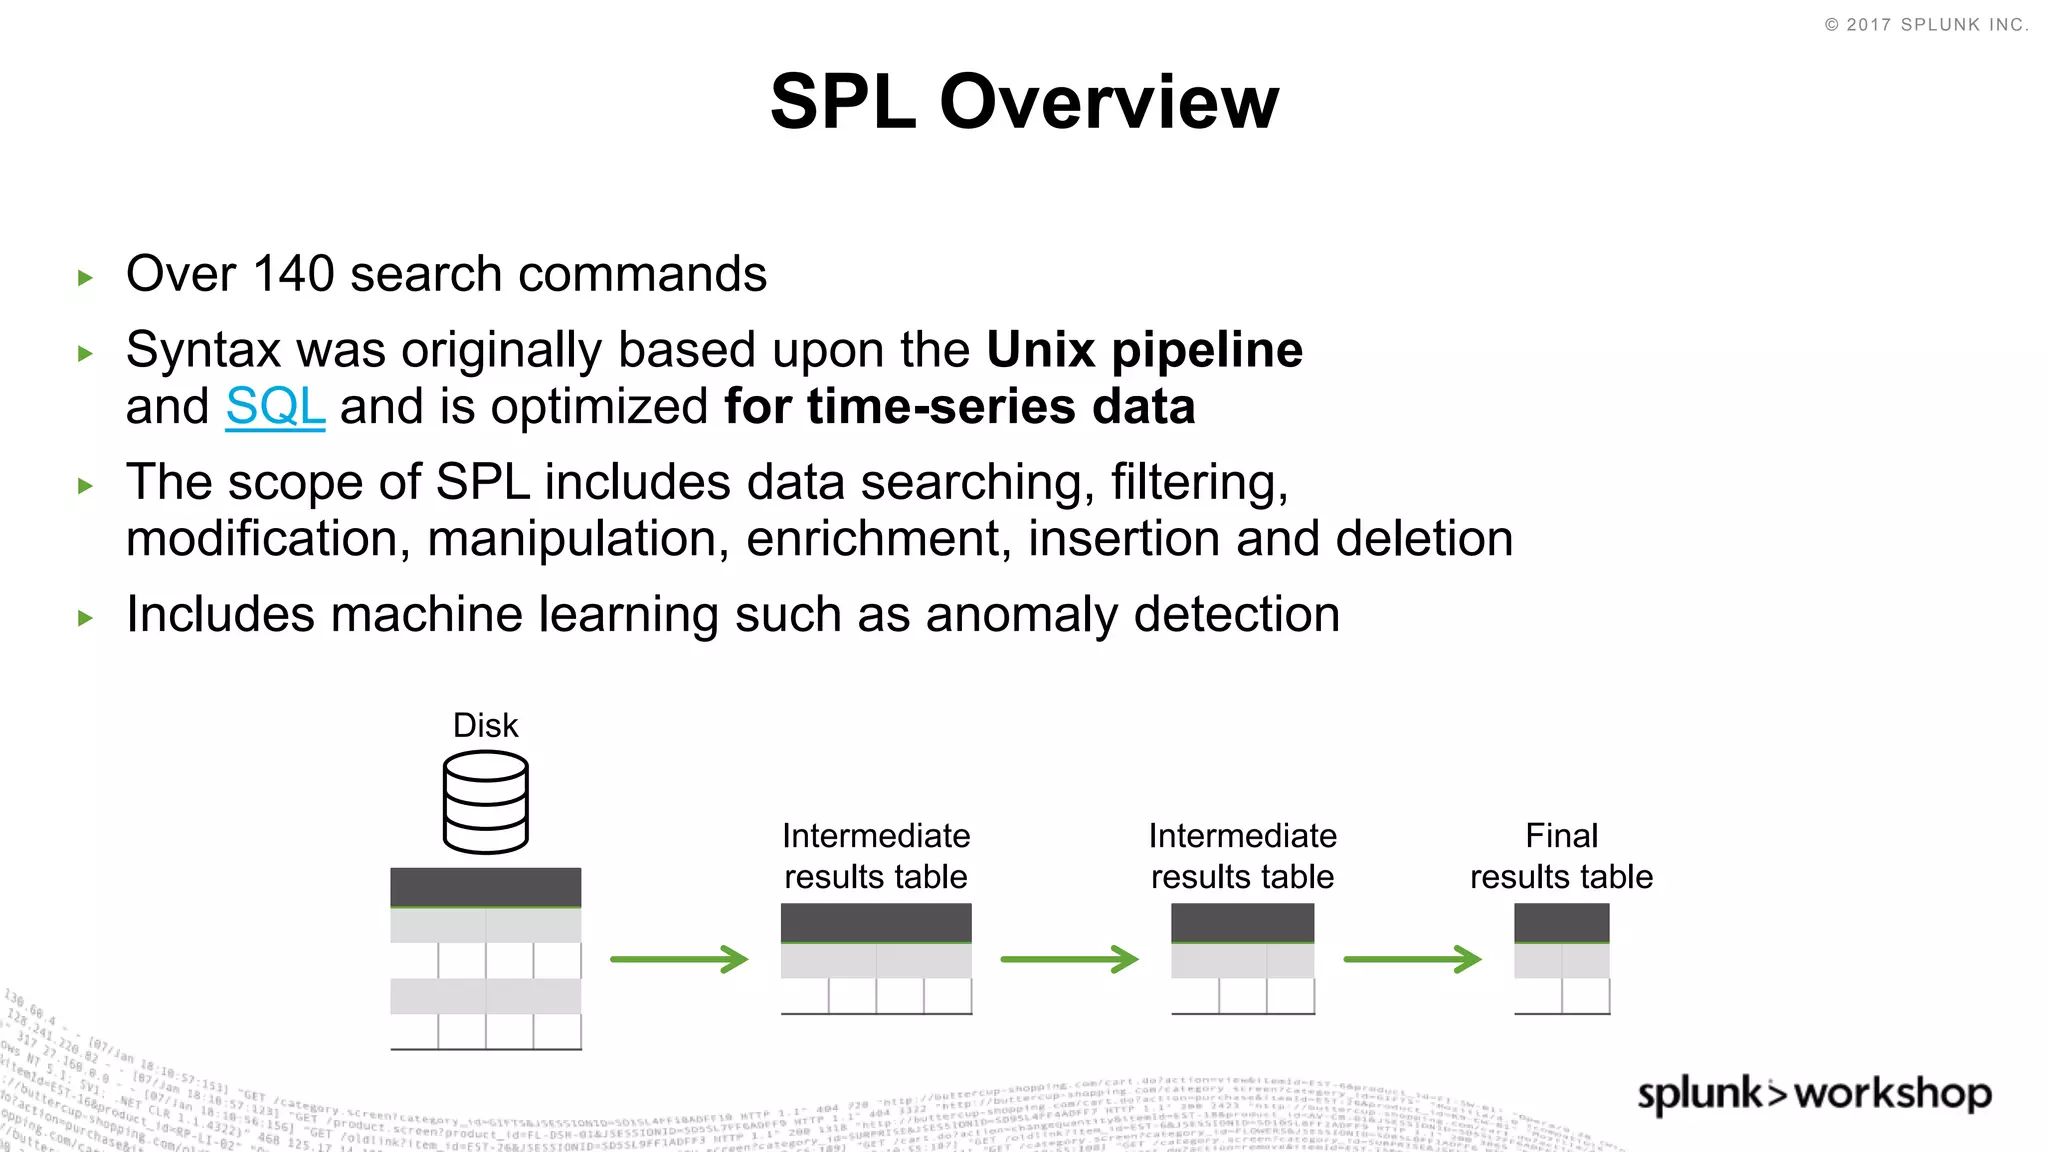
The document discusses Splunk's Search Processing Language (SPL) and provides examples of how to use SPL commands. It covers SPL's over 140 search commands for data searching, filtering, manipulation and more. The presentation agenda includes an overview of SPL, examples of SPL commands for searching, charting, converging data sources, identifying anomalies, and custom visualizations. It also discusses using SPL with Splunk's Machine Learning Toolkit.
The document provides an overview and agenda for a presentation on Search Processing Language (SPL) that will cover:
1. Installation and setup of the required software which is estimated to take 15 minutes.
2. A walkthrough of the power of SPL which will take around 1 hour and 30 minutes and cover SPL commands, examples for searching, charting, converging data, mapping, transactions, anomalies, exploring data, and custom visualizations.
3. A section on custom visualizations estimated to take 30 minutes.
4. A section on SPL and the machine learning toolkit estimated to take 45 minutes.
Who should attend? Splunk Admin-Intermediate ITOA user-intermediate Security user-intermediate
Description: Join this workshop session to harness power of the Splunk Search Processing Language (SPL). In this hands-on workshop, you'll learn how to use Splunk's simple search language for searching and filtering through data, charting statistics and predicting values, converging data sources and grouping transactions, and finally data science and exploration. We'll begin with basic search commands and build up to more powerful advanced tactics to help you harness your SplunkFu!
You’ll need to install Splunk Enterprise to participate, so don't forget to download Splunk Enterprise (https://www.splunk.com/download) and don’t forget to bring your laptop and follow along for a hands-on experience.
This document provides an overview and agenda for a Splunk Machine Data Workshop 101 session on data enrichment techniques in Splunk including tags, field aliases, calculated fields, and lookups. It discusses how these features add context and meaning to raw machine data by labeling, normalizing, and augmenting data. Examples are given of creating and applying each enrichment method and searching events with the enriched fields.
Splunk's Search Processing Language (SPL) allows users to search, filter, modify, manipulate, enrich, and visualize machine data. SPL includes over 140 search commands for tasks like searching, filtering, modifying fields, calculating statistics, charting data over time, and identifying anomalies. During the presentation, the speaker will provide examples and demonstrations of using SPL commands to perform common search, analytics, and visualization tasks.
This presentation introduces Splunk IT Service Intelligence (ITSI). It provides an overview of key concepts in ITSI including what a service is, what key performance indicators (KPIs) are, and how service health scores are calculated. The presentation demonstrates how to set up ITSI by configuring a database service, creating a new KPI to monitor network utilization, and cloning an executive glass table to showcase monitored services. The presentation shows how ITSI can be used to gain visibility into business processes and IT operations through real-time monitoring and analytics.
This document provides an agenda and overview for a presentation on service intelligence and Splunk IT Service Intelligence (ITSI). The presentation will cover Splundamentals of IT troubleshooting with Splunk, introduce service intelligence and ITSI, demonstrate how to set up and use ITSI, review service intelligence design practices, include hands-on exercises for troubleshooting and advanced features, and discuss next steps. Attendees will learn how to build on existing Splunk usage, understand key concepts of ITSI like services and KPIs, and see the potential of service intelligence for improving IT operations, business processes, and executive leadership.
Reactive to Proactive: Intelligent Troubleshooting and Monitoring with SplunkSplunk
This document discusses how Splunk IT Service Intelligence (ITSI) provides a new approach to IT operations that focuses on services rather than individual components. ITSI uses machine learning-powered analytics to deliver insights into service health, prioritize incidents, simplify operations, and unify monitoring across silos. Key concepts discussed include defining services, key performance indicators (KPIs) used to monitor services, and service health scores. Capabilities of ITSI include service analyzers, glass table dashboards, deep dives, multi-KPI alerts, and notable events. A difference highlighted is that ITSI defines KPIs through search-based definitions that are easy to write and change.
Splunk Data Onboarding Overview - Splunk Data Collection ArchitectureSplunk
Splunk's Naman Joshi and Jon Harris presented the Splunk Data Onboarding overview at SplunkLive! Sydney. This presentation covers:
1. Splunk Data Collection Architecture 2. Apps and Technology Add-ons
3. Demos / Examples
4. Best Practices
5. Resources and Q&A
The document is a presentation about the Power of Splunk Search Processing Language (SPL). It provides an overview of SPL, including that it has over 140 search commands and was originally based on Unix pipelines and SQL. It then discusses examples of using SPL for tasks like finding specific events, charting statistics, enriching data sources, mapping geographic data, identifying anomalies, and data exploration. The presentation also covers creating custom visualizations in Splunk and using the Machine Learning Toolkit with SPL.
Reactive to Proactive: Intelligent Troubleshooting and Monitoring with SplunkSplunk
This document provides an overview of Splunk IT Service Intelligence (ITSI), a machine learning-powered solution from Splunk for monitoring IT services and gaining operational insights. ITSI allows organizations to define IT services and associated key performance indicators (KPIs) to simplify operations and prioritize incidents. It features capabilities like service analyzers, glass table dashboards, and alerts on multi-KPI degradations. The document highlights how ITSI differs from traditional monitoring through its use of search-based and adaptable KPIs and service health scores to provide full-fidelity insights across an organization's universal machine data platform.
Splunk is a time-series data platform that handles the three V's of data (volume, velocity, and variety) very well. It collects, indexes, and allows searching and analysis of data. Splunk can collect data from files, directories, network ports, programs/scripts, and databases. It breaks data down into searchable events and builds a high-performance index. This allows users to search, manipulate, and visualize data in reports, charts, and dashboards. Splunk can analyze structured, unstructured, and multistructured data from various sources like logs, networks, clicks, and more.
Machine-generated data is one of the fastest growing and complex areas of big data. It's also one of the most valuable, containing some of the most important insights: where things went wrong, how to optimize the customer experience, the fingerprints of fraud. Join us as we explore the basics of machine data analysis and highlight techniques to help you turn your organization’s machine data into valuable insights—across IT and the business. This introductory workshop includes a hands-on (bring your laptop) demonstration of Splunk’s technology and covers use cases both inside and outside IT. Learn why more than 13,000 customers in over 110 countries use Splunk to make their organizations more efficient, secure, and profitable.
This presentation provides an overview of Splunk's IT Service Intelligence (ITSI) product. It discusses key concepts in ITSI including what a service is, what key performance indicators (KPIs) are, and how service health scores are calculated. The presentation demonstrates how to set up ITSI by configuring a sample database service, creating a new KPI to monitor network utilization, and cloning an existing dashboard to showcase monitored services. The goal is to introduce participants to ITSI's capabilities for monitoring IT services and components through interactive demos.
Splunk Discovery Indianapolis - October 10, 2017Splunk
This document outlines an agenda for a Splunk Discovery Day event being held in Indianapolis on October 10, 2017. The agenda includes sessions on Machine Data 101, delivering new visibility and analytics for IT operations, and strengthening security posture. It lists Daryl Diebold as the sales manager welcoming over 170 attendees. It also provides information on a sponsor, presentations, lunch, breaks and a happy hour.
This document provides an agenda for a Splunk Discovery Day event being held in Milwaukee on September 14, 2017. The agenda includes sessions on Machine Data 101, delivering new visibility and analytics for IT operations, and strengthening security posture. It notes there will be over 100 attendees, 3 sessions, and a happy hour. Breaks and a closing are also included. [/SUMMARY]
SplunkLive! London 2017 - Splunk Enterprise for IT TroubleshootingSplunk
If you’re just getting started with Splunk, this session will help you understand how to use Splunk software to turn your silos of data into insights that are actionable. In this session, we’ll dive right into a Splunk environment and show you how to use the simple Splunk search interface to quickly find the needle-in-the-haystack or multiple needles in multiple haystacks. We’ll demonstrate how to perform rapid ad hoc searches to conduct routine investigations across your entire IT infrastructure in one place, whether physical, virtual or in the cloud. We’ll show you how to then convert these searches into real-time alerts and dashboards, so you can proactively monitor for problems before they impact your end user. We’ll also demonstrate how you can use Splunk to connect the dots across heterogeneous systems in your environment for cross-tier, cross-silo visibility. Don’t forget to bring your laptop and install Spunk Enterprise before you join us.
SplunkLive! Zurich 2017 - Data Obfuscation in Splunk EnterpriseSplunk
This presentation discusses best practices for data obfuscation in Splunk Enterprise. It covers different techniques for anonymizing and pseudonymizing data at various stages, including at indexing time using transforms, at the application layer, and through event duplication. The presentation also discusses role-based user access controls and ways to secure data in transit and at rest, such as encryption. Various trade-offs of each technique are outlined. Finally, a demo scenario is presented applying encryption with a modular input and anonymization with a SEDCMD to a sample log file.
Join this workshop session to harness power of the Splunk Search Processing Language (SPL). In this hands-on workshop, you'll learn how to use Splunk's simple search language for searching and filtering through data, charting statistics and predicting values, converging data sources and grouping transactions, and finally data science and exploration. We'll begin with basic search commands and build up to more powerful advanced tactics to help you harness your SplunkFu!
You’ll need to install Splunk Enterprise to participate, so don't forget to download Splunk Enterprise (https://www.splunk.com/download) and don’t forget to bring your laptop and follow along for a hands-on experience.
The Hitchhiker's Guide to Service IntelligenceSplunk
Providing transformational impact and insight into key business services while maintaining operational oversight is often difficult in organizations. To effectively communicate business value and alignment organizations must find new methods to bridge the gap between business and operations. This half-day hands-on workshop demonstrates how customers can quickly gain insight into high-value services while aligning business and IT Operations using Splunk’s IT Service Intelligence solution. By leveraging the machine data you are already collecting the exercise provides a transformational method to model high-value services and rapidly build custom visualizations and dashboards. From executive leaders to administrators these personalized service-centric views provide powerful analytics and machine learning to transform service intelligence across your organization.
SplunkLive! Zurich 2017 - Getting Started with Splunk EnterpriseSplunk
Here’s your chance to get hands-on with Splunk for the first time! Bring your modern Mac, Windows, or Linux laptop and we’ll go through a simple install of Splunk. Then, we’ll load some sample data, and see Splunk in action – we’ll cover searching, pivot, reporting, alerting, and dashboard creation. At the end of this session you’ll have a hands-on understanding of the pieces that make up the Splunk Platform, how it works, and how it fits in the landscape of Big Data. You’ll experience practical examples that differentiate Splunk while demonstrating how to gain quick time to value.
The Hitchhiker's Guide to Service Intelligence WorkshopSplunk
The document provides an agenda and overview for a presentation on service intelligence and Splunk IT Service Intelligence (ITSI). The presentation will cover Splunk fundamentals for IT troubleshooting, what service intelligence and ITSI are, demonstrations of setting up ITSI and troubleshooting exercises, service intelligence design practices, and next steps. It includes instructions for accessing the ITSI sandbox for the hands-on demos and exercises.
SplunkLive! Zurich 2017 - Splunk Add-ons and AlertsSplunk
The document discusses Splunk add-ons and custom alert actions. It describes Splunk add-ons as technical extensions that can contain configurations, scripts, data inputs and field extractions. It also notes that the Splunk Add-on Builder allows users to create and test technical add-ons through a UI workflow. Custom alert actions are described as modules that extend alerts to customize actions and interface with third party systems. The presentation includes demos of the Splunk Add-on Builder and custom alert actions.
Machine-generated data is one of the fastest growing and complex areas of big data. It's also one of the most valuable, containing a definitive record of all user transactions, customer behavior, machine behavior, security threats, fraudulent activity and more. Join us as we explore the basics of machine data analysis and highlight techniques to help you turn your organization’s machine data into valuable insights. This introductory workshop includes a hands-on(bring your laptop) demonstration of Splunk’s technology and covers use cases both inside and outside IT. Learn why more than 12,000 customers in over 110 countries use Splunk to make business, government, and education more efficient, secure, and profitable.
Analytics-Driven Security - How to Start and Continue the JourneySplunk
Regardless of how experienced you are when it comes to SIEM, you should constantly be looking for new security use cases and insights to maintain high levels of protection in your environment. However, the landscape is changing so quickly that this needs to be supported with an analytics-driven approach to ensure you are ahead of adversaries and are prioritizing the right threats. At the moment, you might be following best-practice frameworks, such as CIS20, or implementing the kill-chain model.
This webinar will run through one of the recent analytics stories published by the Splunk Security Research team that map to these processes, providing you with insights on how to continue your analytics security journey through the “Brand Monitoring” Story and related searches. This will demonstrate how you can customize your environment to detect attempts to fool employees or customers into interacting with malicious infrastructure.
Watch our webinar to learn :
- What Analytic Stories are and what they look like
- How you can begin adopting Analytic Stories in your environment
- What tactics and techniques adversaries use when attempting to abuse your brand
- How you can implement and customize the brand-monitoring analytic story in your environment
- How you can further operationalize the Analytic Stories with Splunk Enterprise Security
View the recording here: https://www.splunk.com/en_us/form/analytics-driven-security.html
Reactive to Proactive: Intelligent Troubleshooting and Monitoring with SplunkSplunk
ITOA user-beginner Splunk Admin-new to Splunk
Description: If you’re just getting started with Splunk, this session will help you understand how to use Splunk software to turn your silos of data into insights that are actionable. In this session, we’ll dive right into a Splunk environment and show you how to use the simple Splunk search interface to quickly find the needle-in-the-haystack or multiple needles in multiple haystacks. We’ll demonstrate how to perform rapid ad hoc searches to conduct routine investigations across your entire IT infrastructure in one place, whether physical, virtual or in the cloud. We’ll show you how to then convert these searches into real-time alerts and dashboards, so you can proactively monitor for problems before they impact your end user. We’ll also demonstrate how you can use Splunk to connect the dots across heterogeneous systems in your environment for cross-tier, cross-silo visibility.
You’ll have access to a demo environment. So, don’t forget to bring your laptop and follow along for a hands-on experience.
Splunk Forum Financial Services Chicago 9/13/17Splunk
Splunk enables innovation in financial services by providing a machine data platform that:
- Allows data to be analyzed in real-time without disrupting operational systems, reducing the time spent on ETL and modeling.
- Ingests and indexes all machine data as it is created, letting users structure and correlate the data on demand for iterative analysis.
- Uses time and text/numeric strings to correlate data from different sources on demand, rather than requiring joins to be defined in advance.
- Detects anomalies and exceptions automatically through machine learning techniques, reducing the time spent on manual discovery.
This document provides an overview of the Power of Splunk presentation on Search Processing Language (SPL). It discusses SPL commands and examples for searching, charting, enriching, and analyzing machine data. The presentation covers SPL fundamentals and capabilities including searching, filtering, modifying fields, calculating statistics, visualizing data over time, and identifying anomalies. It also discusses customizing searches with additional commands.
Splunk Forum Frankfurt - 15th Nov 2017 - .conf2017 UpdateSplunk
Dirk Nitschke presented an update on .conf2017 and new Splunk products and features. Key points included:
- .conf2017 had over 7,100 attendees and 300 technical sessions.
- New security apps for fraud detection and content updates for Splunk Enterprise Security.
- Splunk IT Service Intelligence 3.0 uses AI to simplify operations and prioritize issues.
- Splunk Enterprise 7.0 integrates logs and metrics for improved monitoring, investigation, and intelligence building.
- Enhancements to Splunk Machine Learning Toolkit for guided modeling, forecasting, and custom algorithms.
This session will unveil the power of the Splunk Search Processing Language (SPL). See how to use Splunk's simple search language for searching and filtering through data, charting statistics and predicting values, converging data sources and grouping transactions, and finally data science and exploration. We'll begin with basic search commands and build up to more powerful advanced tactics to help you harness your SplunkFu!
Splunk Forum Frankfurt - 15th Nov 2017 - Threat HuntingSplunk
The document discusses using machine learning to automate threat hunting by presenting a case study on detecting domain generating algorithms (DGAs) used by ransomware like WannaCry. It provides an example workflow for building a machine learning model to classify domain names as malicious or benign, and evaluates the trained model on unseen WannaCry command and control domains. Key recommendations are to plan threat hunting with clear goals and metrics, and that machine learning can help explore threat data and enable automated mitigation.
SplunkLive! London 2017 - DevOps Powered by SplunkSplunk
DevOps is powering the computing environments of tomorrow. When properly configured, the Splunk platform allows us to gain real-time visibility into the velocity, quality, and business impact of DevOps-driven application delivery across all roles, departments, process, and systems. Splunk can be used by DevOps practitioners to provide continuous integration/deployment and the real-time feedback to help the organisation with their operational intelligence. Join us for an exciting talk about Splunk’s current approach to DevOps, and for examples of how Splunk is being used by customers today to transform DevOps initiatives.
SplunkLive! London 2017 - Happy Apps, Happy UsersSplunk
No matter what business you’re in, your web applications are front-and-center for your customers. Downtime, or even bad performance not only creates a spike in costs, they often translate into loss of customers and revenue. You need immediate insight into the availability, performance and usage of your applications and the infrastructure your applications run on. In this session, you will learn why you need to take a platform approach to full stack application management, whether your applications reside on-premises or in the cloud. Second, we will show you how you can use Splunk to monitor the usage and performance of your applications, and quickly troubleshoot faults by stepping through some of the most common issues our customers experience. Third, we’ll contrast what Splunk does relative to other APM tools you may already have deployed, and even show you how you can bring APM data into Splunk to gain more insight into application performance.
Splunk’s machine learning framework mixed with Splunk’s Event Management capabilities gives operations teams the opportunity to proactively act and automate on an event before it becomes an IT outage. This session will detail and demonstrate how to predict a health score of your business service, proactively take action based on those predictions and publish to your collaborative messaging and automation solutions.
SplunkLive! London 2017 - How to Earn a Seat and the Business Table with SplunkSplunk
Machine data holds the critical insights to drive business decisions. In this session, learn about the tools, the important people to engage, the process and tips and tricks of how Splunk customers have taken Splunk from addressing IT challenges to transforming their organisations and delivering business value.
Splunk is a powerful platform for understanding your data. This session will provide an overview of machine learning capabilities available across Splunk’s portfolio. We'll dive deeply into Splunk's Machine Learning Toolkit App, which extends Splunk Enterprise with a rich suite of advanced analytics, machine learning algorithms, and rich visualizations. It also provides customers with a guided model-building and operationalization environment. The demonstration will include the guided model-building UI for tasks such as predictive analytics, outlier detection, event clustering, and anomaly detection. We’ll also review typical use cases and real-world customers who are using the Toolkit to drive business results.
Reactive to Proactive: Intelligent Troubleshooting and Monitoring with SplunkSplunk
This document outlines an agenda and presentation for a Splunk workshop on reactive to proactive troubleshooting and monitoring. The agenda includes an introduction to Splunk for IT operations, hands-on IT operations exercises, an overview of relevant Splunk apps, an introduction to Splunk IT Service Intelligence, and customer stories. The presentation discusses how Splunk can help transform IT from reactive problem solving to proactive monitoring and operational intelligence. It highlights key Splunk capabilities like searching, monitoring, alerting and visualizing machine data from various sources to improve troubleshooting, uptime, and IT productivity. [/SUMMARY]
Partner Exec Summit 2018 - Frankfurt: Splunk Business Flow BetaSplunk
Splunk is conducting a beta test of its new Business Flow product to provide unified, real-time visibility into complex business processes and customer journeys across different data sources; the beta involves an initial setup session to configure data sources and visualize processes, followed by a follow up session to gather feedback on what is working well and opportunities for improvement; the goal is to help customers gain end-to-end visibility into critical workflows and discover insights to benefit their business and IT operations.
The Hitchhikers Guide to Service Intelligence Splunk
This presentation introduces Splunk IT Service Intelligence (ITSI). It provides an overview of key concepts in ITSI including what a service is, what key performance indicators (KPIs) are, and how service health scores are calculated. It demonstrates how to set up ITSI by configuring a sample database service, creating a new KPI to monitor network utilization, and cloning an existing glass table to include additional services and KPIs. The presentation shows how ITSI can provide real-time service visibility, help optimize operations, and improve collaboration across teams.
Erleichtern des Service-Betriebs und Steigern der Event-Zuverlässigkeit mit Machine Learning und Event Analytics.
Ihr Rechenzentrum erzeugt eine Unmenge von Events. Diese reichen von harmlosen Festplatten-Warnmeldungen bis hin zu kritischen Netzwerkproblemen und sogar Ausfällen auf Serviceebene. Wie wissen Sie bei so vielen Events und False Positives, welche Events wichtig sind und welche Sie getrost ignorieren können? Ihre aktuellen, regelbasierten Tools sind da keine Hilfe: Sie sind unflexibel, können das Event-Volumen der heutigen, veränderlichen Infrastrukturen nicht verarbeiten und liefern keine aussagekräftigen Benachrichtigungen, die Ihnen die Priorisierung der Probleme nach Wichtigkeit erleichtern.
Nehmen Sie am Webinar teil um zu erfahren, wie sich Splunk IT Service Intelligence das Potenzial von Machine Learning zunutze macht, um in einer integrierten Lösung belastbare und nach menschlichem Maßstab zu bewältigende Benachrichtigungen mit Servicekontext zu liefern, dank derer sich IT-Teams schnell und einfach auf die Problembehebung konzentrieren können. Erfahren Sie, wie Sie Machine Learning schnell für folgende Zwecke einsetzen können:
- Anomales Verhalten entdecken, um Events aufzuspüren, bevor sie zu kritischen Vorfällen werden
- Erstellung manueller Regeln vermeiden und Schwellenwerte dynamisch anpassen
- Daten automatisch korrelieren, um höchst qualifizierte Ergebnisse zu erzeugen, die schnell Maßnahmen ermöglichen
- Untersuchung der wichtigsten Vorfälle durch Servicekontext priorisieren und beschleunigen
Building Service Intelligence with Splunk IT Service Intelligence (ITSI)Splunk
IT has a lot on its plate—it needs to provide insight into key business services while also making sure operations run smoothly. To add value to the business, IT organizations must find new ways to bridge the gap between business and operations. This half-day, hands-on workshop demonstrates how to quickly gain insight into high-value services and align business and IT operations. By leveraging the machine data you’re already collecting and Splunk ITSI, you can easily model high-value services and rapidly build custom visualizations and dashboards. Whether you’re an executive or an administrator, you’ll learn how to transform service intelligence across your organization with powerful analytics and machine learning.
Rage WITH the machine, not against it: Machine learning for Event ManagementSplunk
Simplify service operations and improve reliability of events with machine learning and analytics
Your data centre creates a lot of events — from low-level disk warnings to critical network issues and even service-level failures. With so many events and false positives, how do you know which events are important and which ones to ‘throw away’? Your current rules-based tools don’t work they are inflexible, cannot handle event volumes from today’s transient infrastructures and do not provide actionable alerts that help you fix the important problems first.
Join this webinar to learn how Splunk IT Service Intelligence employs the power of machine learning to provide actionable human scale alerts with service context in an integrated solution, enabling IT teams to focus on fixing what’s broken quickly and easily. Learn how you can rapidly apply machine learning to:
- Catch anomalous behavior to detect events before they become critical incidents
- Avoid having to create manual rules and set adapt thresholds dynamically
- Automatically correlate data to generate highly qualified information, so you can take fast action
- Prioritize and speed up investigation on the most important incidents with service context
Splunk Discovery: Milan 2018 - Get More From Your Machine Data with Splunk AISplunk
This document discusses machine learning and artificial intelligence capabilities provided by Splunk. It begins by explaining why organizations are adopting AI and machine learning to improve decision making, uncover hidden trends, forecast incidents, and more using diverse real-time data. It then provides an overview of Splunk's machine learning toolkit and capabilities including search, packaged solutions, algorithms, and commands. Examples of applications include anomaly detection, predictive analytics, dynamic thresholding and more. Customer stories demonstrate how organizations are using Splunk's machine learning for security, operations, and other use cases.
Splunk Discovery: Milan 2018 - Intro to Security Analytics MethodsSplunk
The document discusses security analytics methods for detecting threats using Splunk software. It covers common security challenges, types of analytics methods, and applying analytics to stages of an attack. The agenda includes an introduction to analytics methods, an overview of Splunk Security Essentials, a demo scenario of detecting a malicious insider, and next steps involving Enterprise Security and Splunk UBA. The demo scenario shows detecting large file uploads from Box to detect an insider exporting sales proposals. The summary recommends starting with Splunk Security Essentials, then leveraging Enterprise Security and UBA for advanced machine learning detection and automated response.
Delivering New Visibility and Analytics for IT OperationsSplunk
If you're just getting started with Splunk, this session will help you understand how to use Splunk software to turn your silos of data into insights that are actionable. In this session, we’ll dive right into a Splunk environment and show you how to use the simple Splunk search interface to quickly find the needle-in-the-haystack or multiple needles in multiple haystacks. We’ll demonstrate how to perform rapid ad-hoc searches to conduct routine investigations across your entire IT infrastructure in one place, whether physical, virtual or in the cloud. We’ll show you how to then convert these searches into real time alerts and dashboards, so you can proactively monitor for problems before they impact your end user. We'll demonstrate how you can use Splunk to connect the dots across heterogeneous systems in your environment for cross-tier, cross-silo visibility. You'll have access to a demo environment. So, don't forget to bring your laptop and follow along for a hands-on experience.
.conf Go 2023 - Raiffeisen Bank InternationalSplunk
This document discusses standardizing security operations procedures (SOPs) to increase efficiency and automation. It recommends storing SOPs in a code repository for versioning and referencing them in workbooks which are lists of standard tasks to follow for investigations. The goal is to have investigation playbooks in the security orchestration, automation and response (SOAR) tool perform the predefined investigation steps from the workbooks to automate incident response. This helps analysts automate faster without wasting time by having standard, vendor-agnostic procedures.
.conf Go 2023 - Das passende Rezept für die digitale (Security) Revolution zu...Splunk
.conf Go 2023 presentation:
"Das passende Rezept für die digitale (Security) Revolution zur Telematik Infrastruktur 2.0 im Gesundheitswesen?"
Speaker: Stefan Stein -
Teamleiter CERT | gematik GmbH M.Eng. IT-Sicherheit & Forensik,
doctorate student at TH Brandenburg & Universität Dresden
El documento describe la transición de Cellnex de un Centro de Operaciones de Seguridad (SOC) a un Equipo de Respuesta a Incidentes de Seguridad (CSIRT). La transición se debió al crecimiento de Cellnex y la necesidad de automatizar procesos y tareas para mejorar la eficiencia. Cellnex implementó Splunk SIEM y SOAR para automatizar la creación, remediación y cierre de incidentes. Esto permitió al personal concentrarse en tareas estratégicas y mejorar KPIs como tiempos de resolución y correos electrónicos anal
conf go 2023 - El camino hacia la ciberseguridad (ABANCA)Splunk
Este documento resume el recorrido de ABANCA en su camino hacia la ciberseguridad con Splunk, desde la incorporación de perfiles dedicados en 2016 hasta convertirse en un centro de monitorización y respuesta con más de 1TB de ingesta diaria y 350 casos de uso alineados con MITRE ATT&CK. También describe errores cometidos y soluciones implementadas, como la normalización de fuentes y formación de operadores, y los pilares actuales como la automatización, visibilidad y alineación con MITRE ATT&CK. Por último, señala retos
Splunk - BMW connects business and IT with data driven operations SRE and O11ySplunk
BMW is defining the next level of mobility - digital interactions and technology are the backbone to continued success with its customers. Discover how an IT team is tackling the journey of business transformation at scale whilst maintaining (and showing the importance of) business and IT service availability. Learn how BMW introduced frameworks to connect business and IT, using real-time data to mitigate customer impact, as Michael and Mark share their experience in building operations for a resilient future.
The document is a presentation on cyber security trends and Splunk security products from Matthias Maier, Product Marketing Director for Security at Splunk. The presentation covers trends in security operations like the evolution of SOCs, new security roles, and data-centric security approaches. It also provides updates on Splunk's security portfolio including recognition as a leader in SIEM by Gartner and growth in the SIEM market. Maier highlights some breakout sessions from the conference on topics like asset defense, machine learning, and building detections.
Data foundations building success, at city scale – Imperial College LondonSplunk
Universities have more in common with modern cities than traditional places of learning. This mini city needs to empower its citizens to thrive and achieve their ambitions. Operationalising data is key to building critical services; from understanding complex IT estates for smarter decision-making to robust security and a more reliable, resilient student experience. Juan will share his experience in building data foundations for a resilient future whilst enabling digital transformation at Imperial College London.
Splunk: How Vodafone established Operational Analytics in a Hybrid Environmen...Splunk
Learn how Vodafone has provided end-to-end visibility across services by building an Operational Analytics Platform. In this session, you will hear how Stefan and his team manage legacy, on premise, hybrid and public cloud services, and how they are providing a platform for complex triage and debugging to tackle use cases across Vodafone’s extensive ecosystem.
.italo operates an Essential Service by connecting more than 100 million people annually across Italy with its super fast and secure railway. And CISO Enrico Maresca has been on a whirlwind journey of his own.
Formerly a Cyber Security Engineer, Enrico started at .italo as an IT Security Manager. One year later, he was promoted to CISO and tasked with building out – and significantly increasing the maturity level – of the SOC. The result was a huge step forward for .italo.
So how did he successfully achieve this ambitious ask? Join Enrico as he reveals the key insights and lessons learned in his SOC journey, including:
Top challenges faced in improving security posture
Key KPIs implemented in order to measure success
Strategies and approaches applied in the SOC
How MITRE ATT&CK and Splunk Enterprise Security were utilised
Next steps in their maturity journey ahead
This document summarizes a presentation about observability using Splunk. It includes an agenda introducing observability and why Splunk for observability. It discusses the need for modernization initiatives in companies and the thousands of changes required. It presents that Splunk provides end-to-end visibility across metrics, traces and logs to detect, troubleshoot and optimize systems. It shares a customer case study of Accenture using Splunk observability in their hybrid cloud environment. Finally, it concludes that observability with Splunk can drive results like reduced downtime and faster innovation.
This document contains slides from a Splunk presentation covering the following topics:
- Updated Splunk logo and information about meetings in Zurich and sales engineering leads
- Ideas for confused or concerned human figures in design concepts
- Three buckets of challenges around websites slowing, apps being down, and supply chain issues
- Accelerating mean time to detect, identify, respond and resolve through cyber resilience with Splunk
- Unifying security, IT and DevOps teams
- Splunk's technology vision focusing on customer experience, hybrid/edge, unleashing data lakes, and ubiquitous machine learning
- Gaining operational resilience through correlating infrastructure, security, application and user data with business outcomes
This document summarizes a presentation about Splunk's platform. It discusses Splunk's mission of helping customers create value faster with insights from their data. It provides statistics on Splunk's daily ingest and users. It highlights examples of how Splunk has helped customers in areas like internet messaging and convergent services. It also discusses upcoming challenges and new capabilities in Splunk like federated search, flexible indexing, ingest actions, improved data onboarding and management, and increased platform resilience and security.
The document appears to be a presentation from Splunk on security topics. It includes sections on cyber security resilience, the data-centric modern SOC, application monitoring at scale, threat modeling, security monitoring journeys, self-service Splunk infrastructure, the top 3 CISO priorities of risk based alerting, use case development, a security content repository, security PVP (posture, vision, and planning) and maturity assessment, and concludes with an overview of how Splunk can provide end-to-end visibility across an organization.
Connector Corner: Seamlessly power UiPath Apps, GenAI with prebuilt connectorsDianaGray10
Join us to learn how UiPath Apps can directly and easily interact with prebuilt connectors via Integration Service--including Salesforce, ServiceNow, Open GenAI, and more.
The best part is you can achieve this without building a custom workflow! Say goodbye to the hassle of using separate automations to call APIs. By seamlessly integrating within App Studio, you can now easily streamline your workflow, while gaining direct access to our Connector Catalog of popular applications.
We’ll discuss and demo the benefits of UiPath Apps and connectors including:
Creating a compelling user experience for any software, without the limitations of APIs.
Accelerating the app creation process, saving time and effort
Enjoying high-performance CRUD (create, read, update, delete) operations, for
seamless data management.
Speakers:
Russell Alfeche, Technology Leader, RPA at qBotic and UiPath MVP
Charlie Greenberg, host
Conversational agents, or chatbots, are increasingly used to access all sorts of services using natural language. While open-domain chatbots - like ChatGPT - can converse on any topic, task-oriented chatbots - the focus of this paper - are designed for specific tasks, like booking a flight, obtaining customer support, or setting an appointment. Like any other software, task-oriented chatbots need to be properly tested, usually by defining and executing test scenarios (i.e., sequences of user-chatbot interactions). However, there is currently a lack of methods to quantify the completeness and strength of such test scenarios, which can lead to low-quality tests, and hence to buggy chatbots.
To fill this gap, we propose adapting mutation testing (MuT) for task-oriented chatbots. To this end, we introduce a set of mutation operators that emulate faults in chatbot designs, an architecture that enables MuT on chatbots built using heterogeneous technologies, and a practical realisation as an Eclipse plugin. Moreover, we evaluate the applicability, effectiveness and efficiency of our approach on open-source chatbots, with promising results.
Taking AI to the Next Level in Manufacturing.pdfssuserfac0301
Read Taking AI to the Next Level in Manufacturing to gain insights on AI adoption in the manufacturing industry, such as:
1. How quickly AI is being implemented in manufacturing.
2. Which barriers stand in the way of AI adoption.
3. How data quality and governance form the backbone of AI.
4. Organizational processes and structures that may inhibit effective AI adoption.
6. Ideas and approaches to help build your organization's AI strategy.
Discover top-tier mobile app development services, offering innovative solutions for iOS and Android. Enhance your business with custom, user-friendly mobile applications.
Fueling AI with Great Data with Airbyte WebinarZilliz
This talk will focus on how to collect data from a variety of sources, leveraging this data for RAG and other GenAI use cases, and finally charting your course to productionalization.
Northern Engraving | Nameplate Manufacturing Process - 2024Northern Engraving
Manufacturing custom quality metal nameplates and badges involves several standard operations. Processes include sheet prep, lithography, screening, coating, punch press and inspection. All decoration is completed in the flat sheet with adhesive and tooling operations following. The possibilities for creating unique durable nameplates are endless. How will you create your brand identity? We can help!
The Microsoft 365 Migration Tutorial For Beginner.pptxoperationspcvita
This presentation will help you understand the power of Microsoft 365. However, we have mentioned every productivity app included in Office 365. Additionally, we have suggested the migration situation related to Office 365 and how we can help you.
You can also read: https://www.systoolsgroup.com/updates/office-365-tenant-to-tenant-migration-step-by-step-complete-guide/
Northern Engraving | Modern Metal Trim, Nameplates and Appliance PanelsNorthern Engraving
What began over 115 years ago as a supplier of precision gauges to the automotive industry has evolved into being an industry leader in the manufacture of product branding, automotive cockpit trim and decorative appliance trim. Value-added services include in-house Design, Engineering, Program Management, Test Lab and Tool Shops.
AppSec PNW: Android and iOS Application Security with MobSFAjin Abraham
Mobile Security Framework - MobSF is a free and open source automated mobile application security testing environment designed to help security engineers, researchers, developers, and penetration testers to identify security vulnerabilities, malicious behaviours and privacy concerns in mobile applications using static and dynamic analysis. It supports all the popular mobile application binaries and source code formats built for Android and iOS devices. In addition to automated security assessment, it also offers an interactive testing environment to build and execute scenario based test/fuzz cases against the application.
This talk covers:
Using MobSF for static analysis of mobile applications.
Interactive dynamic security assessment of Android and iOS applications.
Solving Mobile app CTF challenges.
Reverse engineering and runtime analysis of Mobile malware.
How to shift left and integrate MobSF/mobsfscan SAST and DAST in your build pipeline.
Have you ever been confused by the myriad of choices offered by AWS for hosting a website or an API?
Lambda, Elastic Beanstalk, Lightsail, Amplify, S3 (and more!) can each host websites + APIs. But which one should we choose?
Which one is cheapest? Which one is fastest? Which one will scale to meet our needs?
Join me in this session as we dive into each AWS hosting service to determine which one is best for your scenario and explain why!
Essentials of Automations: Exploring Attributes & Automation ParametersSafe Software
Building automations in FME Flow can save time, money, and help businesses scale by eliminating data silos and providing data to stakeholders in real-time. One essential component to orchestrating complex automations is the use of attributes & automation parameters (both formerly known as “keys”). In fact, it’s unlikely you’ll ever build an Automation without using these components, but what exactly are they?
Attributes & automation parameters enable the automation author to pass data values from one automation component to the next. During this webinar, our FME Flow Specialists will cover leveraging the three types of these output attributes & parameters in FME Flow: Event, Custom, and Automation. As a bonus, they’ll also be making use of the Split-Merge Block functionality.
You’ll leave this webinar with a better understanding of how to maximize the potential of automations by making use of attributes & automation parameters, with the ultimate goal of setting your enterprise integration workflows up on autopilot.
inQuba Webinar Mastering Customer Journey Management with Dr Graham HillLizaNolte
HERE IS YOUR WEBINAR CONTENT! 'Mastering Customer Journey Management with Dr. Graham Hill'. We hope you find the webinar recording both insightful and enjoyable.
In this webinar, we explored essential aspects of Customer Journey Management and personalization. Here’s a summary of the key insights and topics discussed:
Key Takeaways:
Understanding the Customer Journey: Dr. Hill emphasized the importance of mapping and understanding the complete customer journey to identify touchpoints and opportunities for improvement.
Personalization Strategies: We discussed how to leverage data and insights to create personalized experiences that resonate with customers.
Technology Integration: Insights were shared on how inQuba’s advanced technology can streamline customer interactions and drive operational efficiency.
zkStudyClub - LatticeFold: A Lattice-based Folding Scheme and its Application...Alex Pruden
Folding is a recent technique for building efficient recursive SNARKs. Several elegant folding protocols have been proposed, such as Nova, Supernova, Hypernova, Protostar, and others. However, all of them rely on an additively homomorphic commitment scheme based on discrete log, and are therefore not post-quantum secure. In this work we present LatticeFold, the first lattice-based folding protocol based on the Module SIS problem. This folding protocol naturally leads to an efficient recursive lattice-based SNARK and an efficient PCD scheme. LatticeFold supports folding low-degree relations, such as R1CS, as well as high-degree relations, such as CCS. The key challenge is to construct a secure folding protocol that works with the Ajtai commitment scheme. The difficulty, is ensuring that extracted witnesses are low norm through many rounds of folding. We present a novel technique using the sumcheck protocol to ensure that extracted witnesses are always low norm no matter how many rounds of folding are used. Our evaluation of the final proof system suggests that it is as performant as Hypernova, while providing post-quantum security.
Paper Link: https://eprint.iacr.org/2024/257
5th LF Energy Power Grid Model Meet-up SlidesDanBrown980551
5th Power Grid Model Meet-up
It is with great pleasure that we extend to you an invitation to the 5th Power Grid Model Meet-up, scheduled for 6th June 2024. This event will adopt a hybrid format, allowing participants to join us either through an online Mircosoft Teams session or in person at TU/e located at Den Dolech 2, Eindhoven, Netherlands. The meet-up will be hosted by Eindhoven University of Technology (TU/e), a research university specializing in engineering science & technology.
Power Grid Model
The global energy transition is placing new and unprecedented demands on Distribution System Operators (DSOs). Alongside upgrades to grid capacity, processes such as digitization, capacity optimization, and congestion management are becoming vital for delivering reliable services.
Power Grid Model is an open source project from Linux Foundation Energy and provides a calculation engine that is increasingly essential for DSOs. It offers a standards-based foundation enabling real-time power systems analysis, simulations of electrical power grids, and sophisticated what-if analysis. In addition, it enables in-depth studies and analysis of the electrical power grid’s behavior and performance. This comprehensive model incorporates essential factors such as power generation capacity, electrical losses, voltage levels, power flows, and system stability.
Power Grid Model is currently being applied in a wide variety of use cases, including grid planning, expansion, reliability, and congestion studies. It can also help in analyzing the impact of renewable energy integration, assessing the effects of disturbances or faults, and developing strategies for grid control and optimization.
What to expect
For the upcoming meetup we are organizing, we have an exciting lineup of activities planned:
-Insightful presentations covering two practical applications of the Power Grid Model.
-An update on the latest advancements in Power Grid -Model technology during the first and second quarters of 2024.
-An interactive brainstorming session to discuss and propose new feature requests.
-An opportunity to connect with fellow Power Grid Model enthusiasts and users.
Your One-Stop Shop for Python Success: Top 10 US Python Development Providersakankshawande
Simplify your search for a reliable Python development partner! This list presents the top 10 trusted US providers offering comprehensive Python development services, ensuring your project's success from conception to completion.
This presentation has some animations and content to help tell stories as you go. Feel free to change ANY of this to your own liking! I would definitely practice your flow once or twice before a presentation. There is A LOT of content to get through in 1 hour. The slides with search examples can be unhidden if needed.
Here is what you need for this presentation:
You should have the following installed:
PowerOfSPL App - https://splunkbase.splunk.com/app/3353/
Custom Cluster Map Visualization - https://splunkbase.splunk.com/app/3122/
Clustered Single Value Map Visualization - https://splunkbase.splunk.com/app/3124/
Geo Heatmap Custom Visualization - https://splunkbase.splunk.com/app/3217/
Timewrap Custom Command (NOTE this command is now included in CORE) - https://splunkbase.splunk.com/app/1645/
Haversine Custom Command - https://splunkbase.splunk.com/app/936/
Levenshtein Custom Command - https://splunkbase.splunk.com/app/1898/
Optional:
Splunk Search Reference Guide handouts
Mini buttercups or other prizes to give out for answering questions during the presentation
Shake! Demo can be used for interactivity on some of these search examples if you want… definitely adds some flare to the presentation
Intro
Mention to people to start downloading Splunk as it’s a large download if they haven’t already. If they already have Splunk installed than they just need to download the Power Of SPL App.
How to get help (recommended to have 1-2 staffers in room to help with install problems etc)
Intro
Mention to people to start downloading Splunk as it’s a large download if they haven’t already. If they already have Splunk installed than they just need to download the Power Of SPL App.
How to get help (recommended to have 1-2 staffers in room to help with install problems etc)
Intro:
1. Get everyone set up
2. This will essentially be a follow along – with me demoing and you following along. After today’s session you’ll have a useful, live instance with everything we do today on it.
3. We’ll walk through a bunch of different SPL commands, how SPL works with Custom Visualizations and finally SPL with a light Machine Learning intro.
- We call them search commands, but they really do so much more and that’s what I hope to get across with you today.
“The Splunk search language has over 140+ commands, is very expressive and can perform a wide variety of tasks ranging from filtering to data, to munging or modifying, and reporting.”
“The Syntax was …”
“Why? Because SQL is good for certain tasks and the Unix pipeline is amazing!”
This is great BUT… WHY WOULD WE WANT TO CREATE A NEW LANGUAGE AND WHY DO YOU CARE?
<Engage audience here.. Before showing bullet points ask “Why do you think we would want to create a new language?”>
<Also Feel free to change pictures or flow of this slide..> -- have buttercups to throw out if anyone answers correctly?
- Today we require the ability to quickly search and correlate through large amounts of data, sometimes in an unstructured or semi-unstructured way.
Conventional query languages (such as SQL or MDX) simply do not provide the flexibility required for the effective searching of big data. Not only this but STREAMING data. (SQL can be great at joining a bunch of small tables together, but really large joins on datasets can be a problem whereas hadoop can be great with larger data sets, but sometimes inefficient when it comes to many small files or datasets. )
- Machine Data is different:
- It is voluminous unstructured time series data with no predefined schema
- It is generated by all IT systems– from applications and servers, to networks and RFIDs.
- It is non-standard data and characterized by unpredictable and changing formats
Traditional approaches are just not engineered for managing this high volume, high velocity, and highly diverse form of data.
Splunk’s NoSQL query approach does not involve or impose any predefined schema. This enables the increased flexibility mentioned above, as there are
No limits on the formats of data –
No limits on where you can collect it from
No limits on the questions that you can ask of it
And no limits on scale
Methods of Correlation enabled by SPL
Time & GeoLocation: Identify relationships based on time and geographic location
Transactions: Track a series of events as a single transaction
Subsearches: Results of one search as input into other searches
Lookups: Enhance, enrich, validate or add context to event data
SQL-like joins between different data sets
In addition to flexible searching and correlation, the same language is used to rapidly construct reports, dashboards, trendlines and other visualizations. This is useful because you can understand and leverage your data without the cost associated with the formal structuring or modeling of the data first. (With hadoop or SQL you run a job or query to generate results, but then you have need to integrate more software to actually visualize it!)
“OK.. Let’s move on..”
“Let’s take a closer look at the syntax, notice the unix pipeline”
“The structure of SPL creates an easy way to stitch a variety of commands together to solve almost any question you may ask of your data.”
“Search and Filter”
- The search and filter piece allows you to use fields or keywords to reduce the data set. It’s an important but often overlooked part of the search due to the performance implications.
“Munge”
- The munge step is a powerful piece because you can “re-shape” data on the fly. In this example we show creating a new field called KB from an existing field “bytes”.
“Report”
- Once we’ve shaped and massaged the data we now have an abundant set of reporting commands that are used to visualize results through charts and tables, or even send to a third party application in whatever format they require.
“Cleanup”
- Lastly there are some cleanup options to help you create better labeling and add or remove fields.
Again, sticthing together makes it easier to utilize and understand advanced commands, better flow etc. Additionally the implicit join on time and automatic granularity helps reduces complexity compared to what you would have to do in SQL and excel or other tools.
“Let’s look at some more in depth examples”
“In this next section we’ll take a more in depth look at some search examples and recipes. It would be impossible for us to go over every command and use case so the goal of this is to show a few different commands that can help solve most problems and generate quick time to value in the following area."
Note how the search assistant shows the number of both exact and similar matched terms before you even click search. This can be very useful when exploring and previewing your data sets without having to run searches over and over again to find a result.
Additionally we can further filter our data set down to a specific host.
Lastly we can combine filters and keyword searches very easily.
“This is pretty basic, but the key here is that SPL makes it incredibly easy and flexible to filter your searches down and reduce your data set to exactly what you’re looking for.
Remember Munging or Re-shaping our data on the fly? Talk about Eval and it’s importance
sourcetype=access*|eval KB=bytes/1024
“There are tons of EVAL commands to help you shape or manipulate your data the way you want it.”
Optional
<Click on image to go to show and scroll through online quick reference quide>
Show difference between stats and timechart (adds _time buckets, visualize, etc.)
Why is this awesome? We can do all of the same statistical calculations over time with almost any level of granularity. For example…
<change timepicker from 60min to 15min, add span=1s to search and zoom in>
Add below?
Due to the implicit time dimension, it’s very easy to use timechart to visualize disparate data sets with varying time frequencies.
SQL vs Timechart actual comparison?
Walk through trendline basic options
Walk through predict basic options
“The timechart command plus other SPL commands make it very easy to visualize your data any way you want.”
“Again, don’t forget about the quick reference guide. There are many more statistical functions you can use with these commands on your data.”
Context is everything when it comes to building successful operational intelligence.
When you are stuck analyzing events from a single data source at a time, you might be missing out on rich contextual information or new insights that other data sources can provide.
Let’s take a quick look at a few powerful SPL commands that can help make this happen.
Make sure everyone is on the “4.1 Geographic” Dashboard. The bottom 3 visualizations will show errors.
Each example headline can be clicked to go to the correct Splunkbase page for download. Have each user (including yourself) download each app (3 of them), install them from file, and restart Splunk to ensure correct functionality.
Walkthrough the SPL required to generate each custom visualization. Point out the different commands used and why.
Now let’s install one more … Search for Missile Map on Splunkbase
Download and install
Complete the following search to get the visualization to work (starting coordinates can be whatever you like)
index=power_of_spl | stats count by clientip | iplocation clientip | dedup Country | eval start_lat="-104.99", start_lon="39.76" |
Let’s add some of the custom options specific to this visualization:
Make it animated
Make it colored
Make it pulse
index=power_of_spl | stats count by clientip | iplocation clientip | dedup Country | tail 10 | eval start_lat="-104.99", start_lon="39.76", end_lat=lon, end_lon=lat | eval color=if(Country="Iran","#FF0000","") | eval pulse_at_start="false" | eval animate=if(Country="Iran","true","false") | table color, animate, pulse_at_start, start_lat start_lon end_lat end_lon
Walk through the dashboard which points out several uses of anomalydetection
NOTE: Many transactions can be re-created using stats. Transaction is easy but stats is way more efficient and it’s a mapable command (more work will be distributed to the indexers).
sourcetype=access*
| stats min(_time) AS earliest max(_time) AS latest by JSESSIONID
| eval duration=latest-earliest
| stats min(duration) max(duration) avg(duration)
Feel free to change this and use your own story!
“My interpretation of Data Exploration when it comes to Splunk is the process of characterizing and researching behavior of both existing and new data sources.”
“ For example while you may have an existing data source you are already used to, but there still could be some unknown value in in terms of patterns, relationships between fields and rare events that could point you to new insights or help with predictive analytics. This capability gives you confidence to explore new data sources as well because you can quickly look for replacements and nuggets that stick out or help classify data. A friend once asked me to look at some biomedical data with DNA information. The vocabulary and field definitions were way above me, but I was able to quickly understand patterns and relationships with Splunk and provide them value instaneously. With Splunk you literally become afraid of no data!”
Let’s look at a few quick examples.
“The cluster command is used to find common and/or rare events within your data”
<Show simple table search first and point out # of events, then run cluster and sort on cluster count to show common vs rare events>
* | table _raw _time
* | cluster showcount=t t=.1
| table _raw cluster_count
| sort - cluster_count
Fieldsummary gives you a quick breakdown of your numerical fields such as count, min, max, stdev, etc. It also shows you examples values in the event. I used maxvals to limit the number of samples it shows per field.
sourcetype=access_combined
| fields – date* source* time*
| fieldsummary maxvals=5
“The correlate command is used to find co-occurrence between fields. Basically a matrix showing the ‘Field1 exists 80% of the time when Field2 exists’”
sourcetype=access_combined
| fields – date* source* time*
| correlate
“This can be useful for both making sure your field extractions are correct (if you expect a field to exist %100 of the time when another field exists) and also helping you identify potential patterns and trends between different fields.”
“The contingency command is used to look for relationships of between two fields. Basically for these two fields, how many different value combinations are there and what are they / most common”
sourcetype=access_combined
| contingency uri status
This command is extremely useful for not only looking for meaningful fields in your data, but also for determining which fields to use in linear or logistical regression algorithms in the machine learning app.
sourcetype=access_combined
| analyzefields classfield=status
These commands are not only useful for learning about the patterns and characteristics of your data, but they are a stepping stone into machine learning as well.
If you want to learn more about Data Science, Exploration and Machine Learning, download the Machine Learning App! You’ll use new SPL commands like “fit” and “apply” to train models on data in Splunk. We will take a look at this in more detail after the last SPL section, custom commands.
New SPL commands: fit, apply, summary, listmodels, and deletemodel
* Predict Numeric Fields (Linear Regression): e.g. predict median house values.
* Predict Categorical Fields (Logistic Regression): e.g. predict customer churn.
* Detect Numeric Outliers (distribution statistics): e.g. detect outliers in IT Ops data.
* Detect Categorical Outliers (probabilistic measures): e.g. detect outliers in diabetes patient records.
* Forecast Time Series: e.g. forecast data center growth and capacity planning.
* Cluster Events (K-means, DBSCAN, Spectral Clustering, BIRCH).
Let’s talk about custom commands before we get into Machine Learning.
Only need to go through one example here, I usually just do haversine.
“We’ve gone over a variety of Splunk search commands.. but what happens when we can’t find a command that fits our needs OR want to use a complex algorithm someone already OR even create your own?? Enter Custom Commands.”
Additional Text:
Splunk's search language includes a wide variety of commands that you can use to get what you want out of your data and even to display the results in different ways. You have commands to correlate events and calculate statistics on your results, evaluate fields and reorder results, reformat and enrich your data, build charts, and more. Still, Splunk enables you to expand the search language to customize these commands to better meet your needs or to write your own search commands for custom processing or calculations.
Let’s see Haversine in action.
<Pull up search>
*Note – Coordinates of origin in this Haversine example is currently “Seattle”
In this final section today we’re going to do a brief overview of the ML Toolkit. More specifically since this whole workshop is based on SPL, we’ll focus in on the SPL aspects of Machine Learning.
First things first, Let’s install it!
The purpose of this slide is to point out some of the SPL commands and how they contribute or can be applied to a Machine Learning use case or process every step of the way.
Key Points:
- We’ve gone over some of these commands already, but here’s where they fit in the ML process, from cleaning, to stats, etc.
- Some of these commands such as predict and anomalydetection are part of core Splunk
- As of today, there are 6 commands specific too and added by the MLTK – all highlighted in blue
- Let’s go over them briefly
The Demo will show each of the 6 commands in use. I decided to use the ”Predict Categorical Fields” and the ”Predict Car Make and Model” example as it’s very easy to understand. Feel free to use any other example you prefer. The backup slides below are of this example. The next slide contains the directions to help everyone install the MLTK so they can follow along.
Once everyone is ready to go, explain the Showcase at a high level before drilling into the example.
You’ll go in the following order and can access most of the SPL just by using the assistant.
1. fit
Start on the Showcase tab. Click “Predict Vehicle Make and Model” under “Predict Categorical Fields”. Wait for page to load. Explain the basic operations of the page. Then click on “Show SPL” next to fit model to show the SPL portion. Then show them how to open this in search.
2. sample
Once You’ve opened this in search, remove all of the SPL except for the inputlookup statement. Notice the 50,000 results. Now add | sample ratio=.12 to the query and show how the results have been cut down and is a randomized sample.
3. apply
Go back to the assistant. Scroll down to look at the prediction results and other statistical information. Hover over the helpers and explain some of the features. Now click “open in search” button in the “Prediction Results Table”. This will show the Apply command in action. Point out how there is a new field called “predicted(vehicleType)”
4. listmodels
Remove all of the SPL and type “| listmodels”. Explain how this lists all of the models you’ve created using the fit command.
5. summary
Remove all of the SPL and type “| summary example_vehicle_type”. Explain how this shows additional detail about the model. The results and what is shown depends on what algorithm has been used. This is a good time to play with other examples in the MLTK to see the differences.
6. deletemodel
Remove all of the SPL and type “| deletemodel example_vehicle_type”. This will simply delete models.
Again you can either install through the App Management GUI using “Browse for Apps” or you can download them from Splunkbase and choose ”Install from File”
You’ll most likely have to restart after installing the apps. (You can wait to restart until you’ve installed both of them)
References:
Make sure to reference this App is now available for download!!
References:
Make sure to reference this App is now available for download!!