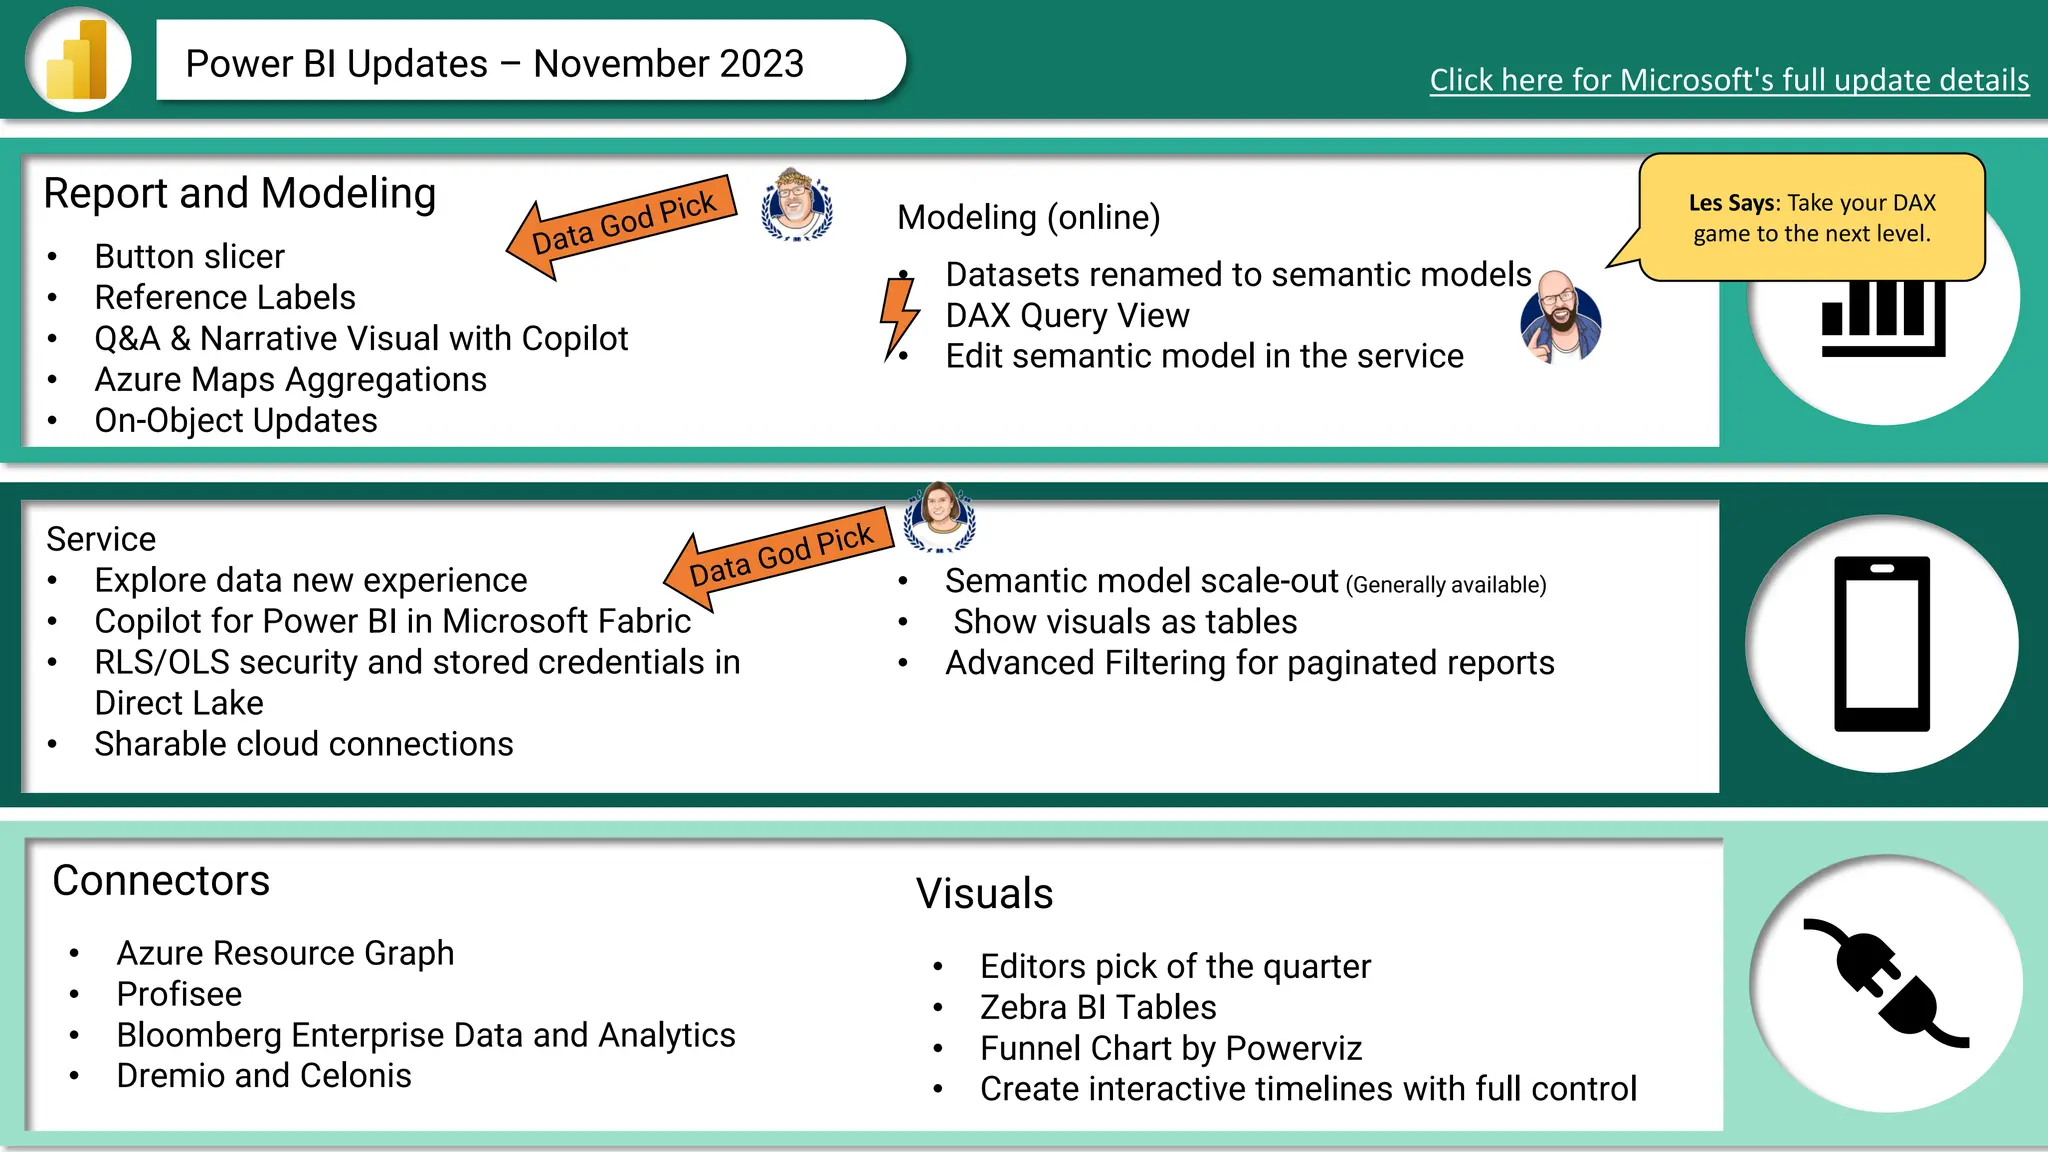
Power BI Updates– November 2023 Click here for Microsoft's full update details
• Button slicer
• Reference Labels
• Q&A & Narrative Visual with Copilot
• Azure Maps Aggregations
• On-Object Updates
Service
• Explore data new experience
• Copilot for Power BI in Microsoft Fabric
• RLS/OLS security and stored credentials in
Direct Lake
• Sharable cloud connections
• Datasets renamed to semantic models
• DAX Query View
• Edit semantic model in the service
Modeling (online)
Les Says: Take your DAX
game to the next level.
• Semantic model scale-out (Generally available)
• Show visuals as tables
• Advanced Filtering for paginated reports
• Azure Resource Graph
• Profisee
• Bloomberg Enterprise Data and Analytics
• Dremio and Celonis
Report and Modeling
Connectors
• Editors pick of the quarter
• Zebra BI Tables
• Funnel Chart by Powerviz
• Create interactive timelines with full control
Visuals
3.
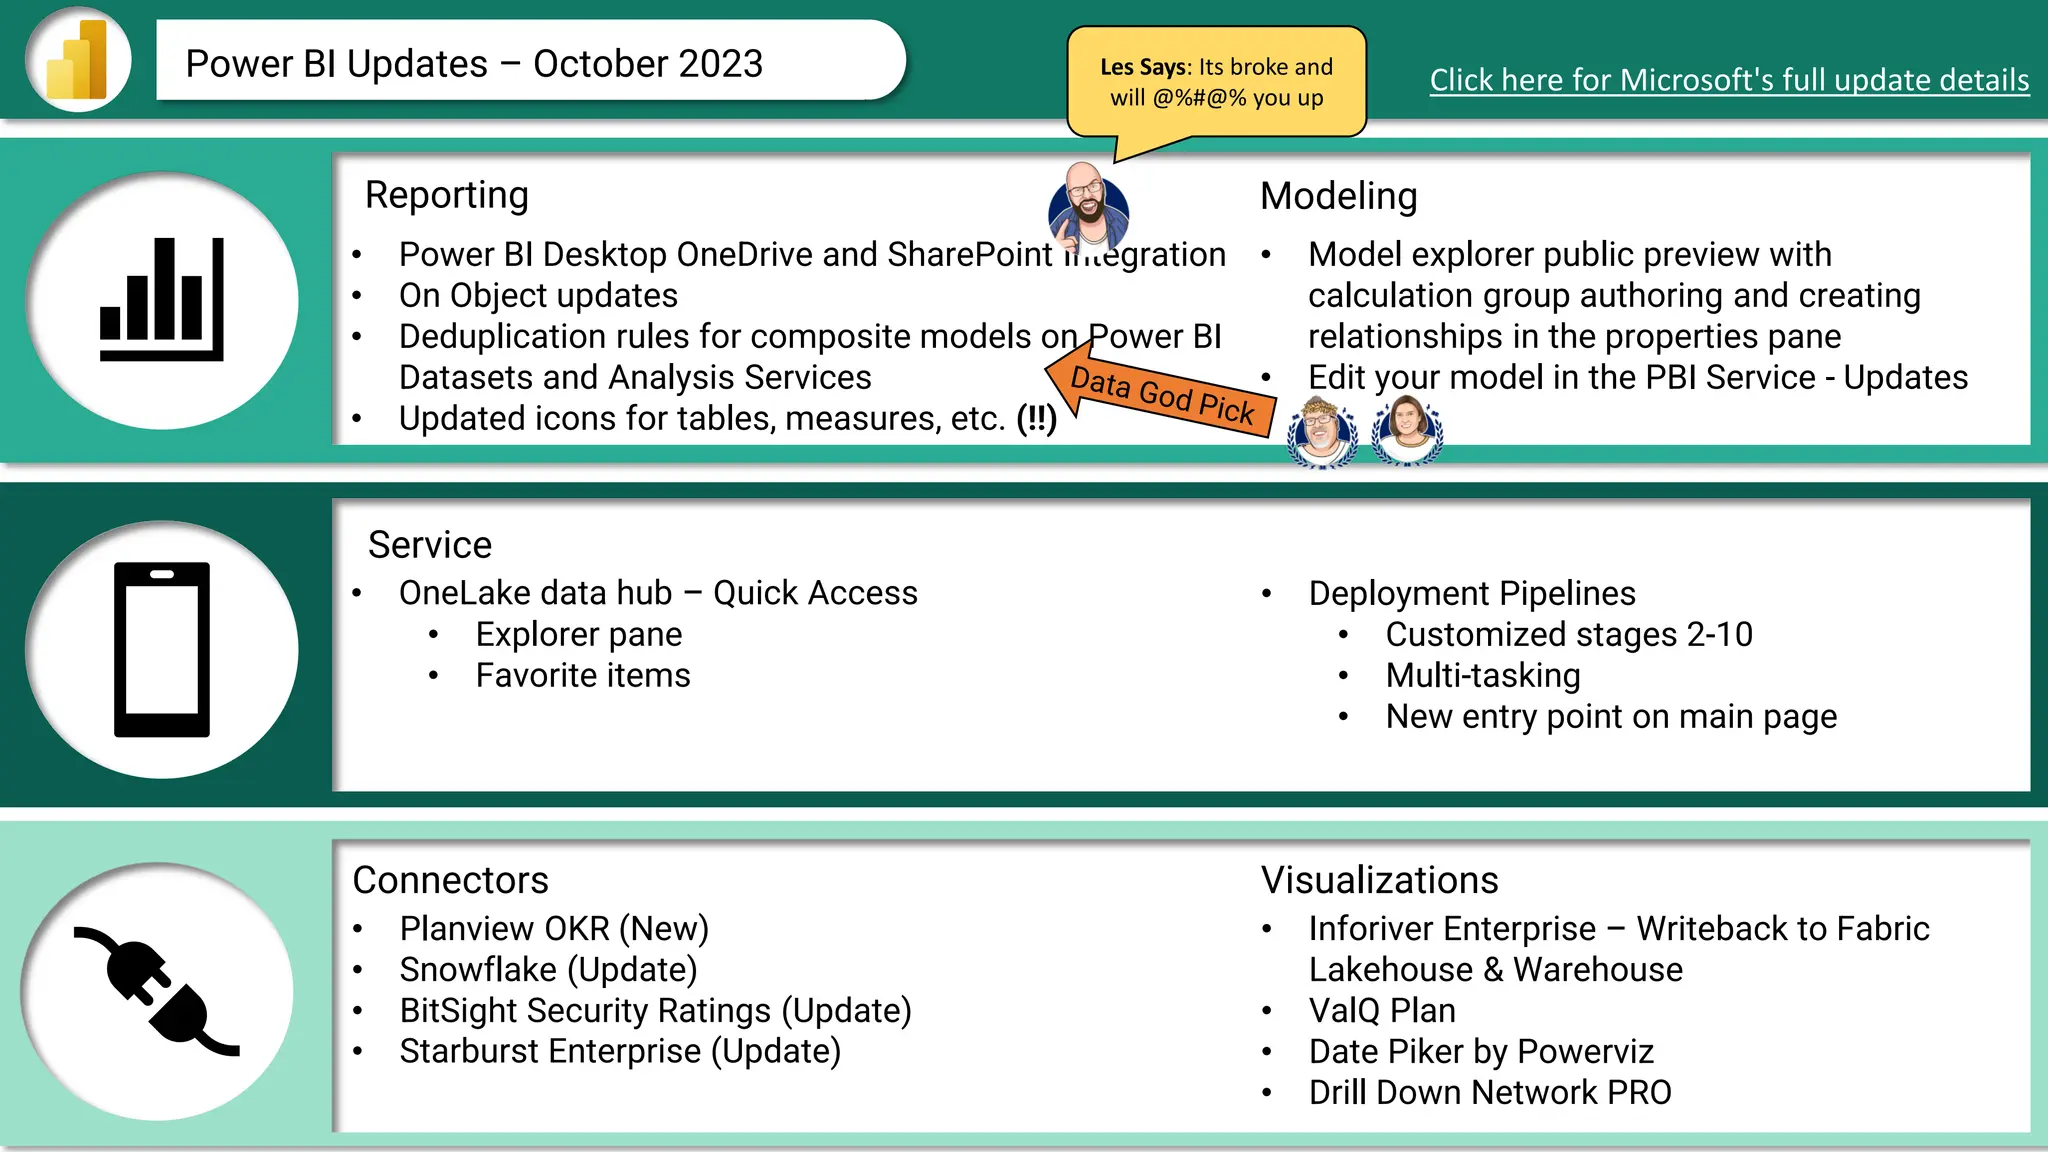
Power BI Updates– October 2023 Click here for Microsoft's full update details
• Power BI Desktop OneDrive and SharePoint Integration
• On Object updates
• Deduplication rules for composite models on Power BI
Datasets and Analysis Services
• Updated icons for tables, measures, etc. (!!)
• OneLake data hub – Quick Access
• Explorer pane
• Favorite items
• Planview OKR (New)
• Snowflake (Update)
• BitSight Security Ratings (Update)
• Starburst Enterprise (Update)
• Model explorer public preview with
calculation group authoring and creating
relationships in the properties pane
• Edit your model in the PBI Service - Updates
Les Says: Its broke and
will @%#@% you up
Reporting Modeling
Service
Visualizations
Connectors
• Deployment Pipelines
• Customized stages 2-10
• Multi-tasking
• New entry point on main page
• Inforiver Enterprise – Writeback to Fabric
Lakehouse & Warehouse
• ValQ Plan
• Date Piker by Powerviz
• Drill Down Network PRO
4.
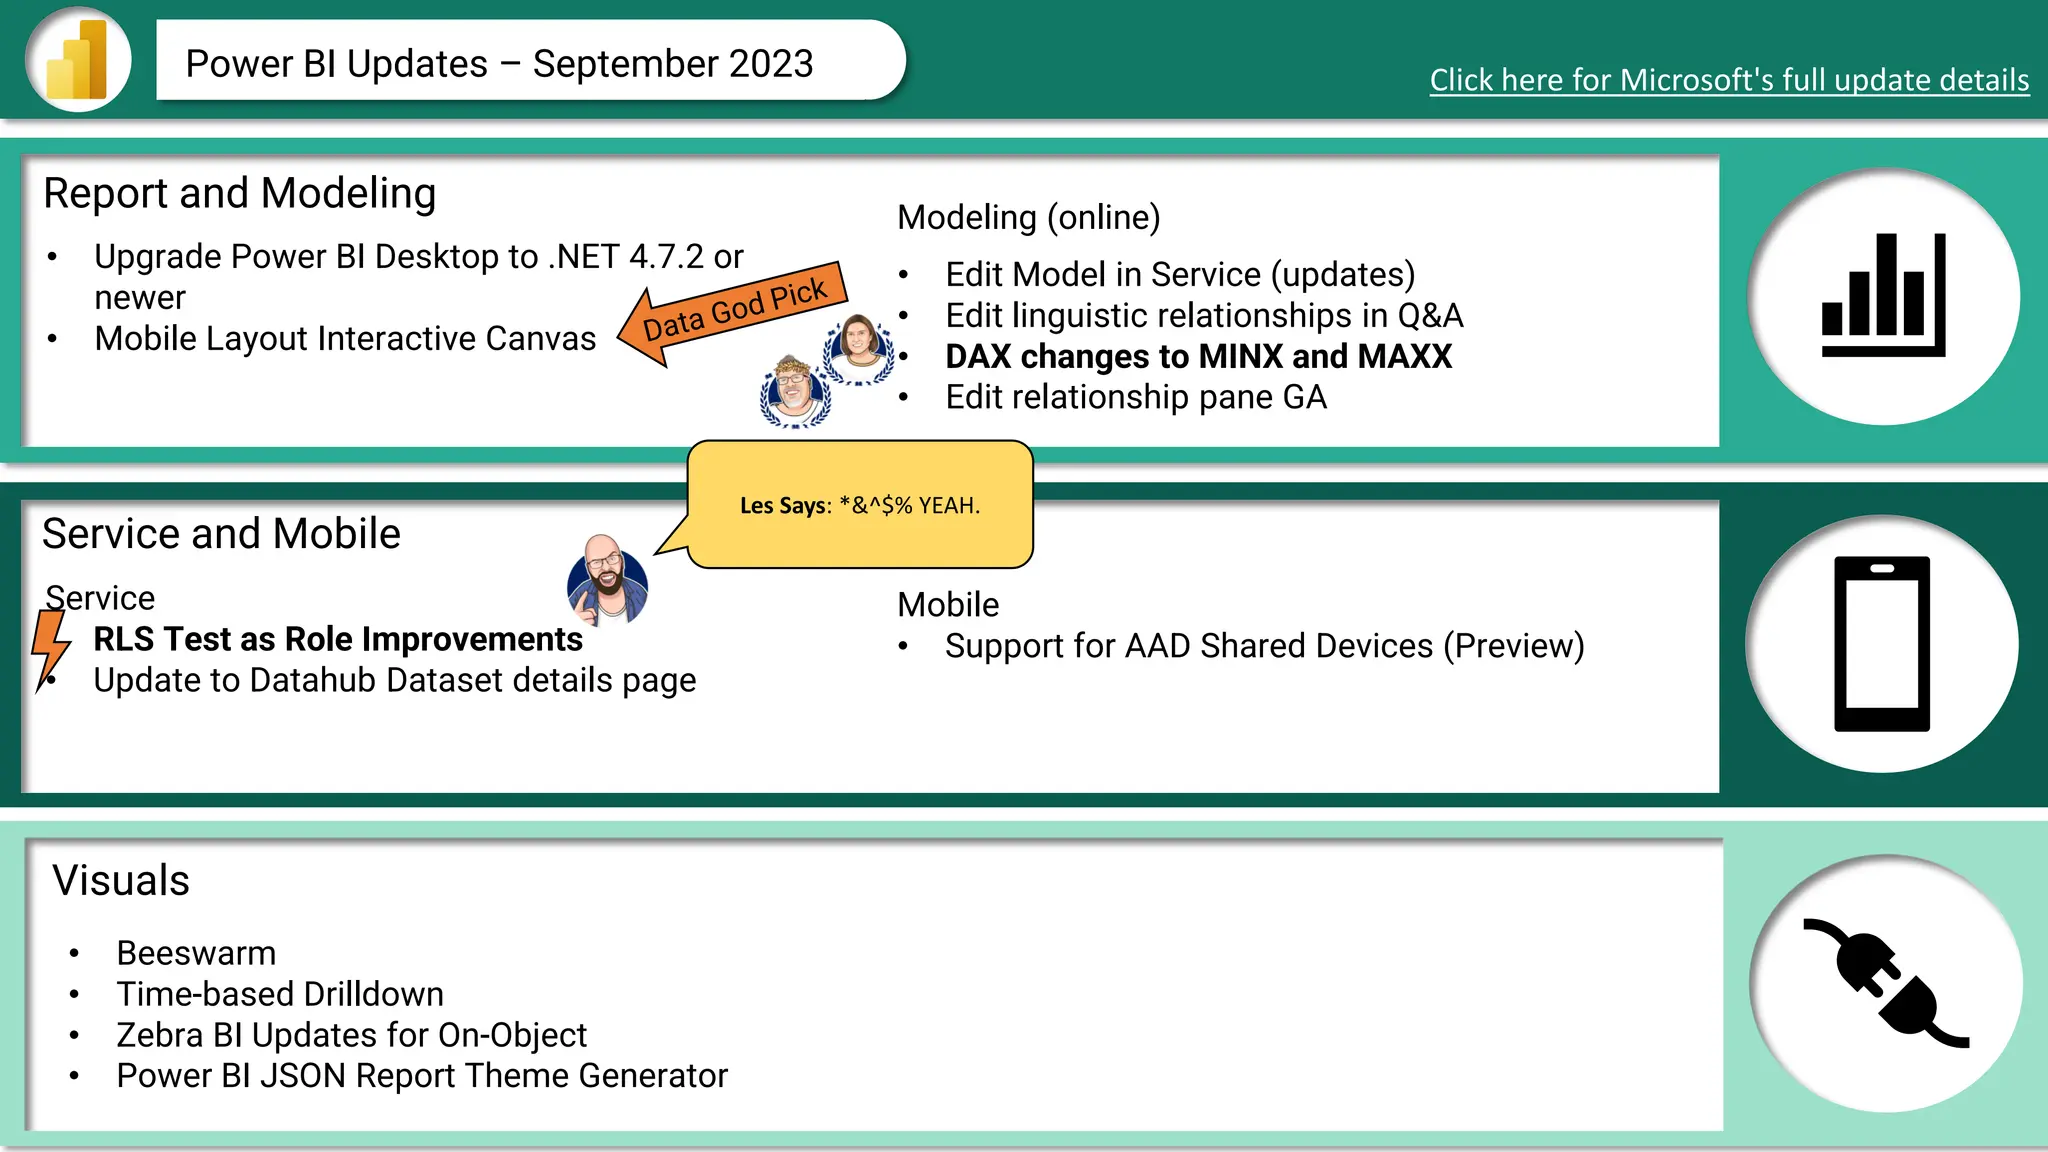
Power BI Updates– September 2023 Click here for Microsoft's full update details
• Upgrade Power BI Desktop to .NET 4.7.2 or
newer
• Mobile Layout Interactive Canvas
Service
• RLS Test as Role Improvements
• Update to Datahub Dataset details page
• Edit Model in Service (updates)
• Edit linguistic relationships in Q&A
• DAX changes to MINX and MAXX
• Edit relationship pane GA
Modeling (online)
Les Says: *&^$% YEAH.
Mobile
• Support for AAD Shared Devices (Preview)
• Beeswarm
• Time-based Drilldown
• Zebra BI Updates for On-Object
• Power BI JSON Report Theme Generator
Report and Modeling
Service and Mobile
Visuals
5.
Data Connectors
Report andVisuals
Service and Mobile
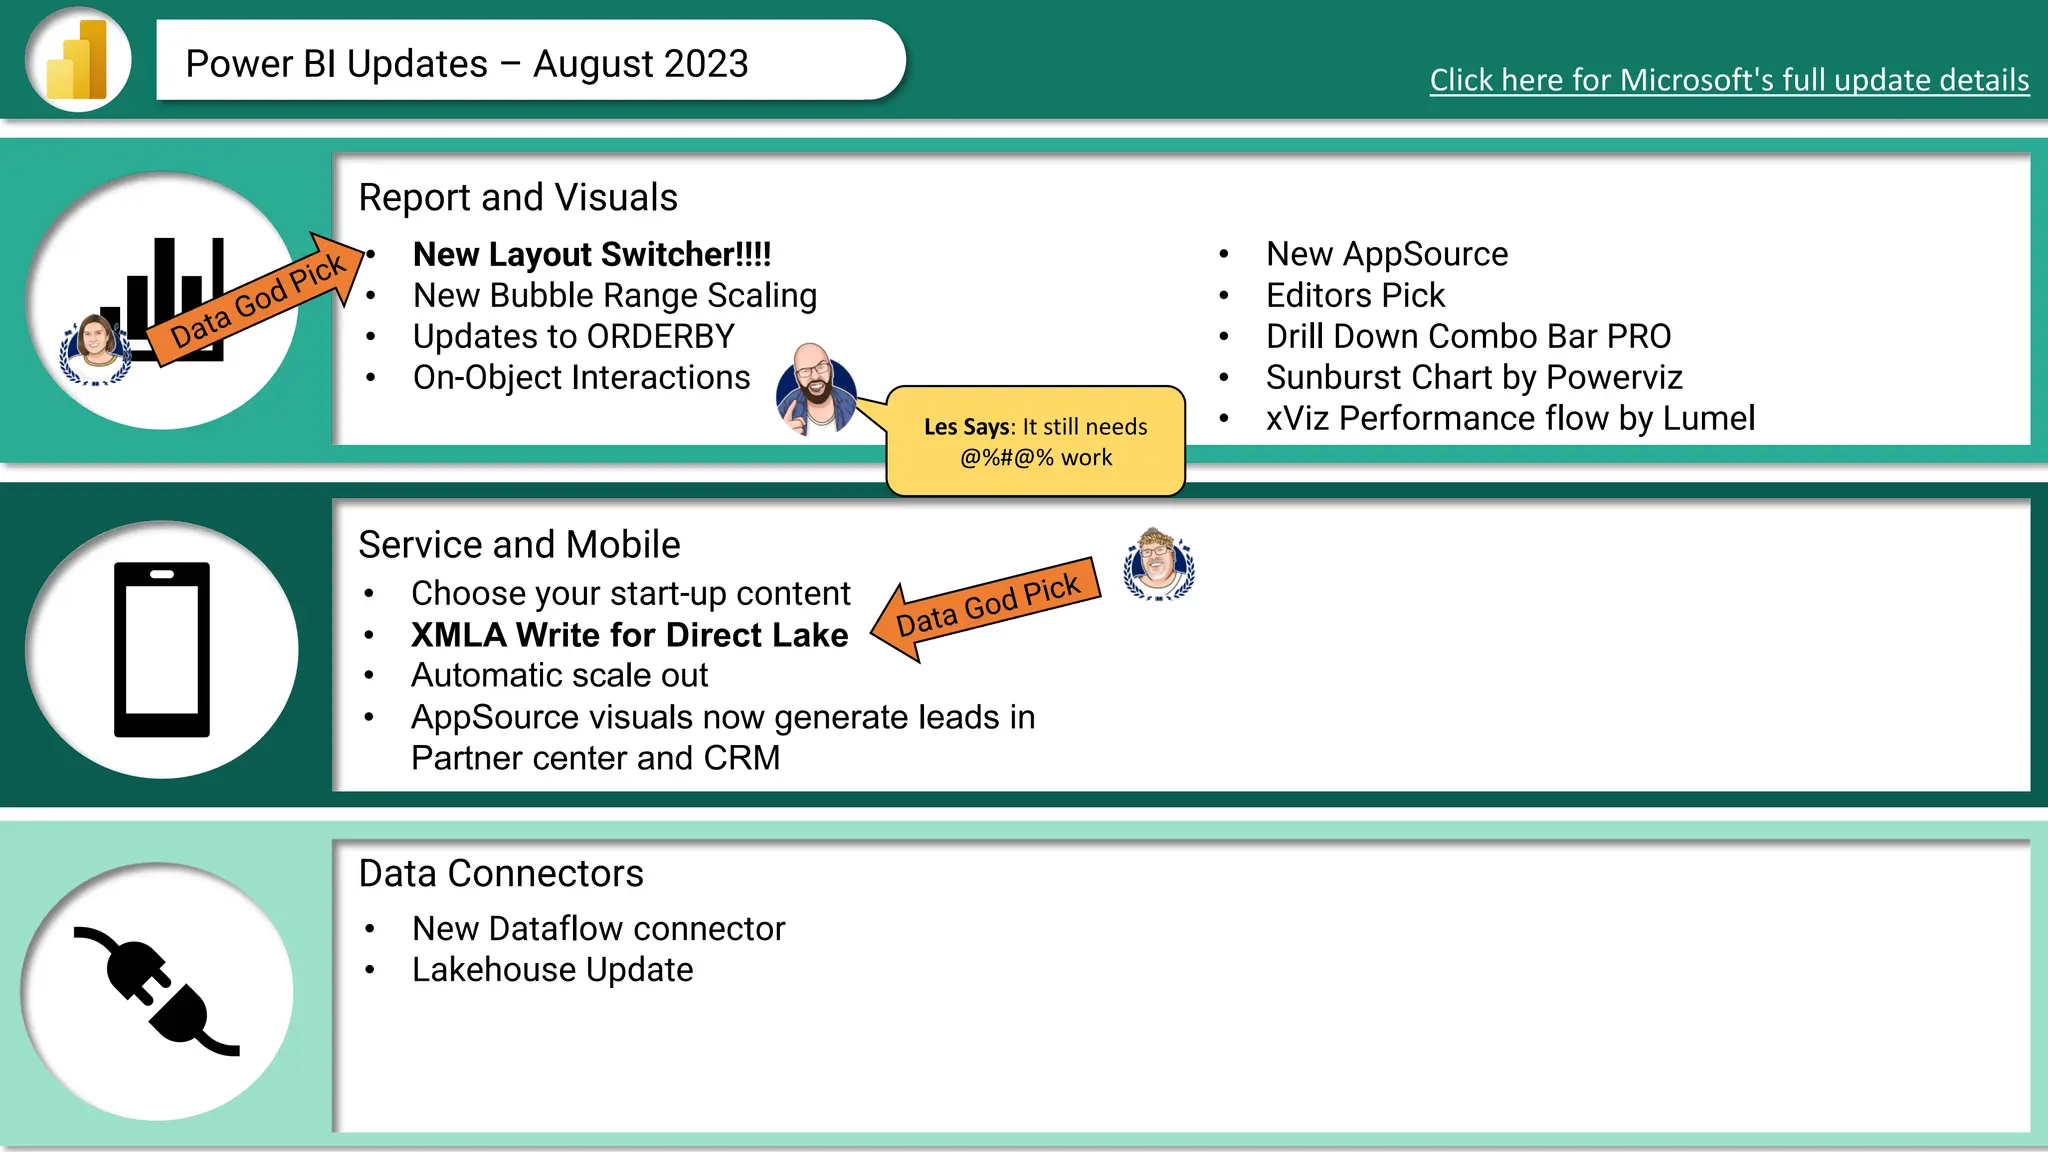
Power BI Updates – August 2023 Click here for Microsoft's full update details
• New Layout Switcher!!!!
• New Bubble Range Scaling
• Updates to ORDERBY
• On-Object Interactions
• Choose your start-up content
• XMLA Write for Direct Lake
• Automatic scale out
• AppSource visuals now generate leads in
Partner center and CRM
• New Dataflow connector
• Lakehouse Update
• New AppSource
• Editors Pick
• Drill Down Combo Bar PRO
• Sunburst Chart by Powerviz
• xViz Performance flow by Lumel
Les Says: It still needs
@%#@% work
6.
Data Connectors
Report andVisuals
Service and Mobile
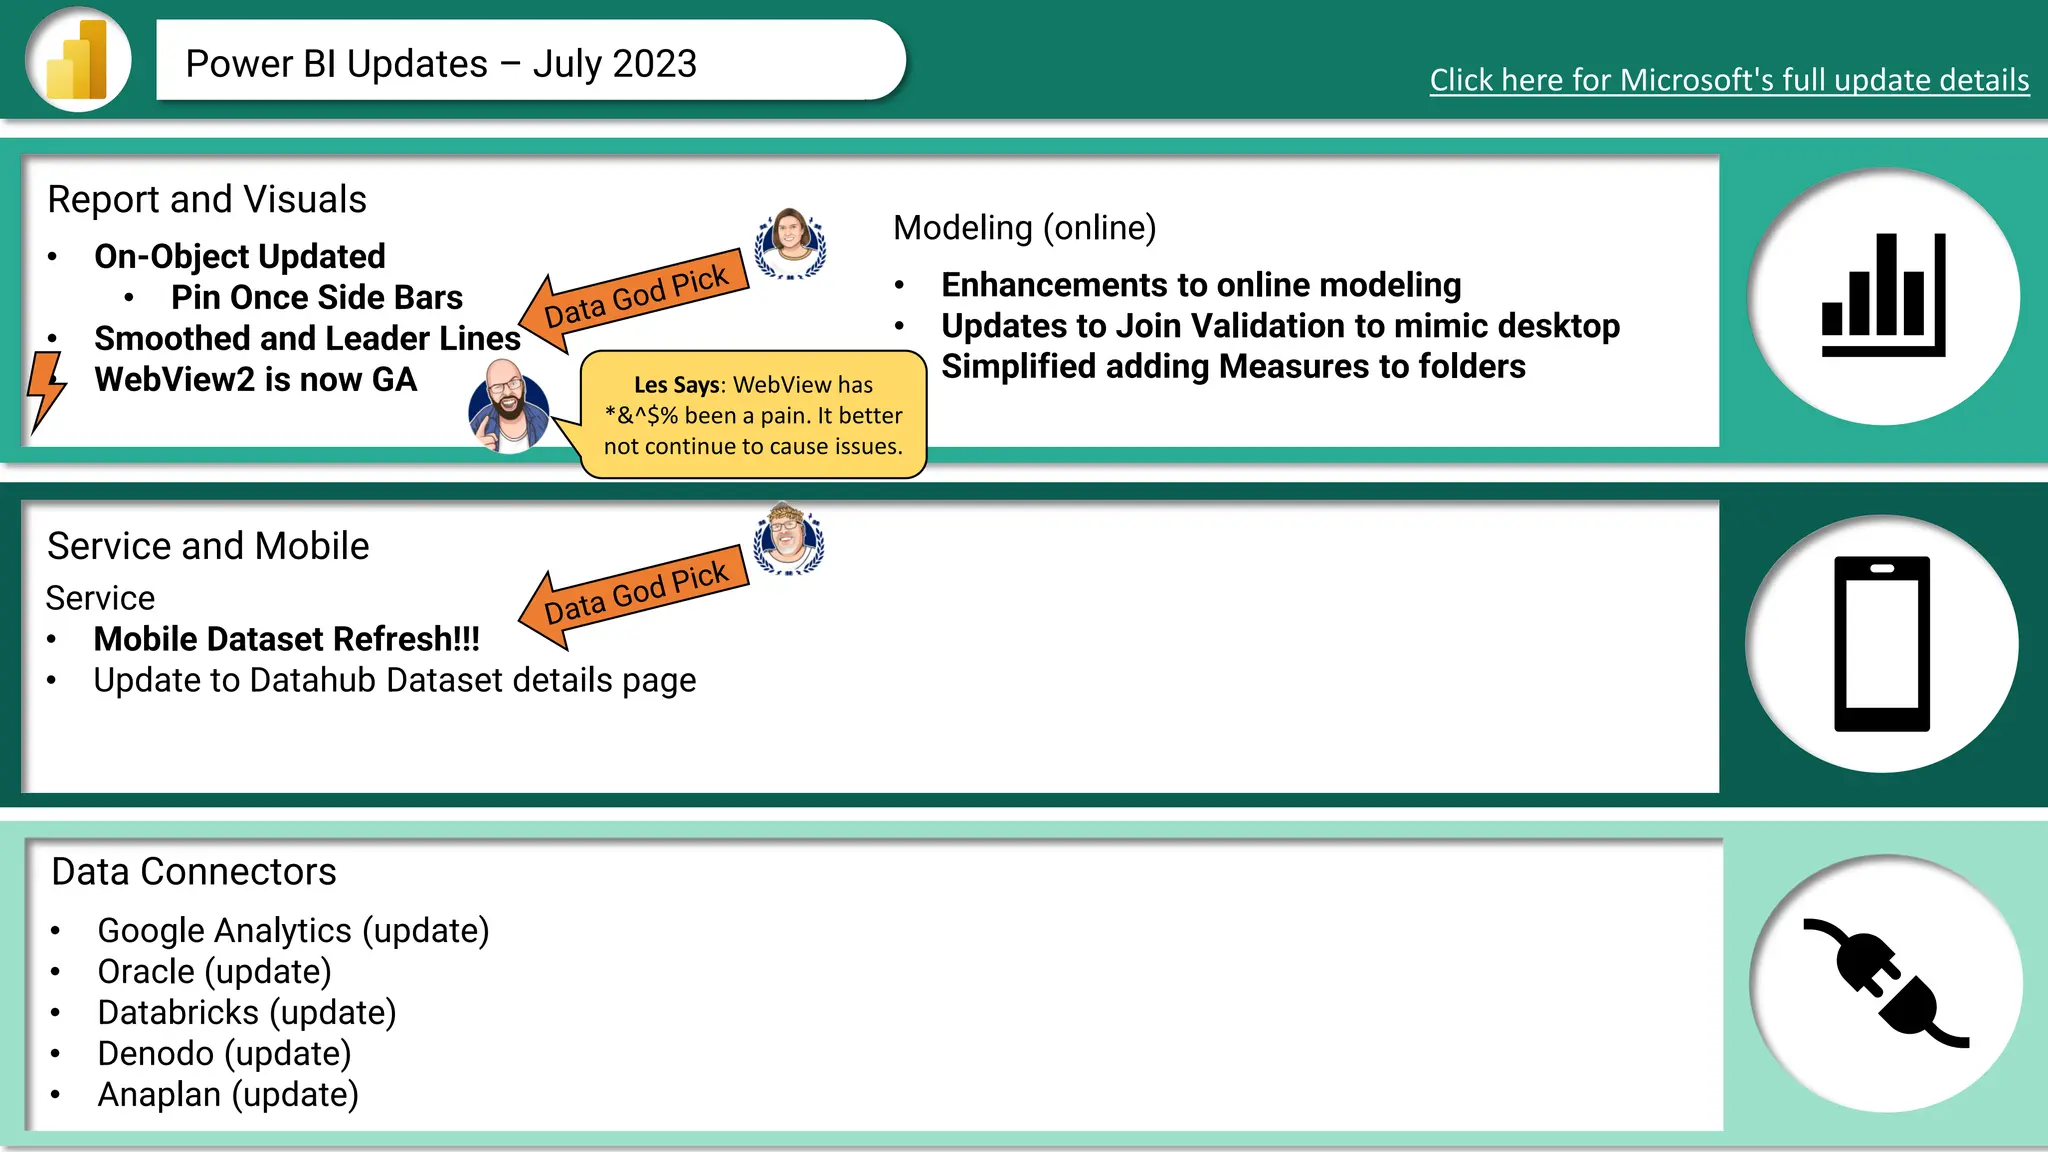
Power BI Updates – July 2023 Click here for Microsoft's full update details
• On-Object Updated
• Pin Once Side Bars
• Smoothed and Leader Lines
• WebView2 is now GA
Service
• Mobile Dataset Refresh!!!
• Update to Datahub Dataset details page
• Google Analytics (update)
• Oracle (update)
• Databricks (update)
• Denodo (update)
• Anaplan (update)
• Enhancements to online modeling
• Updates to Join Validation to mimic desktop
• Simplified adding Measures to folders
Modeling (online)
Les Says: WebView has
*&^$% been a pain. It better
not continue to cause issues.
7.
Data Connectors
Report andVisuals
Service and Mobile
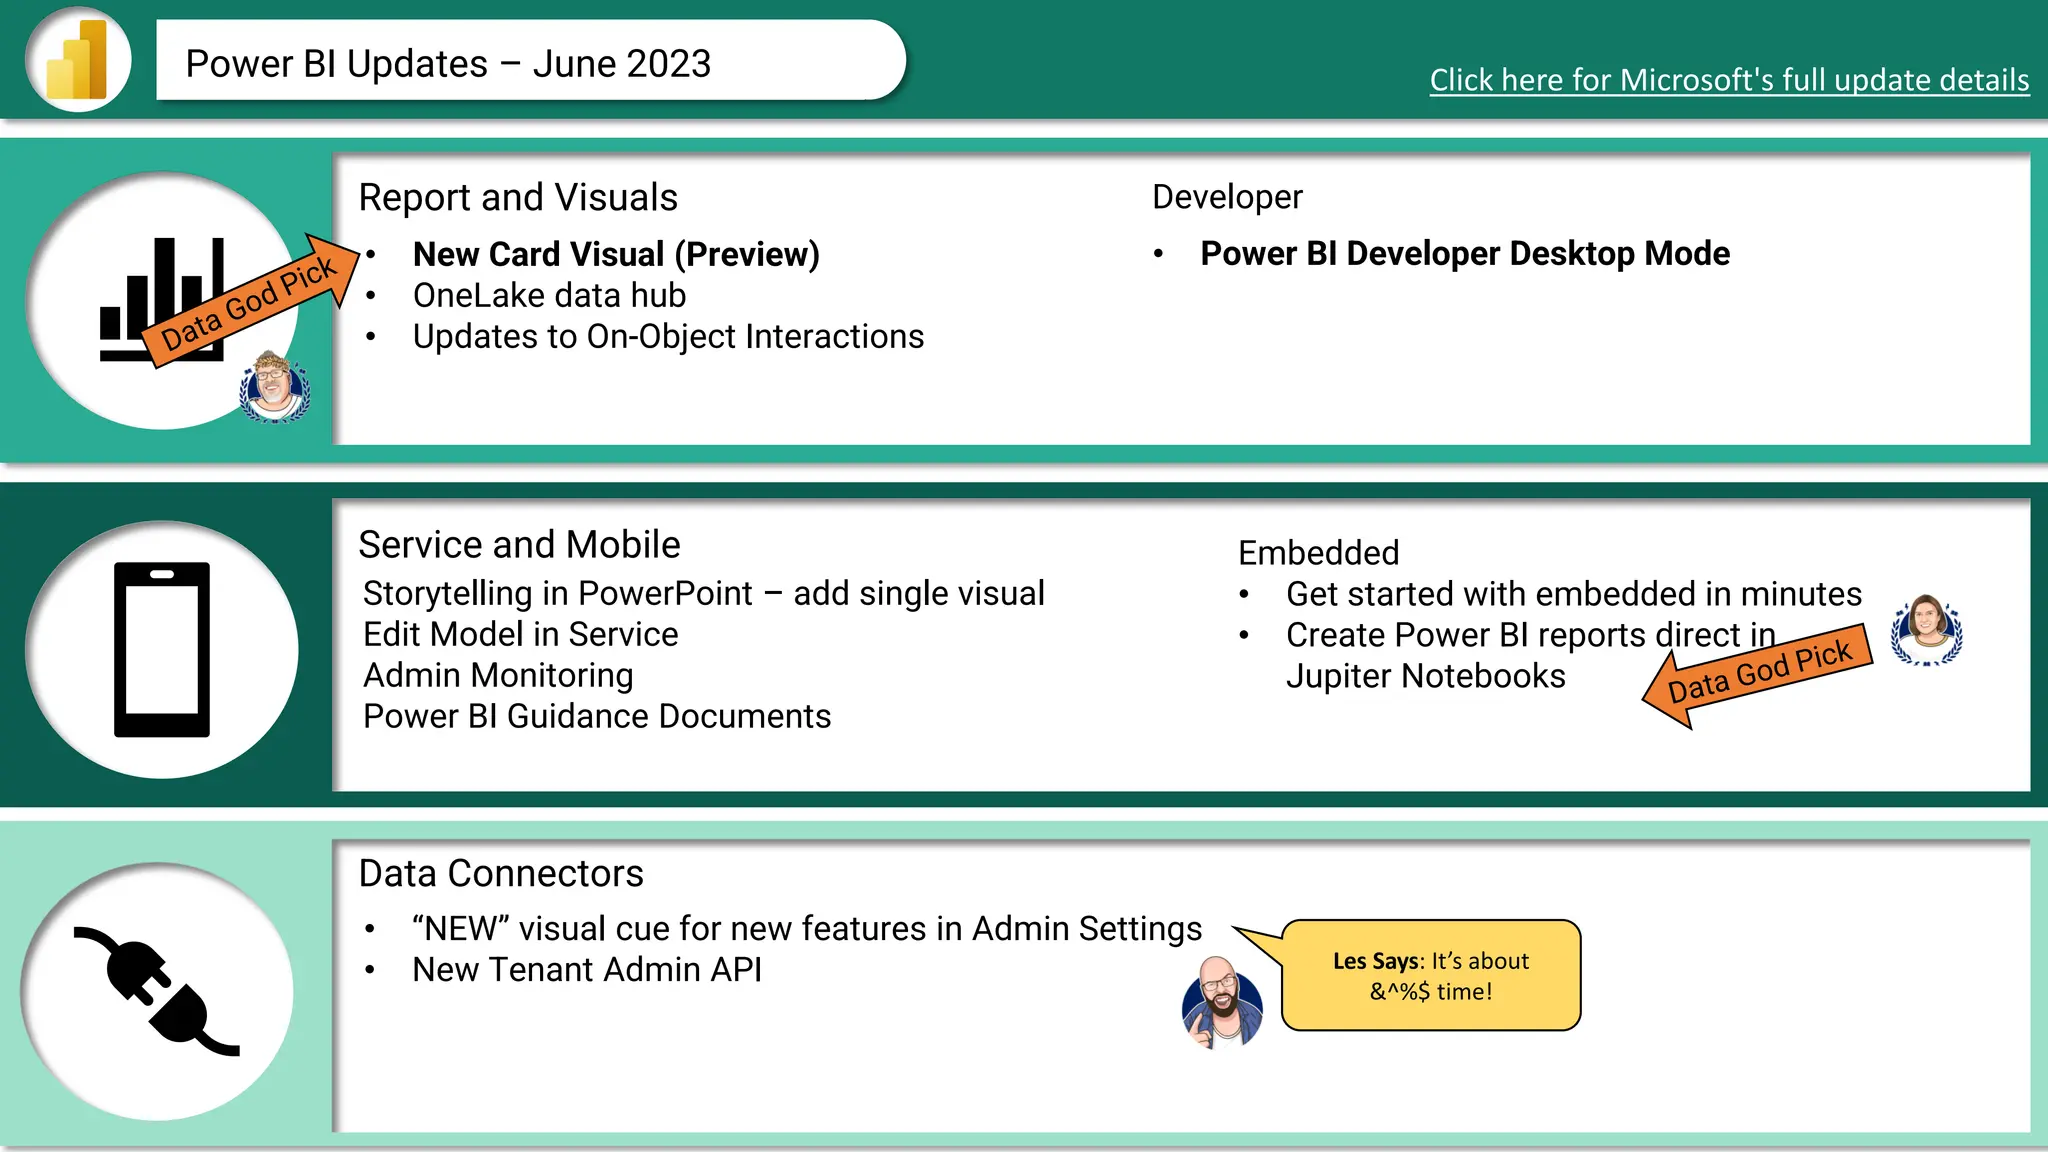
Power BI Updates – June 2023 Click here for Microsoft's full update details
• New Card Visual (Preview)
• OneLake data hub
• Updates to On-Object Interactions
Storytelling in PowerPoint – add single visual
Edit Model in Service
Admin Monitoring
Power BI Guidance Documents
• Power BI Developer Desktop Mode
• “NEW” visual cue for new features in Admin Settings
• New Tenant Admin API
Developer
Embedded
• Get started with embedded in minutes
• Create Power BI reports direct in
Jupiter Notebooks
Les Says: It’s about
&^%$ time!
8.
Data Connectors
Report andVisuals
Service and Mobile
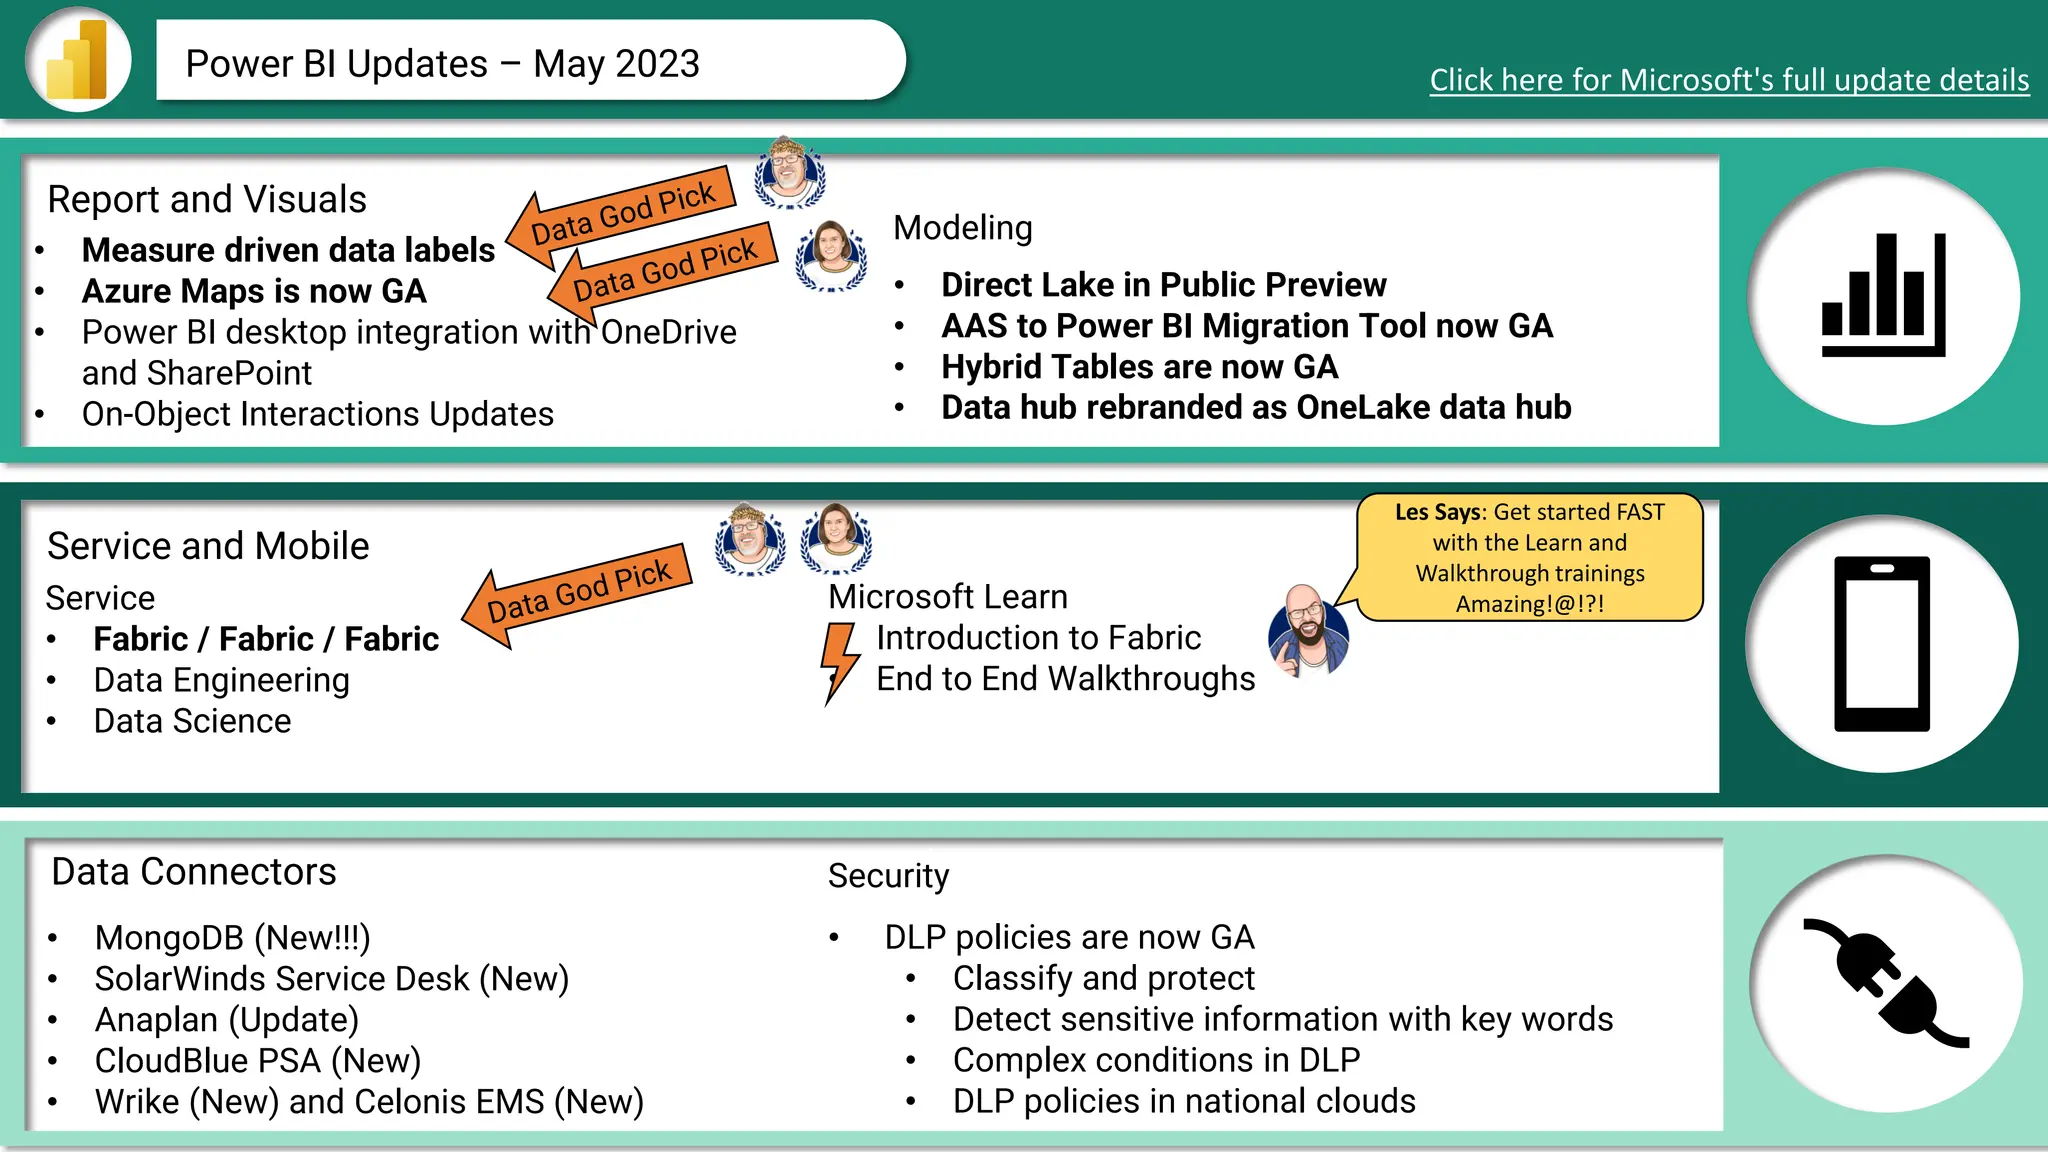
Power BI Updates – May 2023 Click here for Microsoft's full update details
• Measure driven data labels
• Azure Maps is now GA
• Power BI desktop integration with OneDrive
and SharePoint
• On-Object Interactions Updates
Service
• Fabric / Fabric / Fabric
• Data Engineering
• Data Science
• MongoDB (New!!!)
• SolarWinds Service Desk (New)
• Anaplan (Update)
• CloudBlue PSA (New)
• Wrike (New) and Celonis EMS (New)
Microsoft Learn
• Introduction to Fabric
• End to End Walkthroughs
• Direct Lake in Public Preview
• AAS to Power BI Migration Tool now GA
• Hybrid Tables are now GA
• Data hub rebranded as OneLake data hub
Modeling
Security
• DLP policies are now GA
• Classify and protect
• Detect sensitive information with key words
• Complex conditions in DLP
• DLP policies in national clouds
Les Says: Get started FAST
with the Learn and
Walkthrough trainings
Amazing!@!?!
9.
Data Connectors
Report andVisuals
Service and Mobile
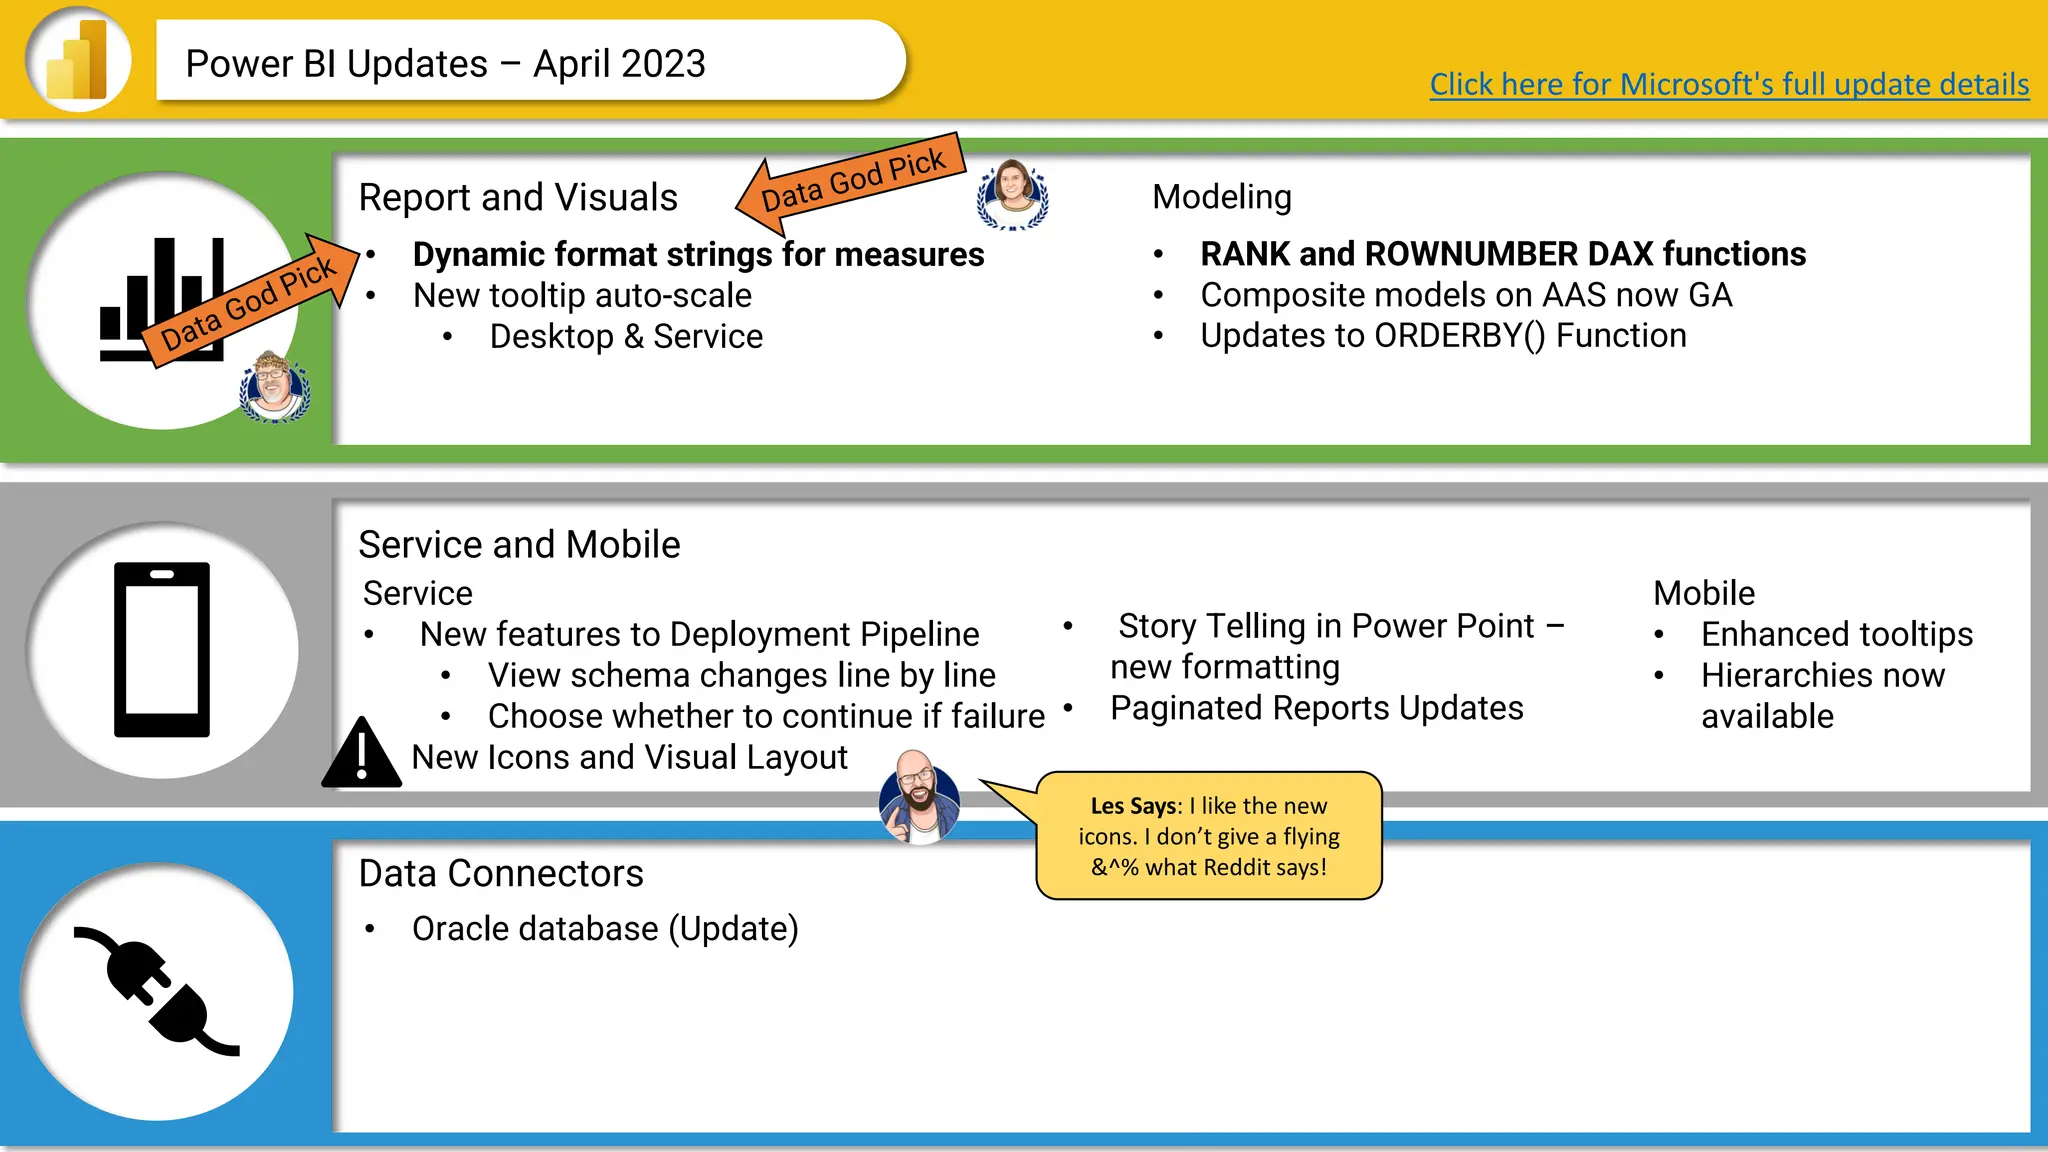
Power BI Updates – April 2023
• Dynamic format strings for measures
• New tooltip auto-scale
• Desktop & Service
Service
• New features to Deployment Pipeline
• View schema changes line by line
• Choose whether to continue if failure
• New Icons and Visual Layout
• RANK and ROWNUMBER DAX functions
• Composite models on AAS now GA
• Updates to ORDERBY() Function
Click here for Microsoft's full update details
• Oracle database (Update)
Modeling
Mobile
• Enhanced tooltips
• Hierarchies now
available
Les Says: I like the new
icons. I don’t give a flying
&^% what Reddit says!
• Story Telling in Power Point –
new formatting
• Paginated Reports Updates
10.
Data Connectors
Report andVisuals
Service and Mobile
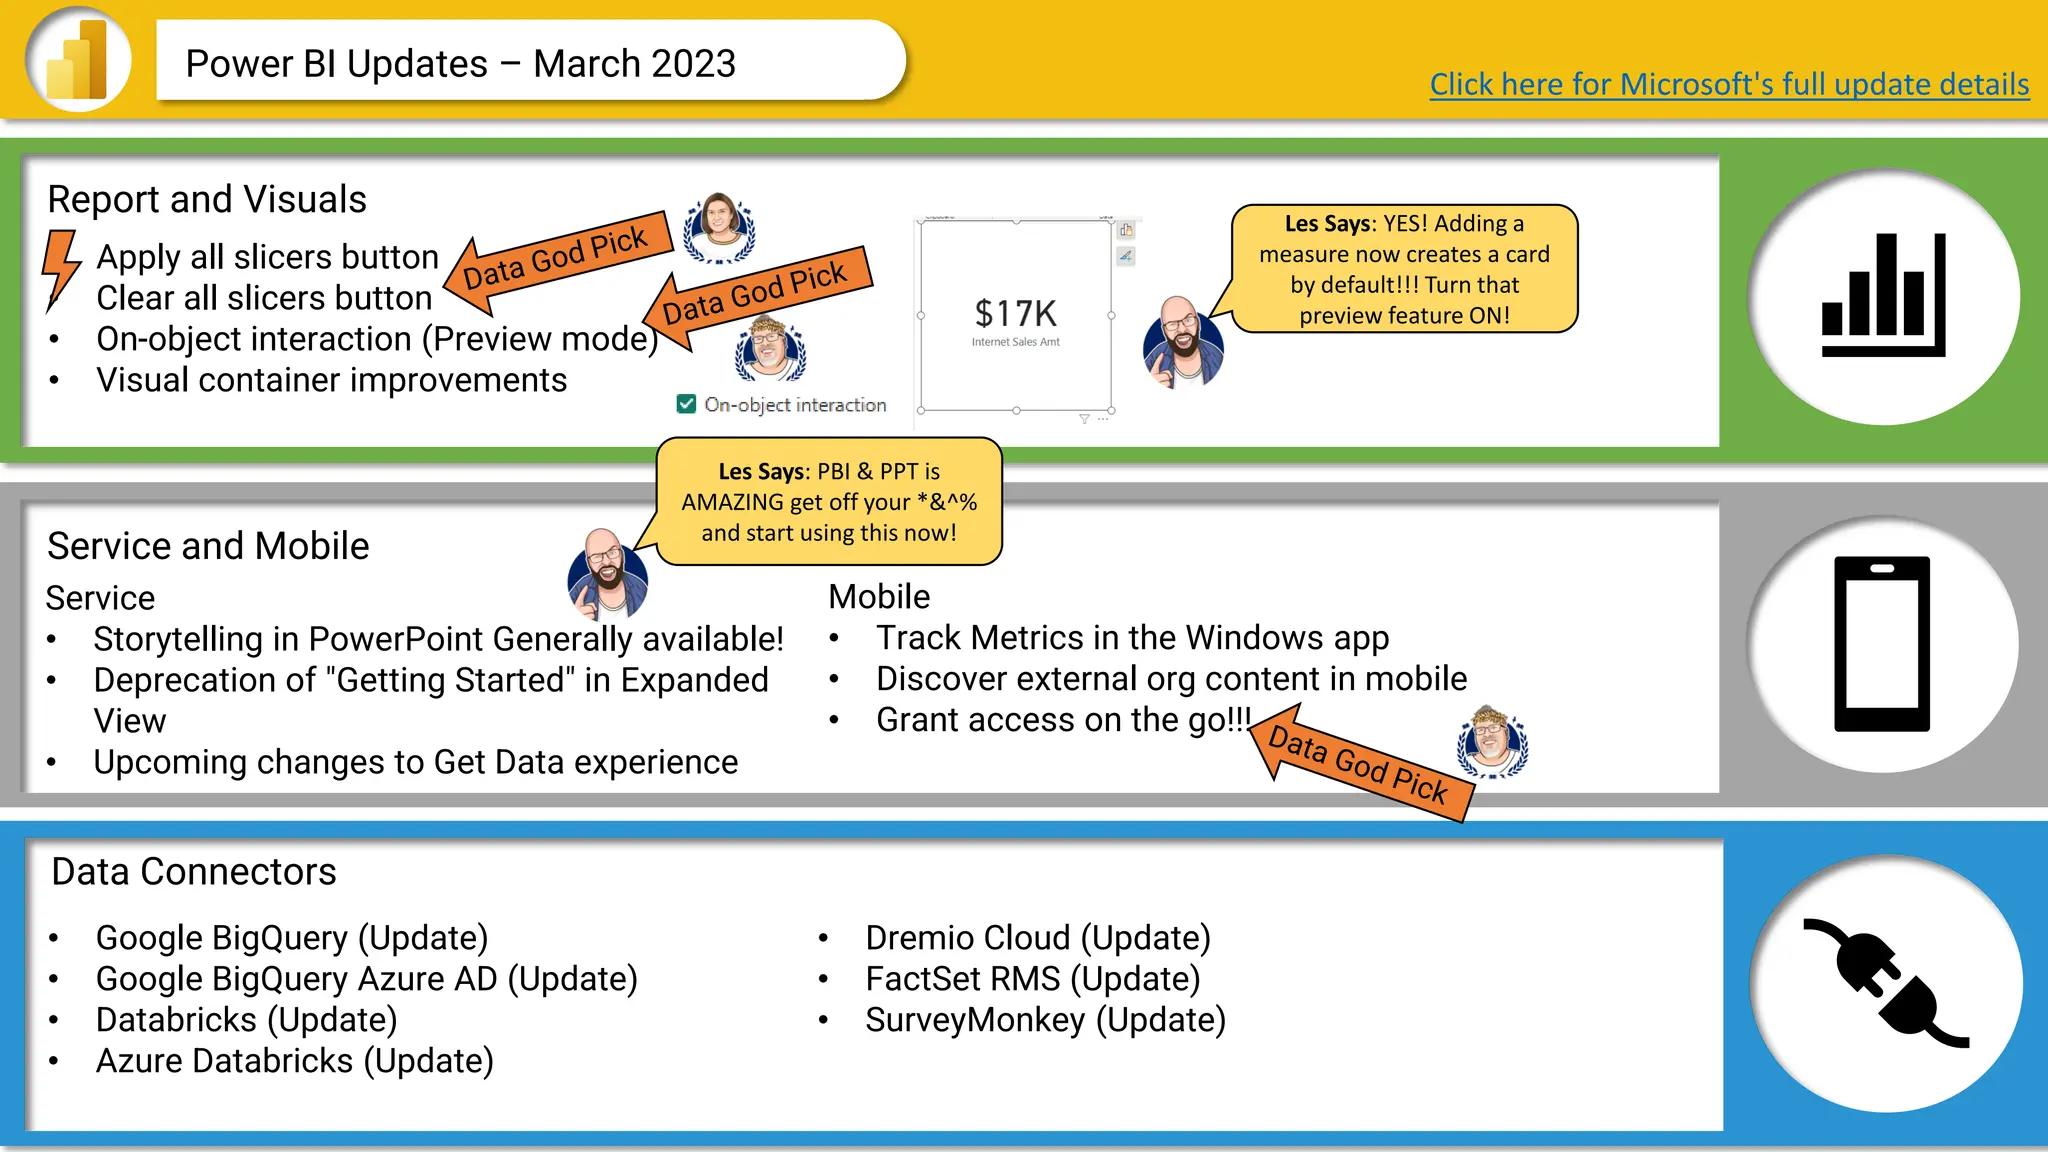
Power BI Updates – March 2023 Click here for Microsoft's full update details
• Apply all slicers button
• Clear all slicers button
• On-object interaction (Preview mode)
• Visual container improvements
Service
• Storytelling in PowerPoint Generally available!
• Deprecation of "Getting Started" in Expanded
View
• Upcoming changes to Get Data experience
• Google BigQuery (Update)
• Google BigQuery Azure AD (Update)
• Databricks (Update)
• Azure Databricks (Update)
• Dremio Cloud (Update)
• FactSet RMS (Update)
• SurveyMonkey (Update)
Mobile
• Track Metrics in the Windows app
• Discover external org content in mobile
• Grant access on the go!!!
Les Says: PBI & PPT is
AMAZING get off your *&^%
and start using this now!
Les Says: YES! Adding a
measure now creates a card
by default!!! Turn that
preview feature ON!
11.
Data Connectors
Report andVisuals
Service and Mobile
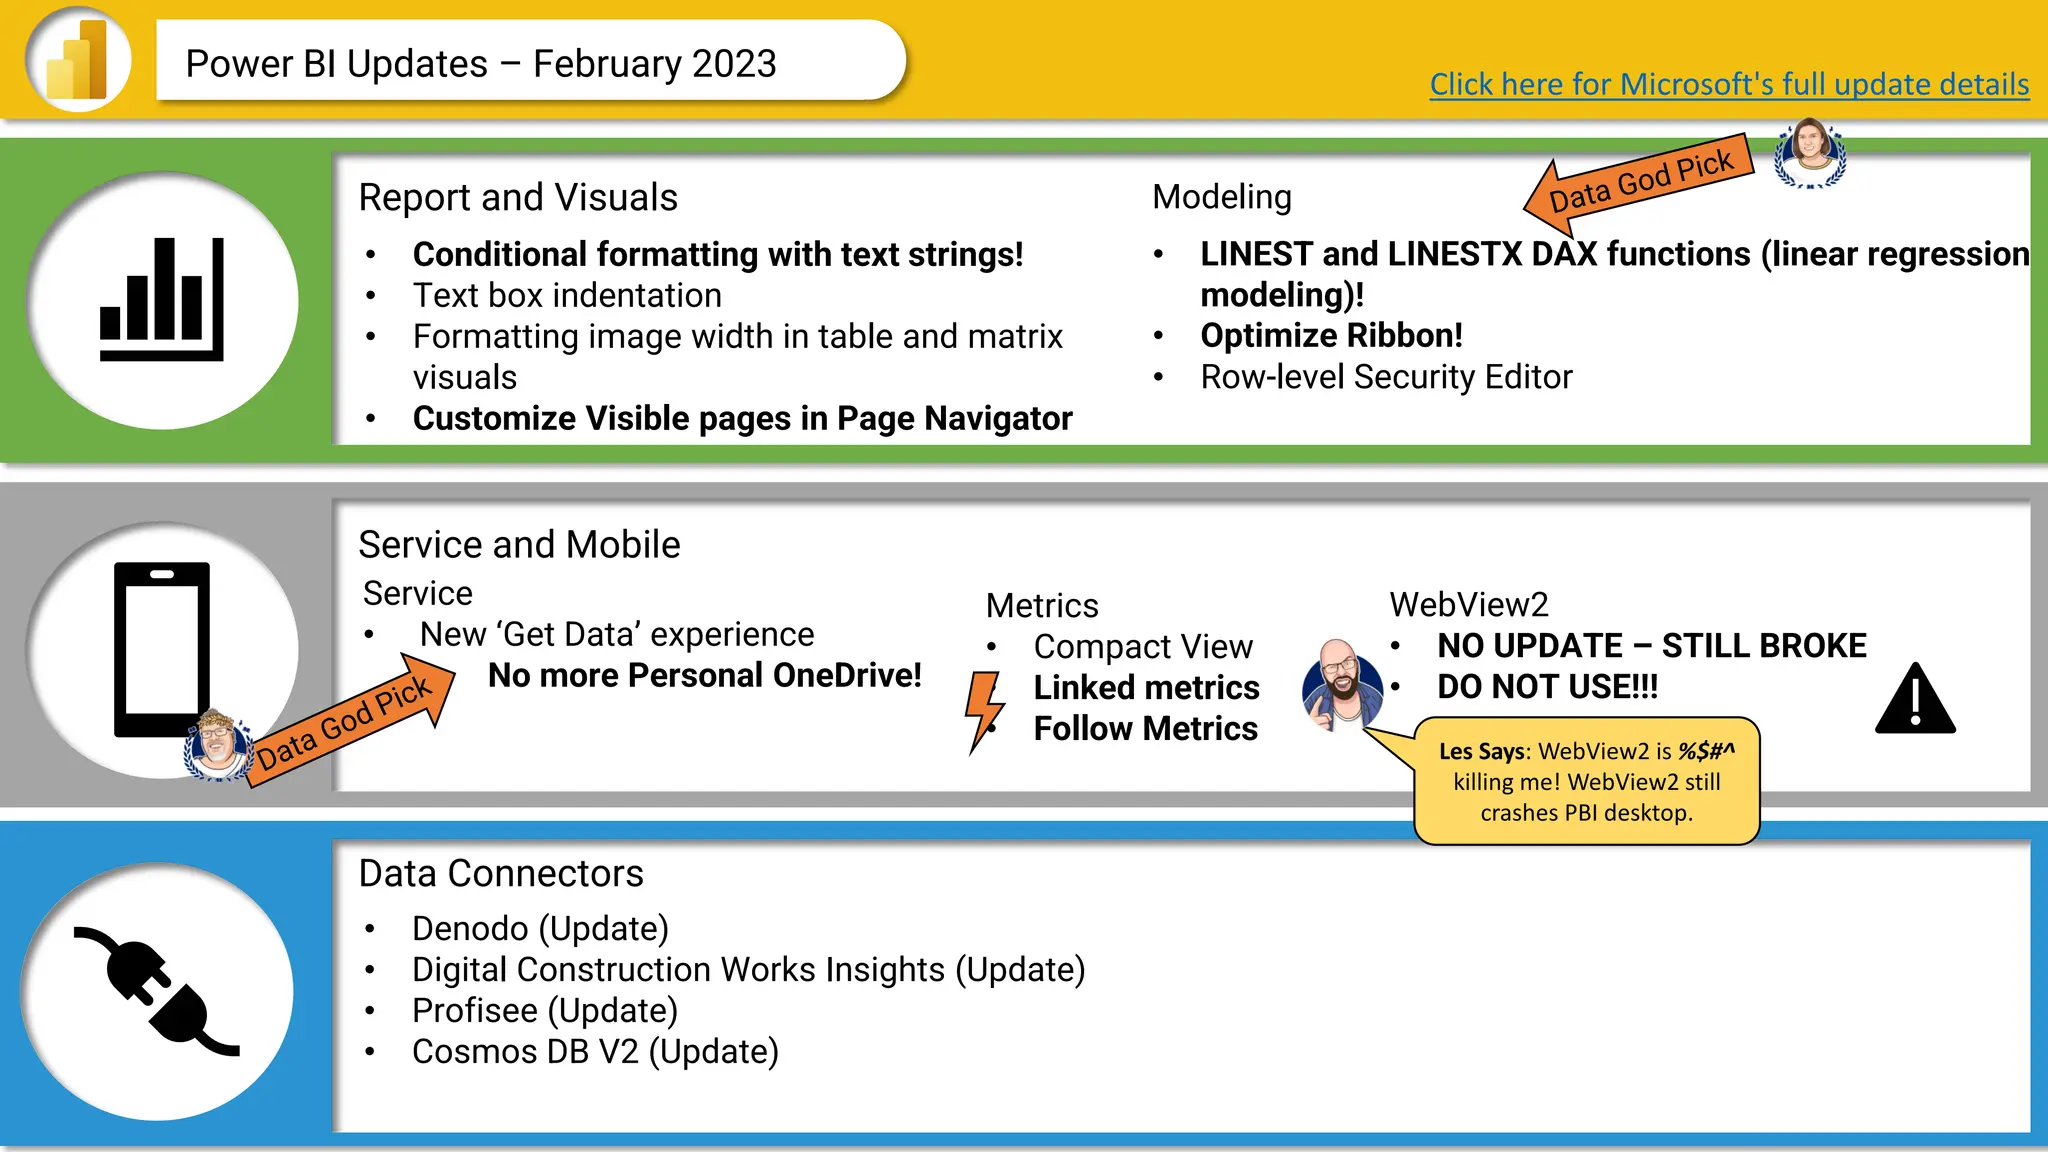
Power BI Updates – February 2023
• Conditional formatting with text strings!
• Text box indentation
• Formatting image width in table and matrix
visuals
• Customize Visible pages in Page Navigator
Service
• New ‘Get Data’ experience
• No more Personal OneDrive!
• LINEST and LINESTX DAX functions (linear regression
modeling)!
• Optimize Ribbon!
• Row-level Security Editor
Metrics
• Compact View
• Linked metrics
• Follow Metrics
Click here for Microsoft's full update details
• Denodo (Update)
• Digital Construction Works Insights (Update)
• Profisee (Update)
• Cosmos DB V2 (Update)
Modeling
WebView2
• NO UPDATE – STILL BROKE
• DO NOT USE!!!
Les Says: WebView2 is %$#^
killing me! WebView2 still
crashes PBI desktop.
12.
January 2023: TheMicrosoft Power BI team
is taking a much-deserved break this month!
13.
Data Connectors
Report andVisuals
Service and Mobile
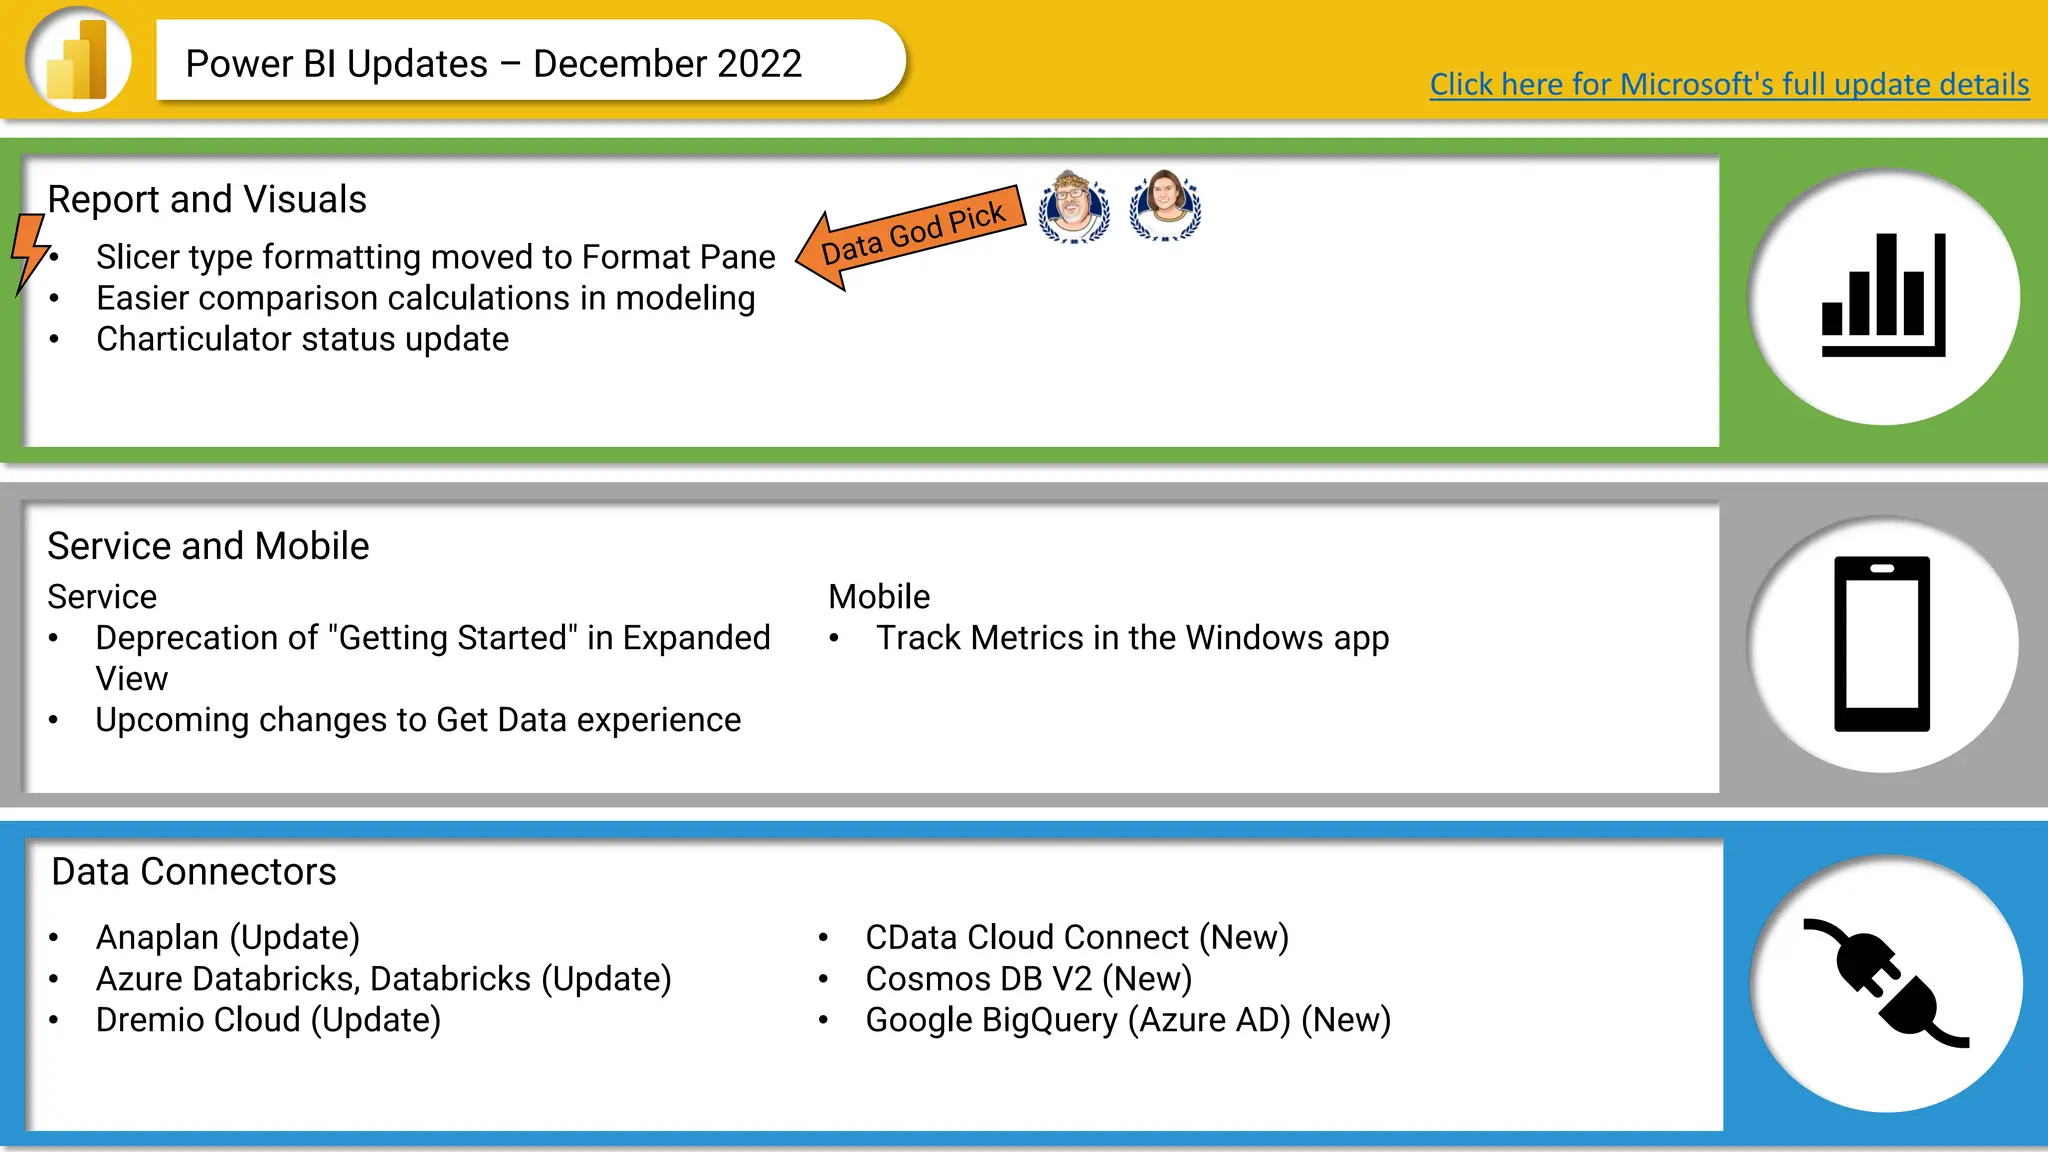
Power BI Updates – December 2022 Click here for Microsoft's full update details
• Slicer type formatting moved to Format Pane
• Easier comparison calculations in modeling
• Charticulator status update
Service
• Deprecation of "Getting Started" in Expanded
View
• Upcoming changes to Get Data experience
• Anaplan (Update)
• Azure Databricks, Databricks (Update)
• Dremio Cloud (Update)
• CData Cloud Connect (New)
• Cosmos DB V2 (New)
• Google BigQuery (Azure AD) (New)
Mobile
• Track Metrics in the Windows app
14.
Data Connectors
Report andVisuals
Service and Mobile
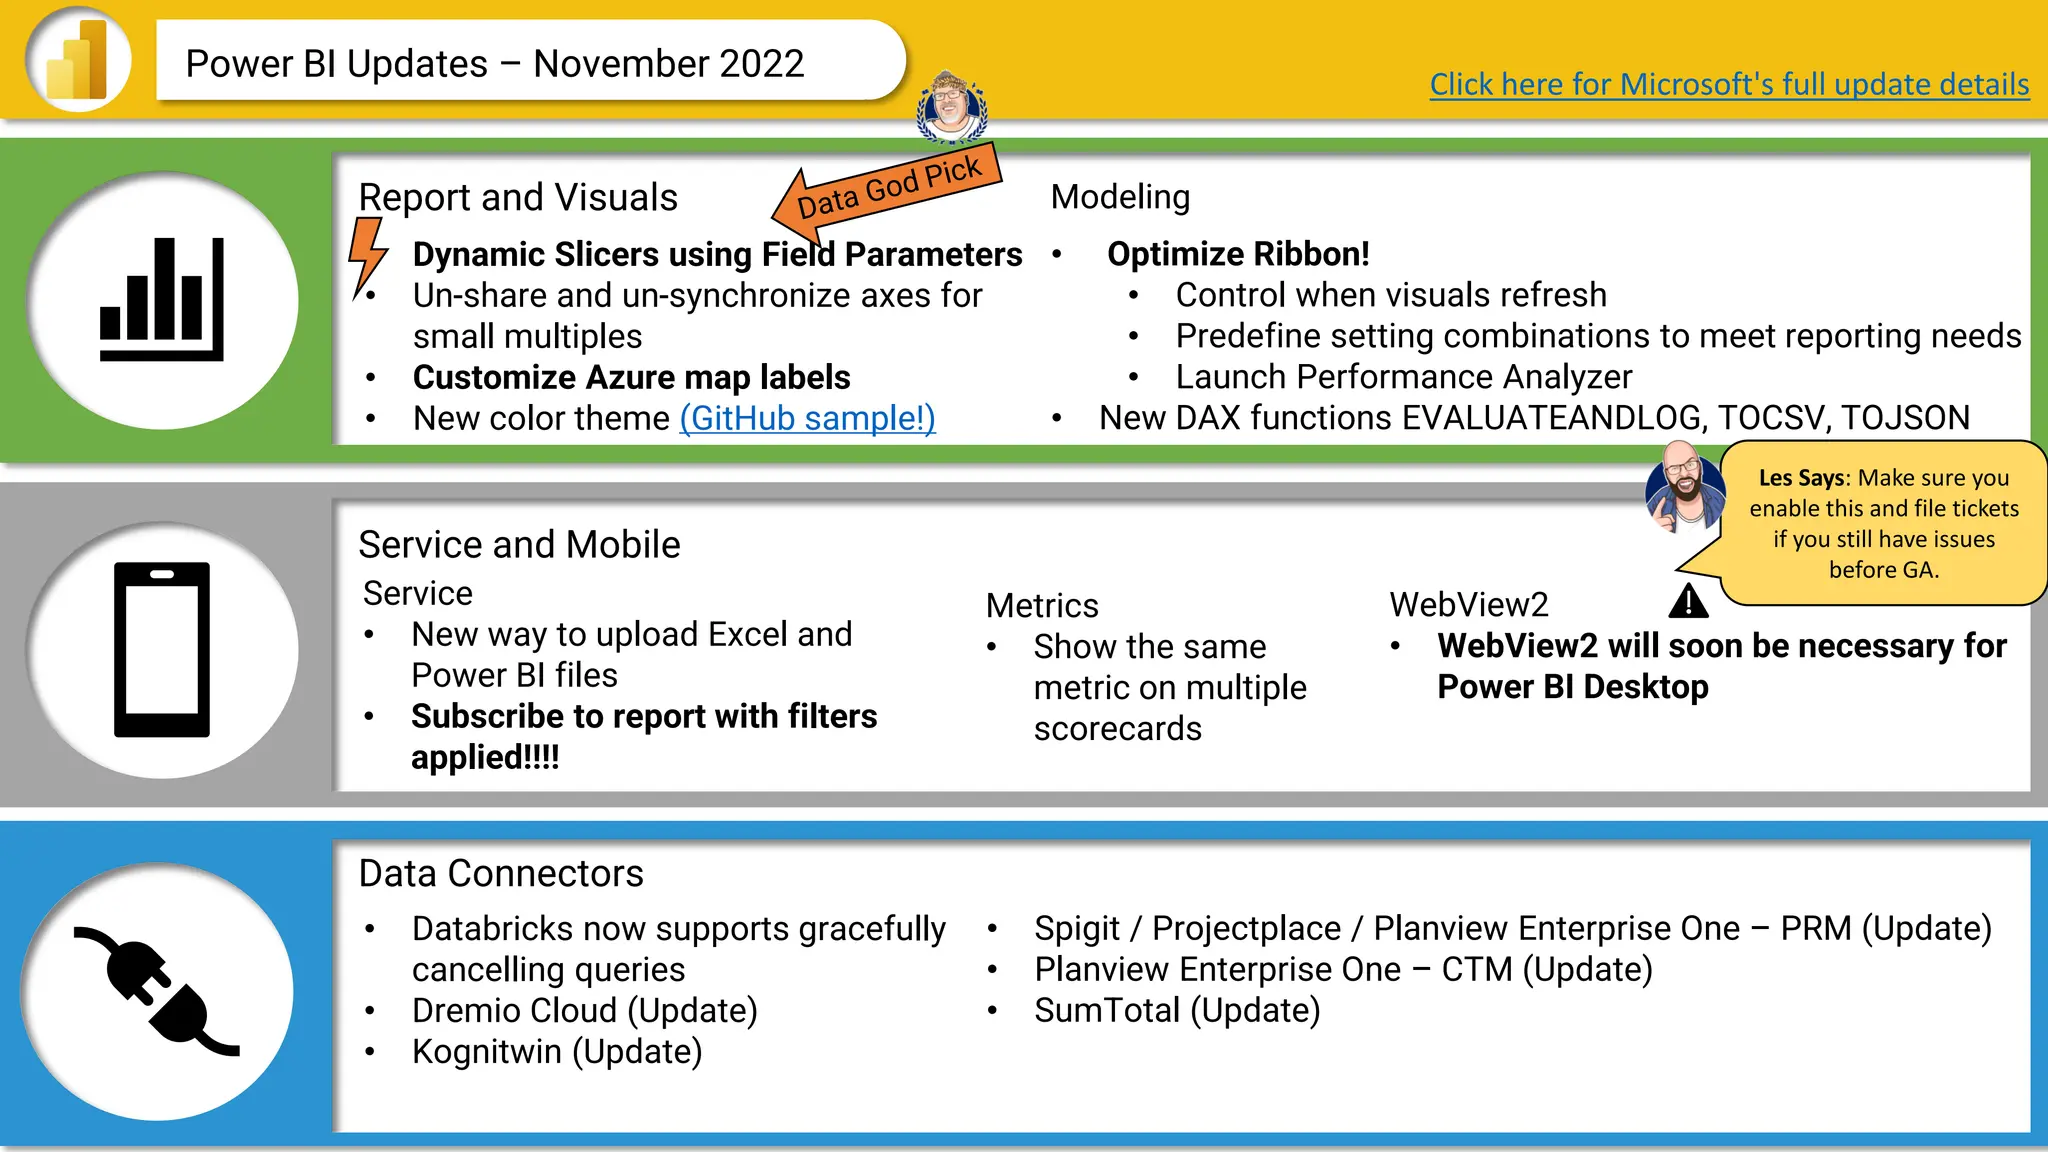
Power BI Updates – November 2022
• Dynamic Slicers using Field Parameters
• Un-share and un-synchronize axes for
small multiples
• Customize Azure map labels
• New color theme (GitHub sample!)
Service
• New way to upload Excel and
Power BI files
• Subscribe to report with filters
applied!!!!
• Optimize Ribbon!
• Control when visuals refresh
• Predefine setting combinations to meet reporting needs
• Launch Performance Analyzer
• New DAX functions EVALUATEANDLOG, TOCSV, TOJSON
Metrics
• Show the same
metric on multiple
scorecards
Click here for Microsoft's full update details
• Databricks now supports gracefully
cancelling queries
• Dremio Cloud (Update)
• Kognitwin (Update)
Modeling
WebView2
• WebView2 will soon be necessary for
Power BI Desktop
• Spigit / Projectplace / Planview Enterprise One – PRM (Update)
• Planview Enterprise One – CTM (Update)
• SumTotal (Update)
Les Says: Make sure you
enable this and file tickets
if you still have issues
before GA.
15.
Data Connectors
Report andVisuals
Service and Mobile
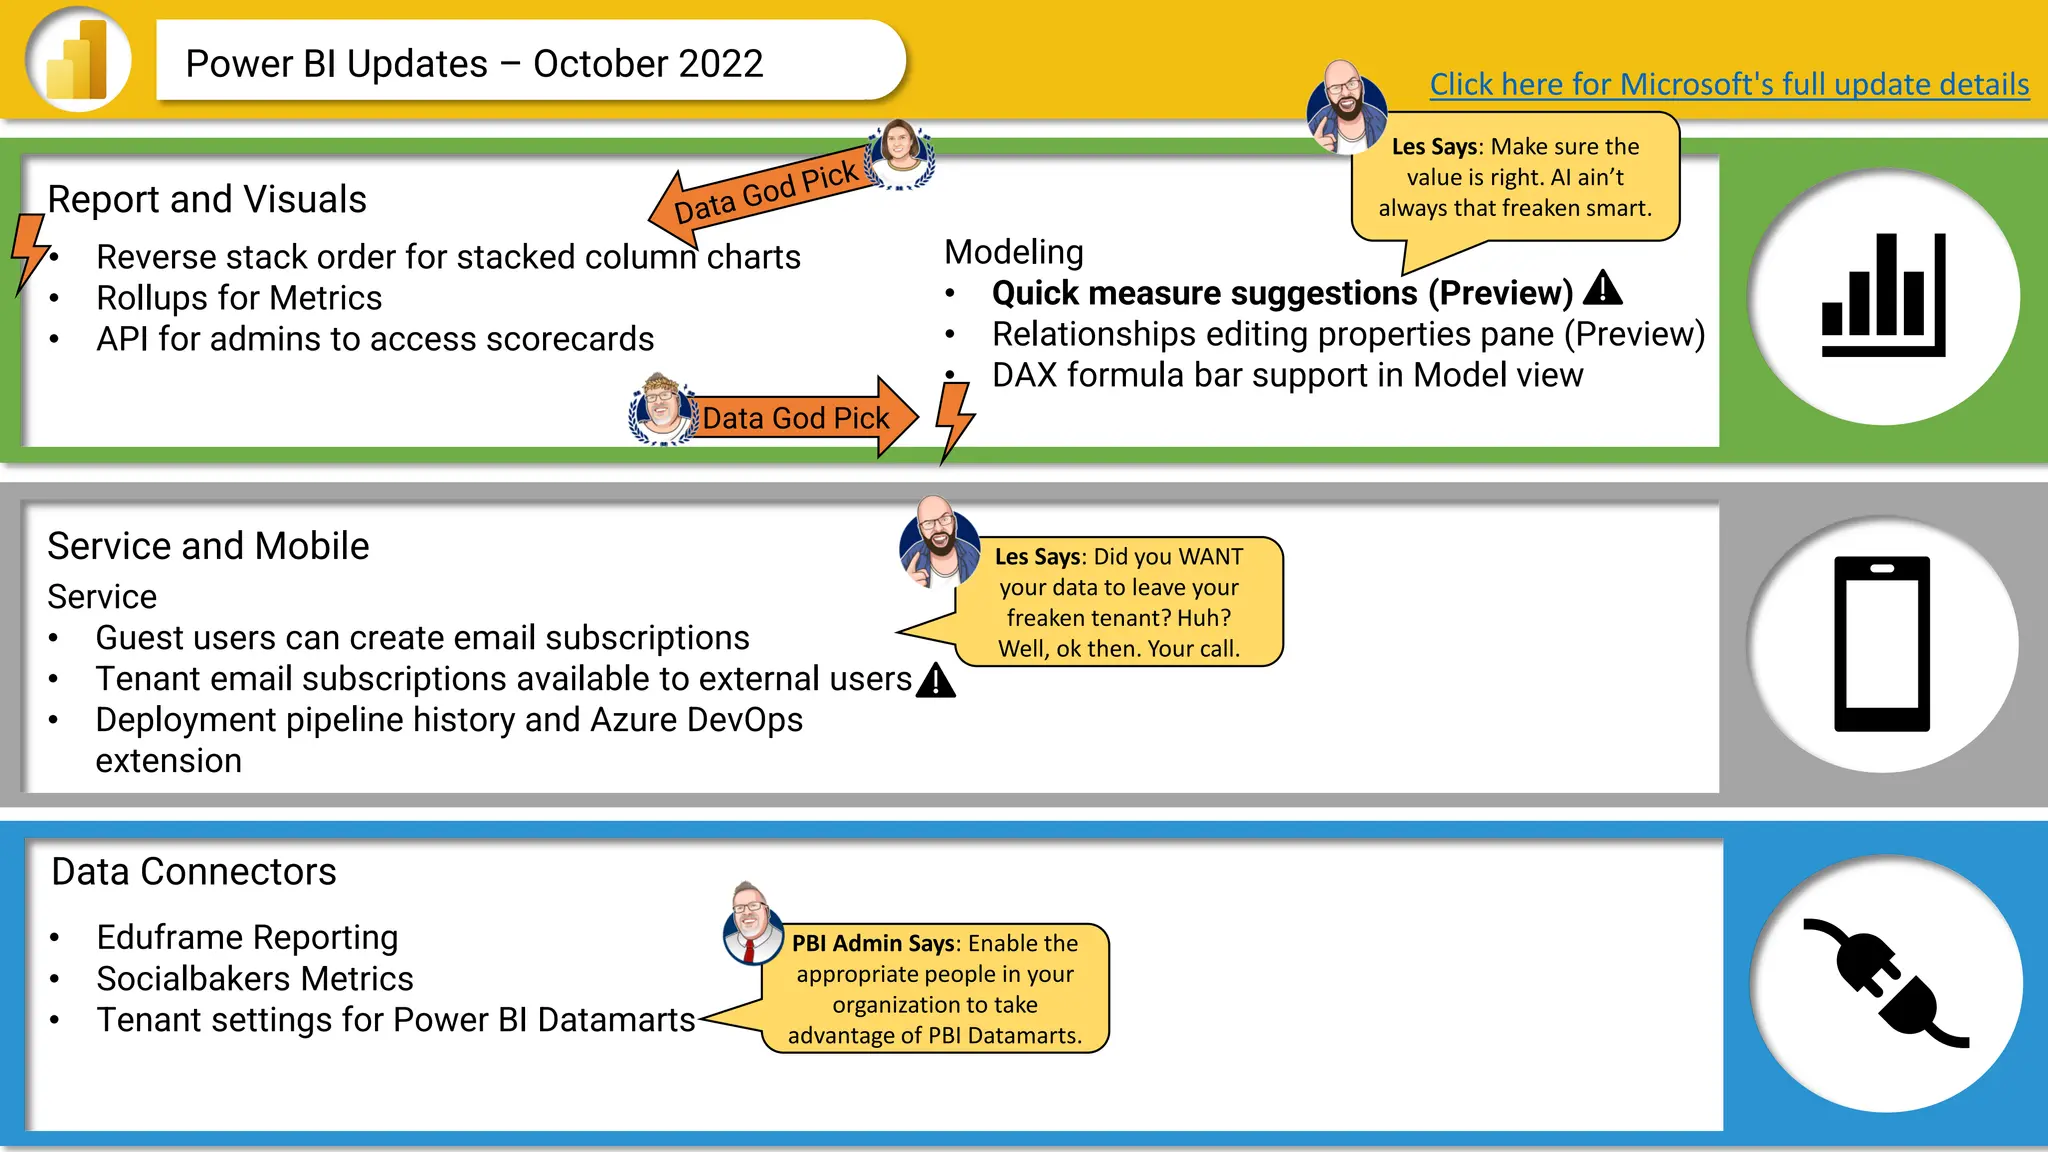
Power BI Updates – October 2022 Click here for Microsoft's full update details
• Reverse stack order for stacked column charts
• Rollups for Metrics
• API for admins to access scorecards
Modeling
• Quick measure suggestions (Preview)
• Relationships editing properties pane (Preview)
• DAX formula bar support in Model view
Service
• Guest users can create email subscriptions
• Tenant email subscriptions available to external users
• Deployment pipeline history and Azure DevOps
extension
• Eduframe Reporting
• Socialbakers Metrics
• Tenant settings for Power BI Datamarts
Les Says: Make sure the
value is right. AI ain’t
always that freaken smart.
Les Says: Did you WANT
your data to leave your
freaken tenant? Huh?
Well, ok then. Your call.
Data God Pick
PBI Admin Says: Enable the
appropriate people in your
organization to take
advantage of PBI Datamarts.
16.
Data Connectors
Report andVisuals
Service and Mobile
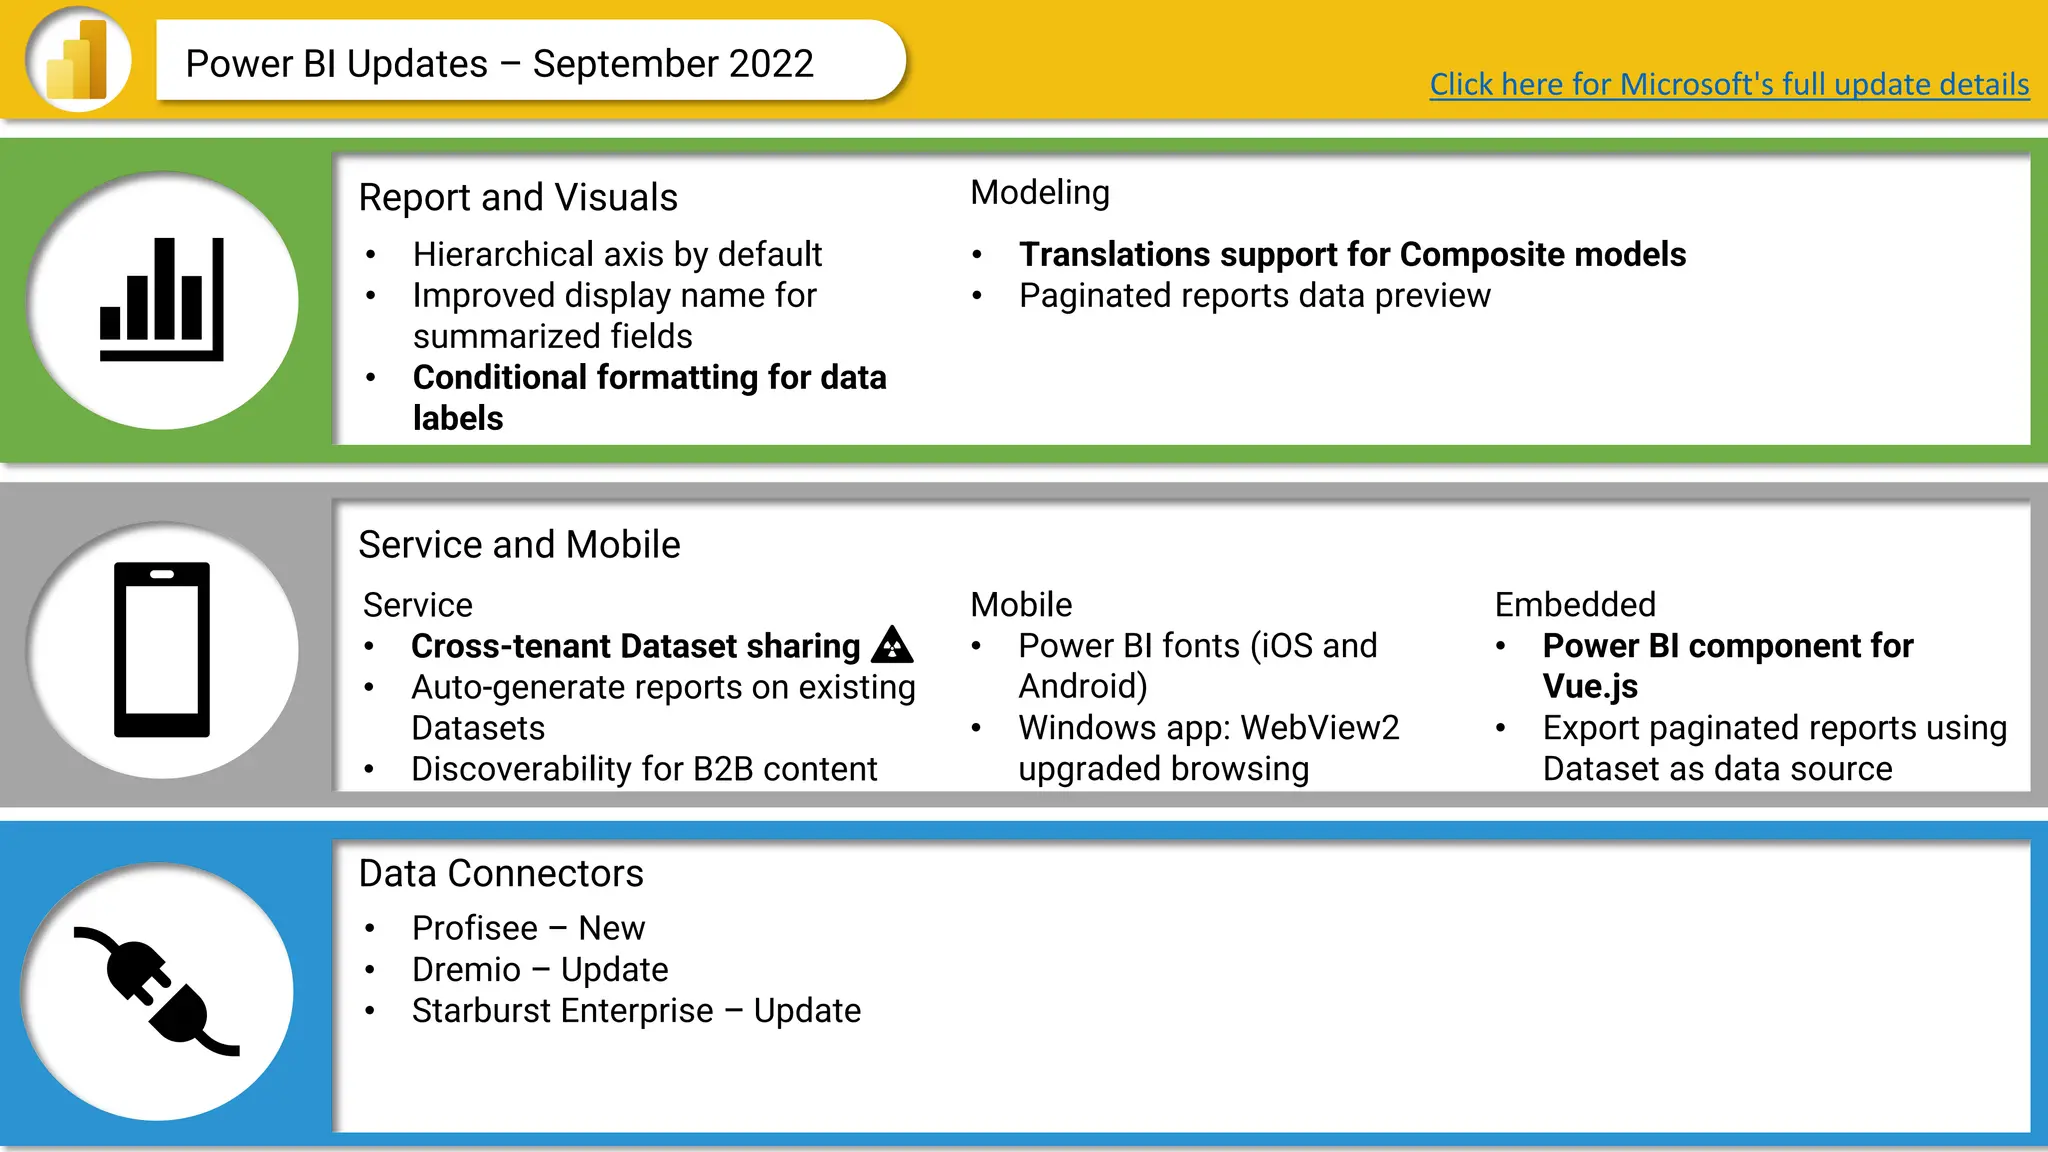
Power BI Updates – September 2022
• Hierarchical axis by default
• Improved display name for
summarized fields
• Conditional formatting for data
labels
Service
• Cross-tenant Dataset sharing
• Auto-generate reports on existing
Datasets
• Discoverability for B2B content
• Translations support for Composite models
• Paginated reports data preview
Mobile
• Power BI fonts (iOS and
Android)
• Windows app: WebView2
upgraded browsing
Click here for Microsoft's full update details
• Profisee – New
• Dremio – Update
• Starburst Enterprise – Update
Modeling
Embedded
• Power BI component for
Vue.js
• Export paginated reports using
Dataset as data source
17.
Data Connectors
Report andVisuals
Service and Mobile
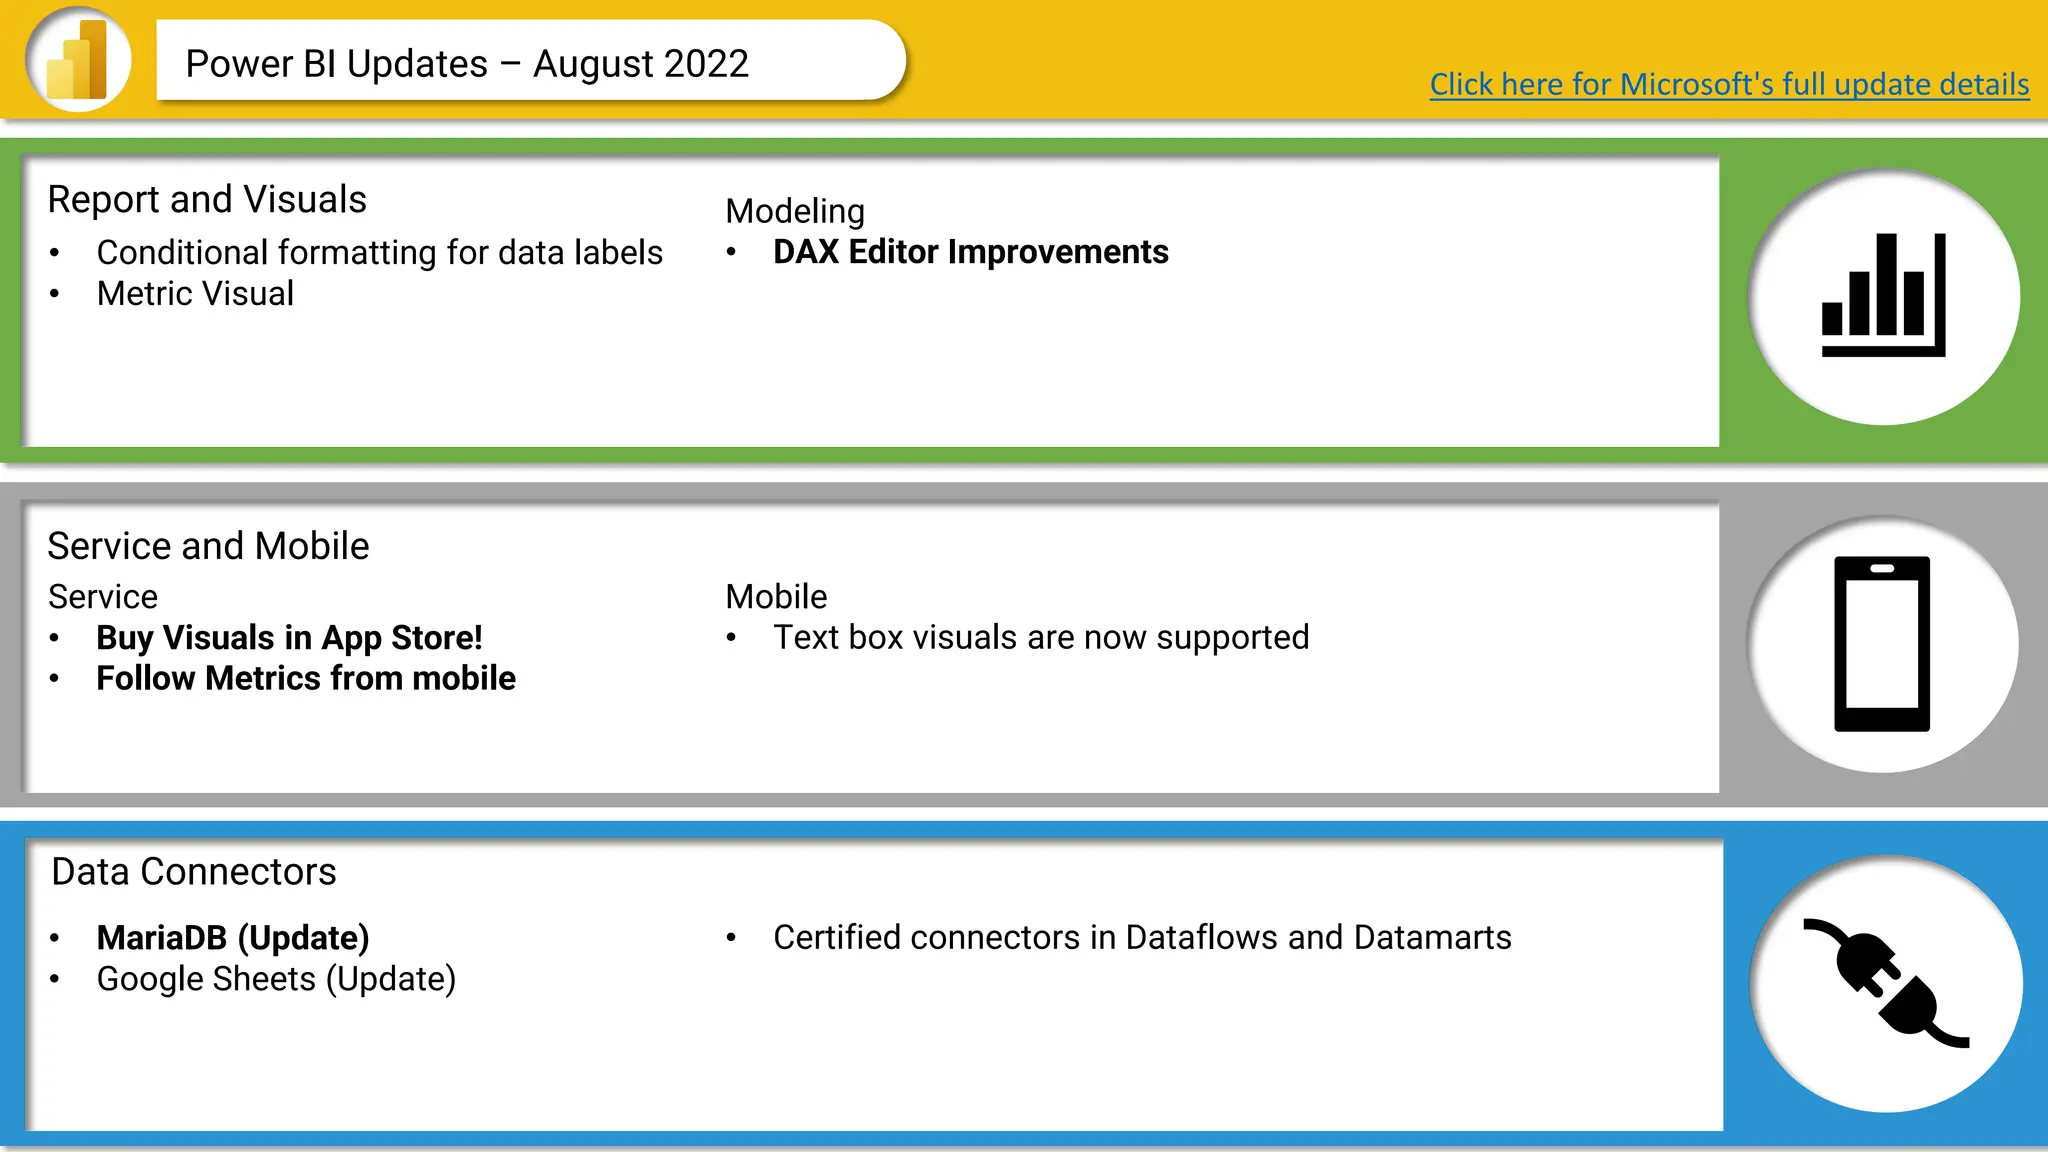
Power BI Updates – August 2022 Click here for Microsoft's full update details
• Conditional formatting for data labels
• Metric Visual
Modeling
• DAX Editor Improvements
Service
• Buy Visuals in App Store!
• Follow Metrics from mobile
• MariaDB (Update)
• Google Sheets (Update)
• Certified connectors in Dataflows and Datamarts
Mobile
• Text box visuals are now supported
18.
Data Connectors
Report andVisuals
Service and Mobile
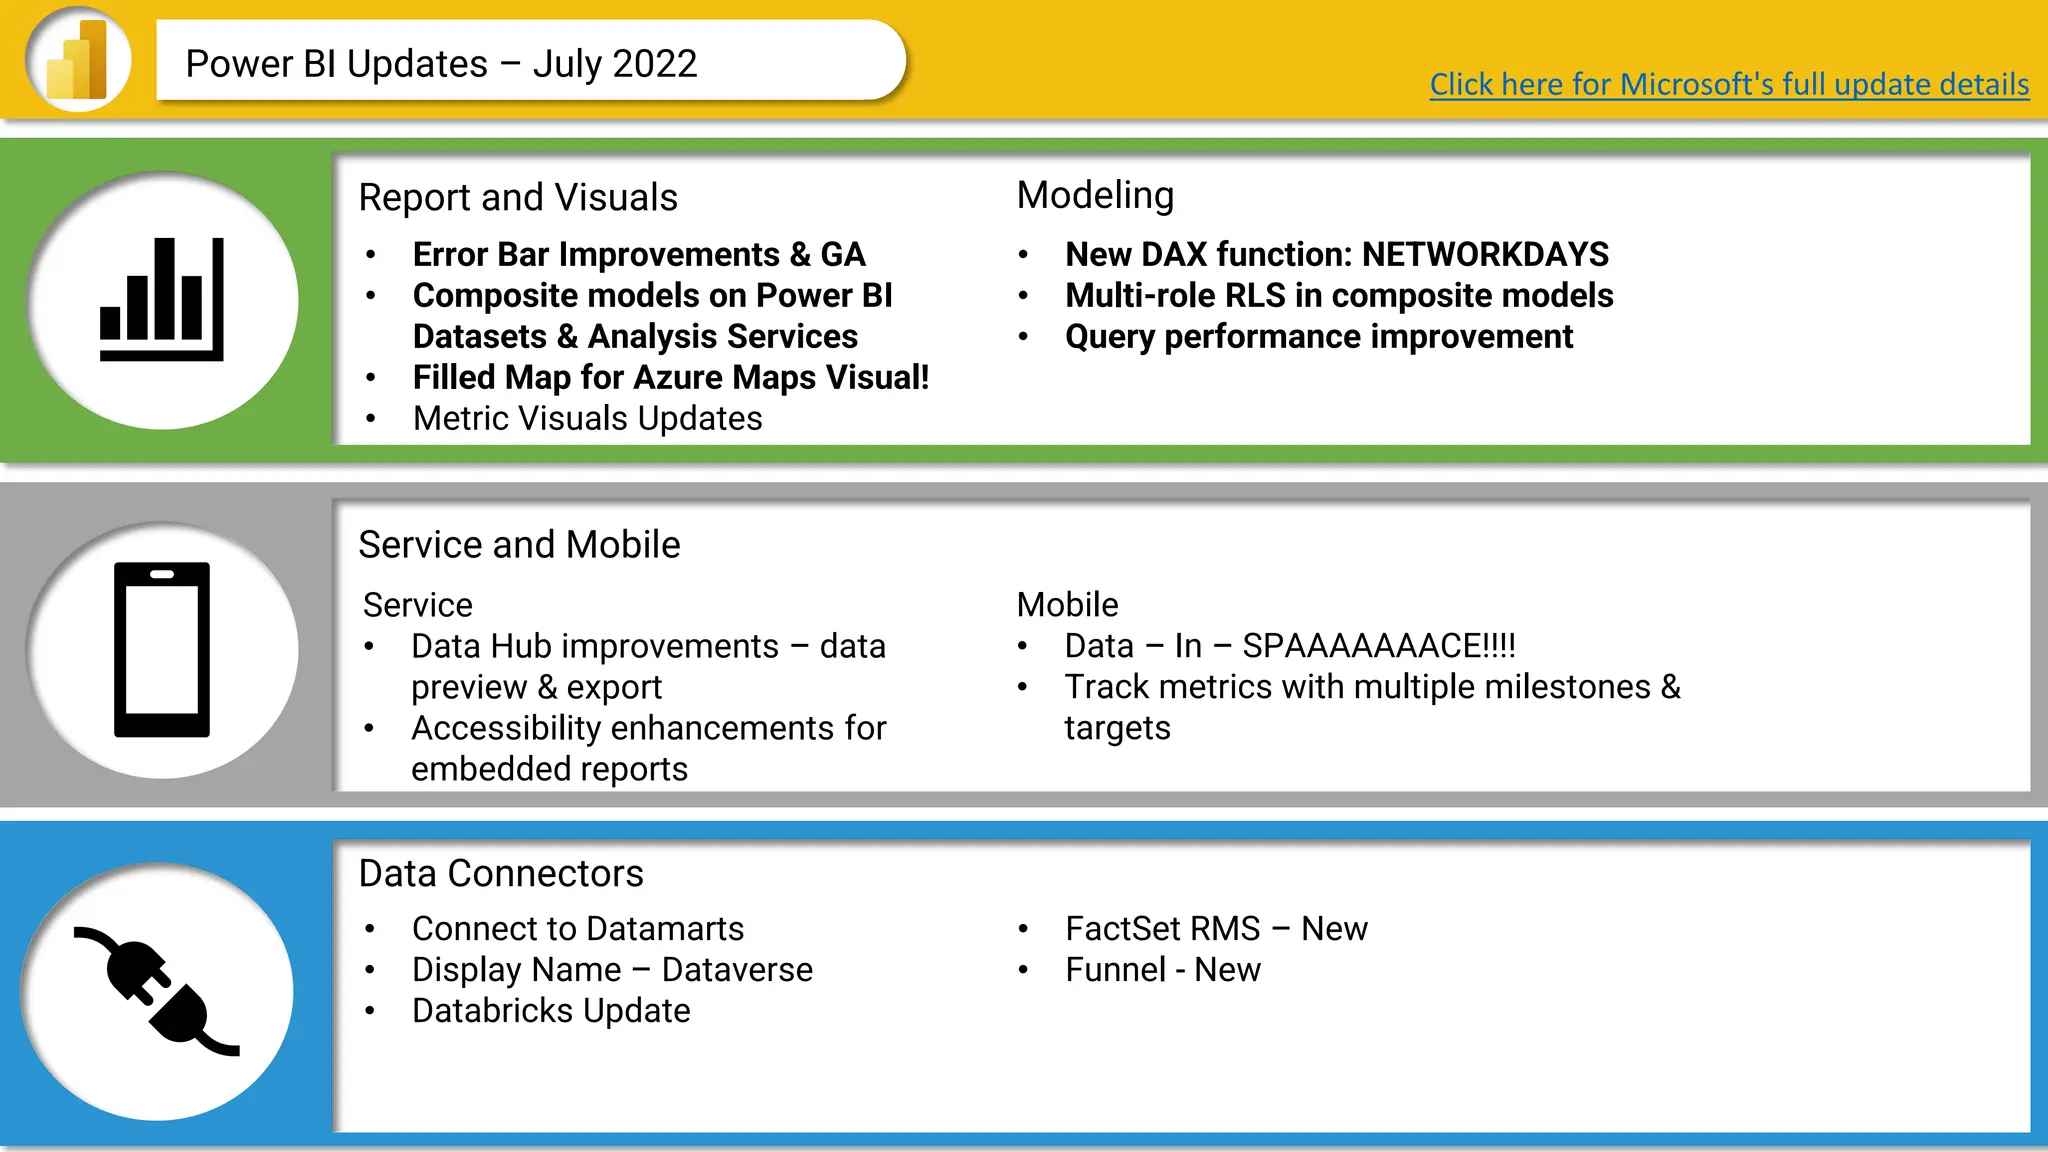
Power BI Updates – July 2022
• Error Bar Improvements & GA
• Composite models on Power BI
Datasets & Analysis Services
• Filled Map for Azure Maps Visual!
• Metric Visuals Updates
• FactSet RMS – New
• Funnel - New
Service
• Data Hub improvements – data
preview & export
• Accessibility enhancements for
embedded reports
• New DAX function: NETWORKDAYS
• Multi-role RLS in composite models
• Query performance improvement
Mobile
• Data – In – SPAAAAAAACE!!!!
• Track metrics with multiple milestones &
targets
Click here for Microsoft's full update details
• Connect to Datamarts
• Display Name – Dataverse
• Databricks Update
Modeling
19.
Data Connectors
Report andVisuals
Service and Mobile
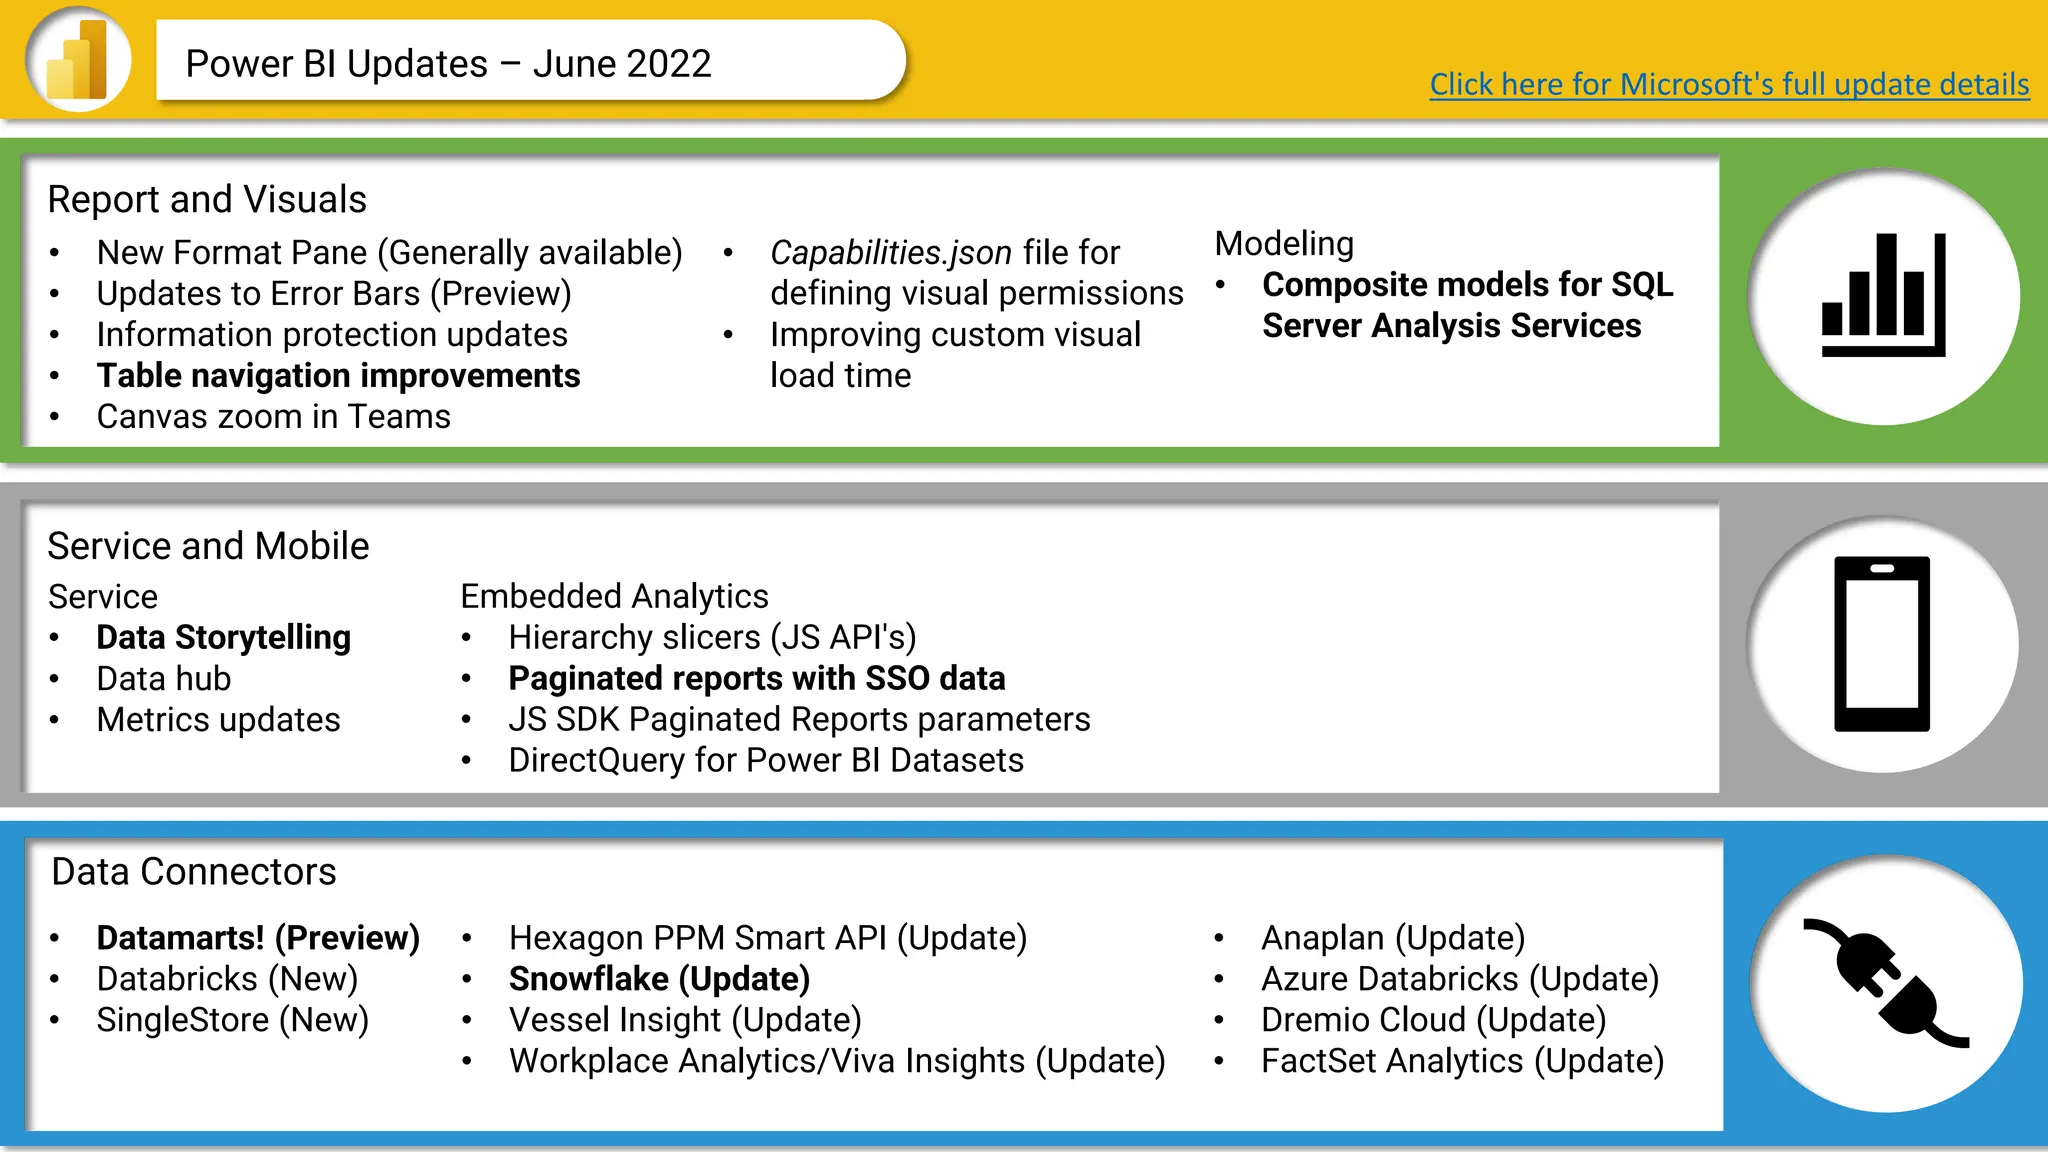
Power BI Updates – June 2022 Click here for Microsoft's full update details
• New Format Pane (Generally available)
• Updates to Error Bars (Preview)
• Information protection updates
• Table navigation improvements
• Canvas zoom in Teams
Modeling
• Composite models for SQL
Server Analysis Services
Service
• Data Storytelling
• Data hub
• Metrics updates
Embedded Analytics
• Hierarchy slicers (JS API's)
• Paginated reports with SSO data
• JS SDK Paginated Reports parameters
• DirectQuery for Power BI Datasets
• Datamarts! (Preview)
• Databricks (New)
• SingleStore (New)
• Anaplan (Update)
• Azure Databricks (Update)
• Dremio Cloud (Update)
• FactSet Analytics (Update)
• Hexagon PPM Smart API (Update)
• Snowflake (Update)
• Vessel Insight (Update)
• Workplace Analytics/Viva Insights (Update)
• Capabilities.json file for
defining visual permissions
• Improving custom visual
load time
20.
Data Connectors
Report andVisuals
Service and Mobile
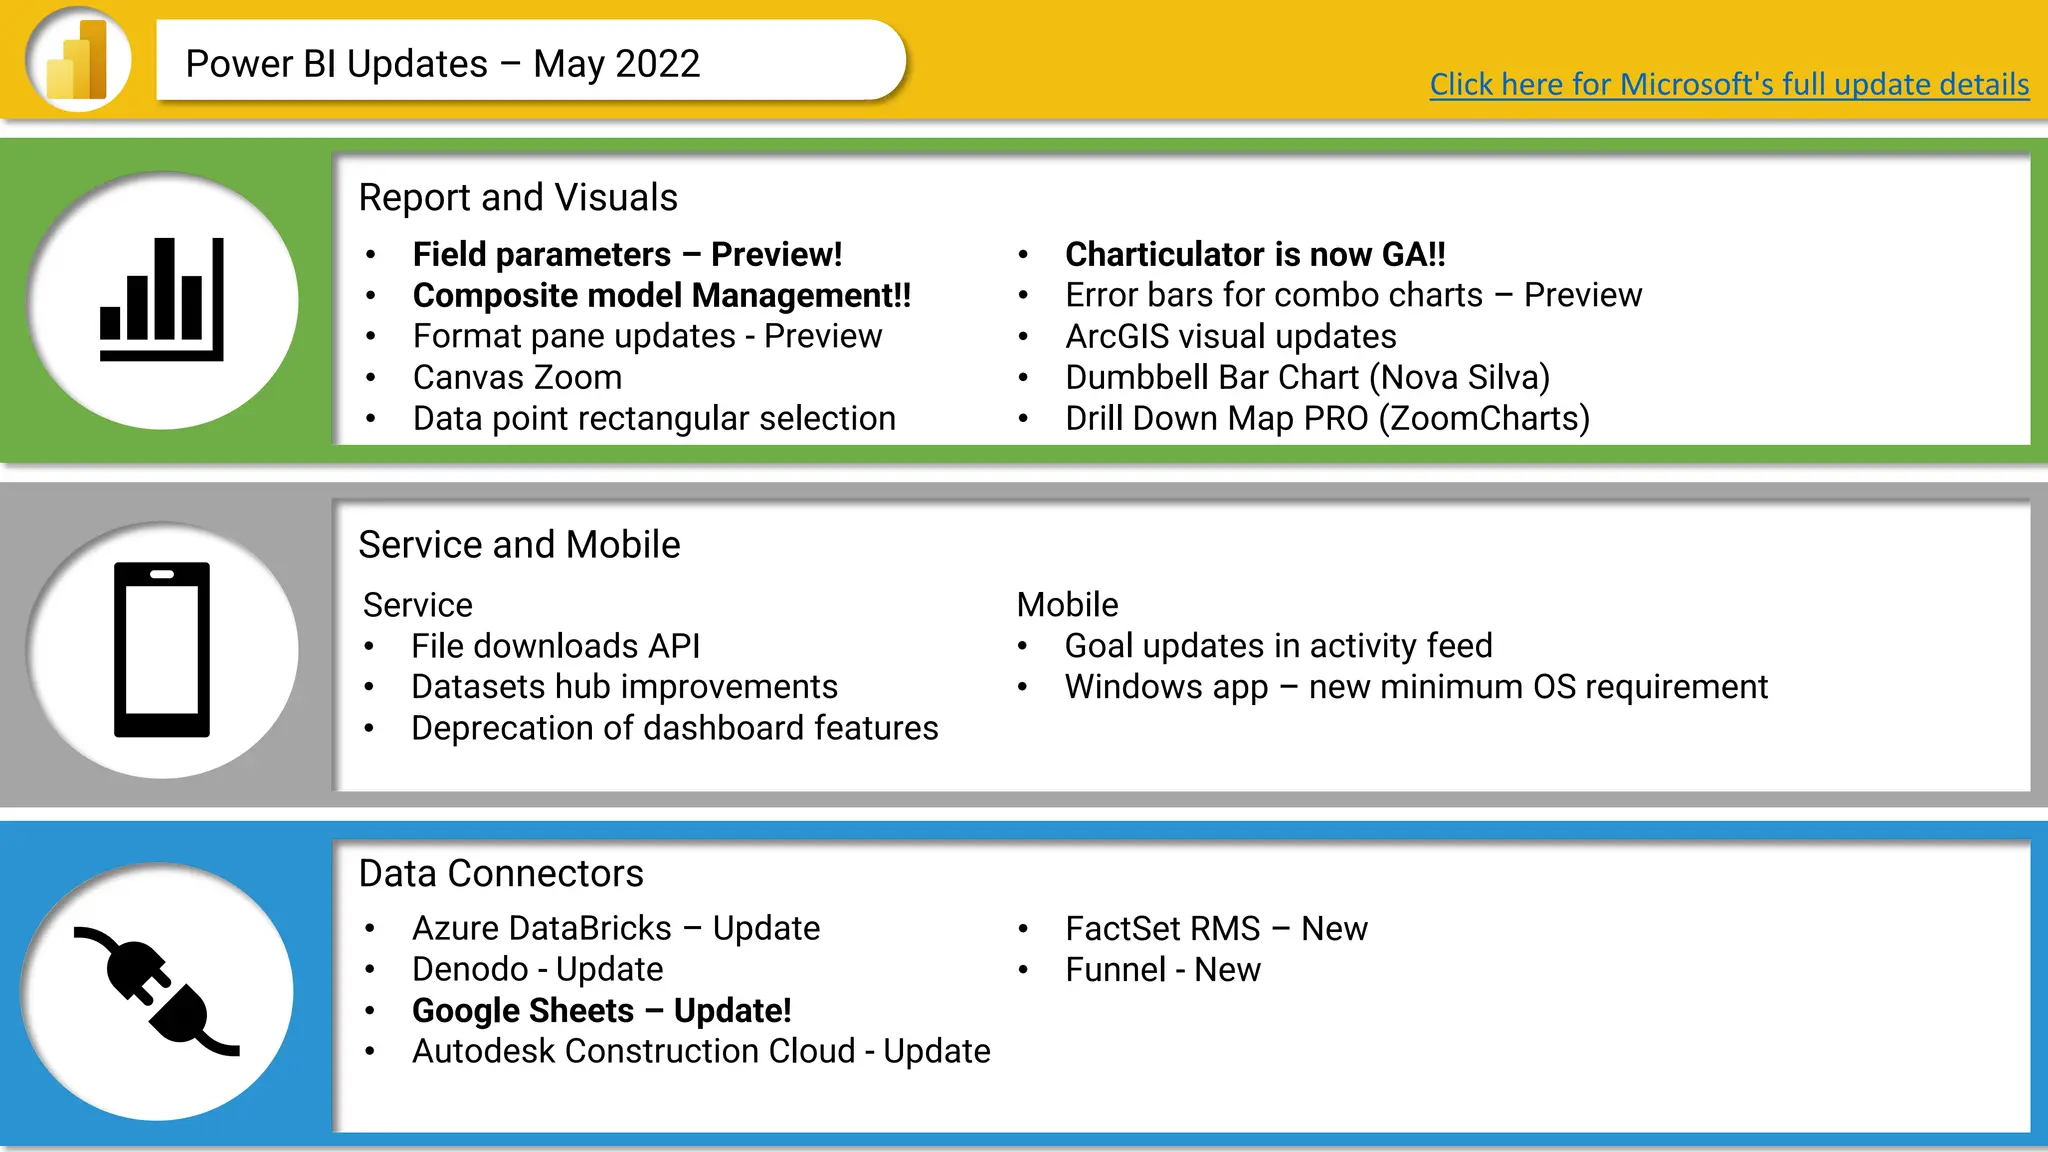
Power BI Updates – May 2022
• Field parameters – Preview!
• Composite model Management!!
• Format pane updates - Preview
• Canvas Zoom
• Data point rectangular selection
• FactSet RMS – New
• Funnel - New
Service
• File downloads API
• Datasets hub improvements
• Deprecation of dashboard features
• Charticulator is now GA!!
• Error bars for combo charts – Preview
• ArcGIS visual updates
• Dumbbell Bar Chart (Nova Silva)
• Drill Down Map PRO (ZoomCharts)
Mobile
• Goal updates in activity feed
• Windows app – new minimum OS requirement
Click here for Microsoft's full update details
• Azure DataBricks – Update
• Denodo - Update
• Google Sheets – Update!
• Autodesk Construction Cloud - Update
21.
Data Connectors
Report andVisuals
Service and Mobile
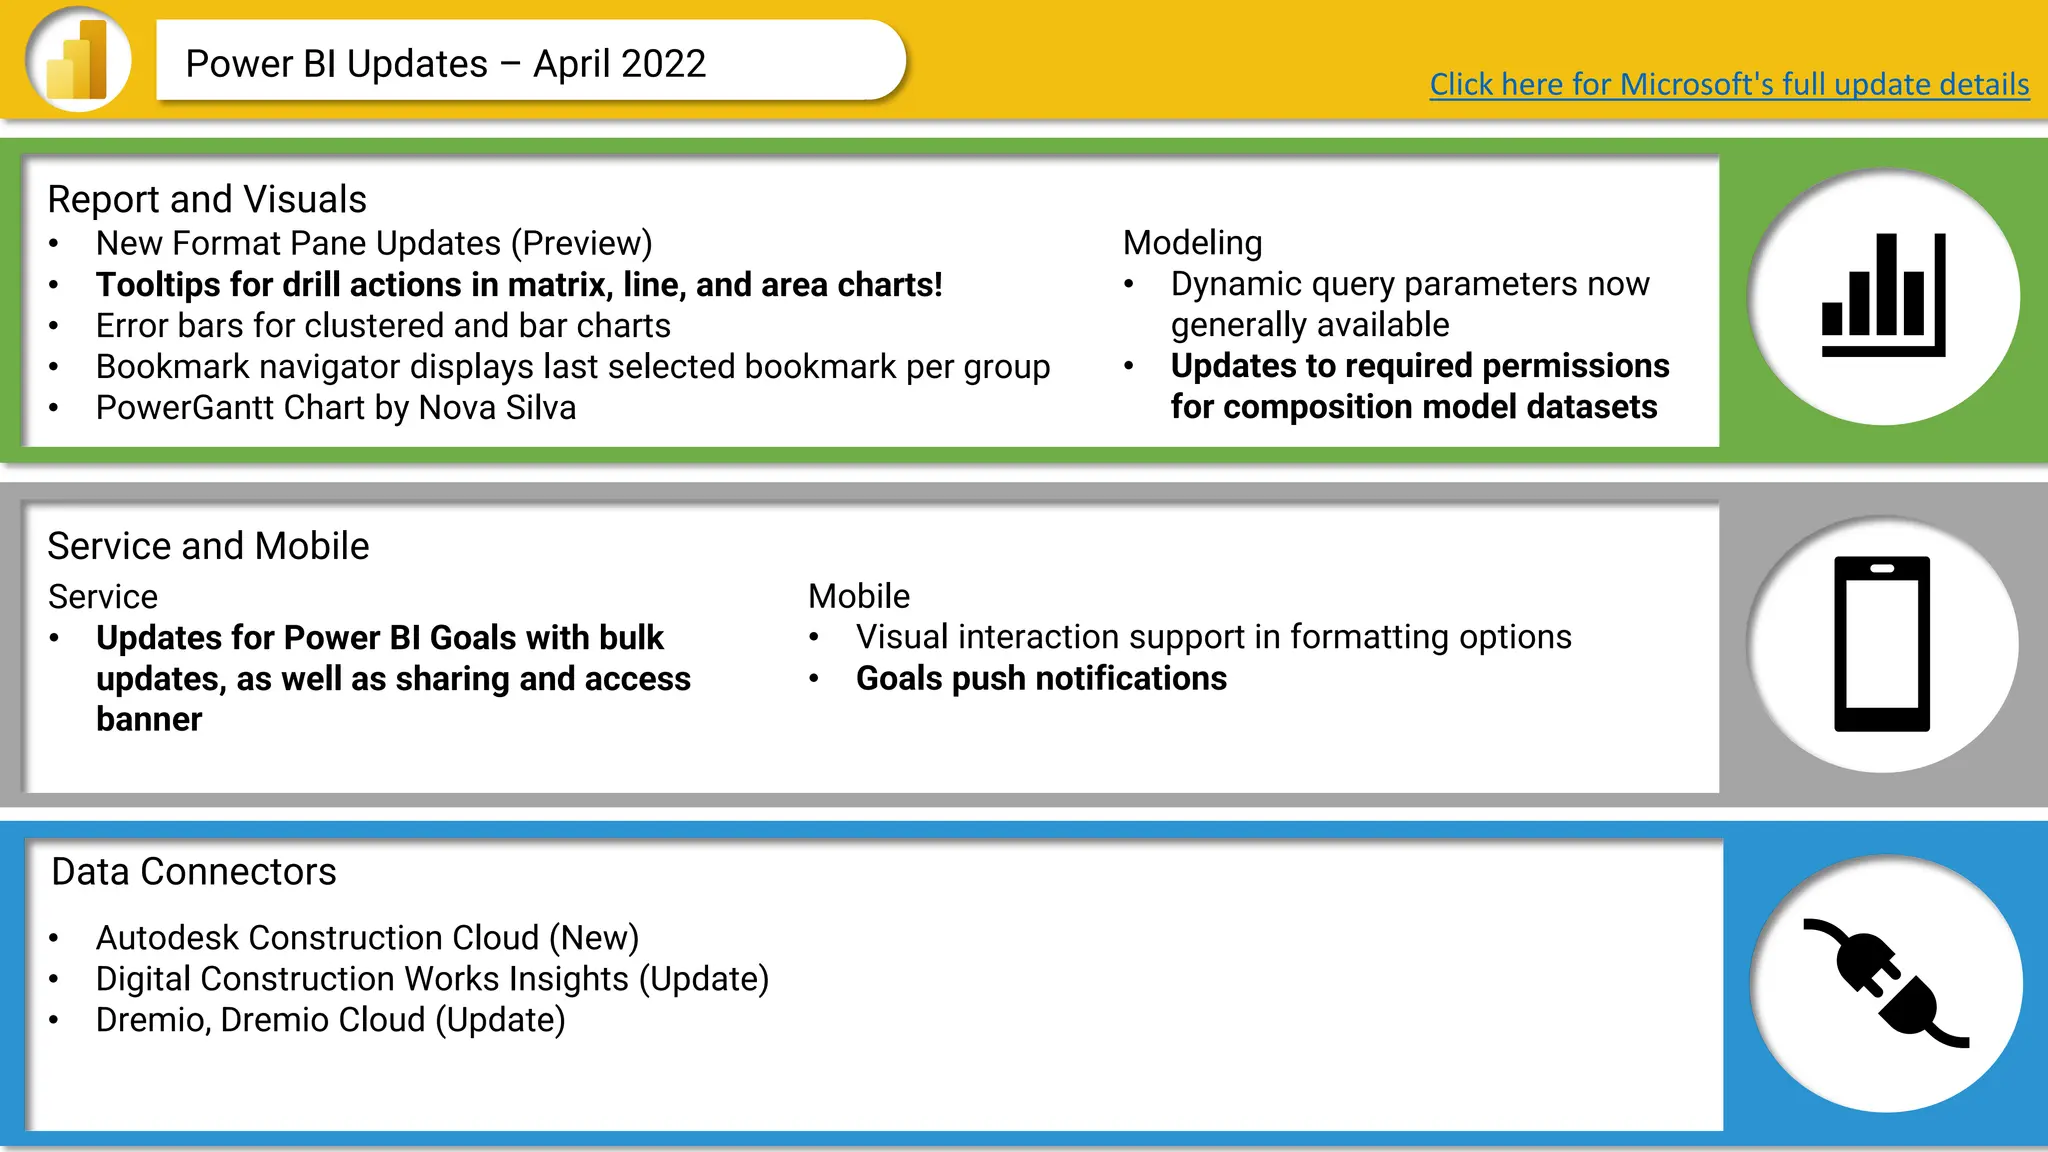
Power BI Updates – April 2022 Click here for Microsoft's full update details
• New Format Pane Updates (Preview)
• Tooltips for drill actions in matrix, line, and area charts!
• Error bars for clustered and bar charts
• Bookmark navigator displays last selected bookmark per group
• PowerGantt Chart by Nova Silva
Modeling
• Dynamic query parameters now
generally available
• Updates to required permissions
for composition model datasets
Service
• Updates for Power BI Goals with bulk
updates, as well as sharing and access
banner
Mobile
• Visual interaction support in formatting options
• Goals push notifications
• Autodesk Construction Cloud (New)
• Digital Construction Works Insights (Update)
• Dremio, Dremio Cloud (Update)
22.
Data Connectors
Report andVisuals
Service and Mobile
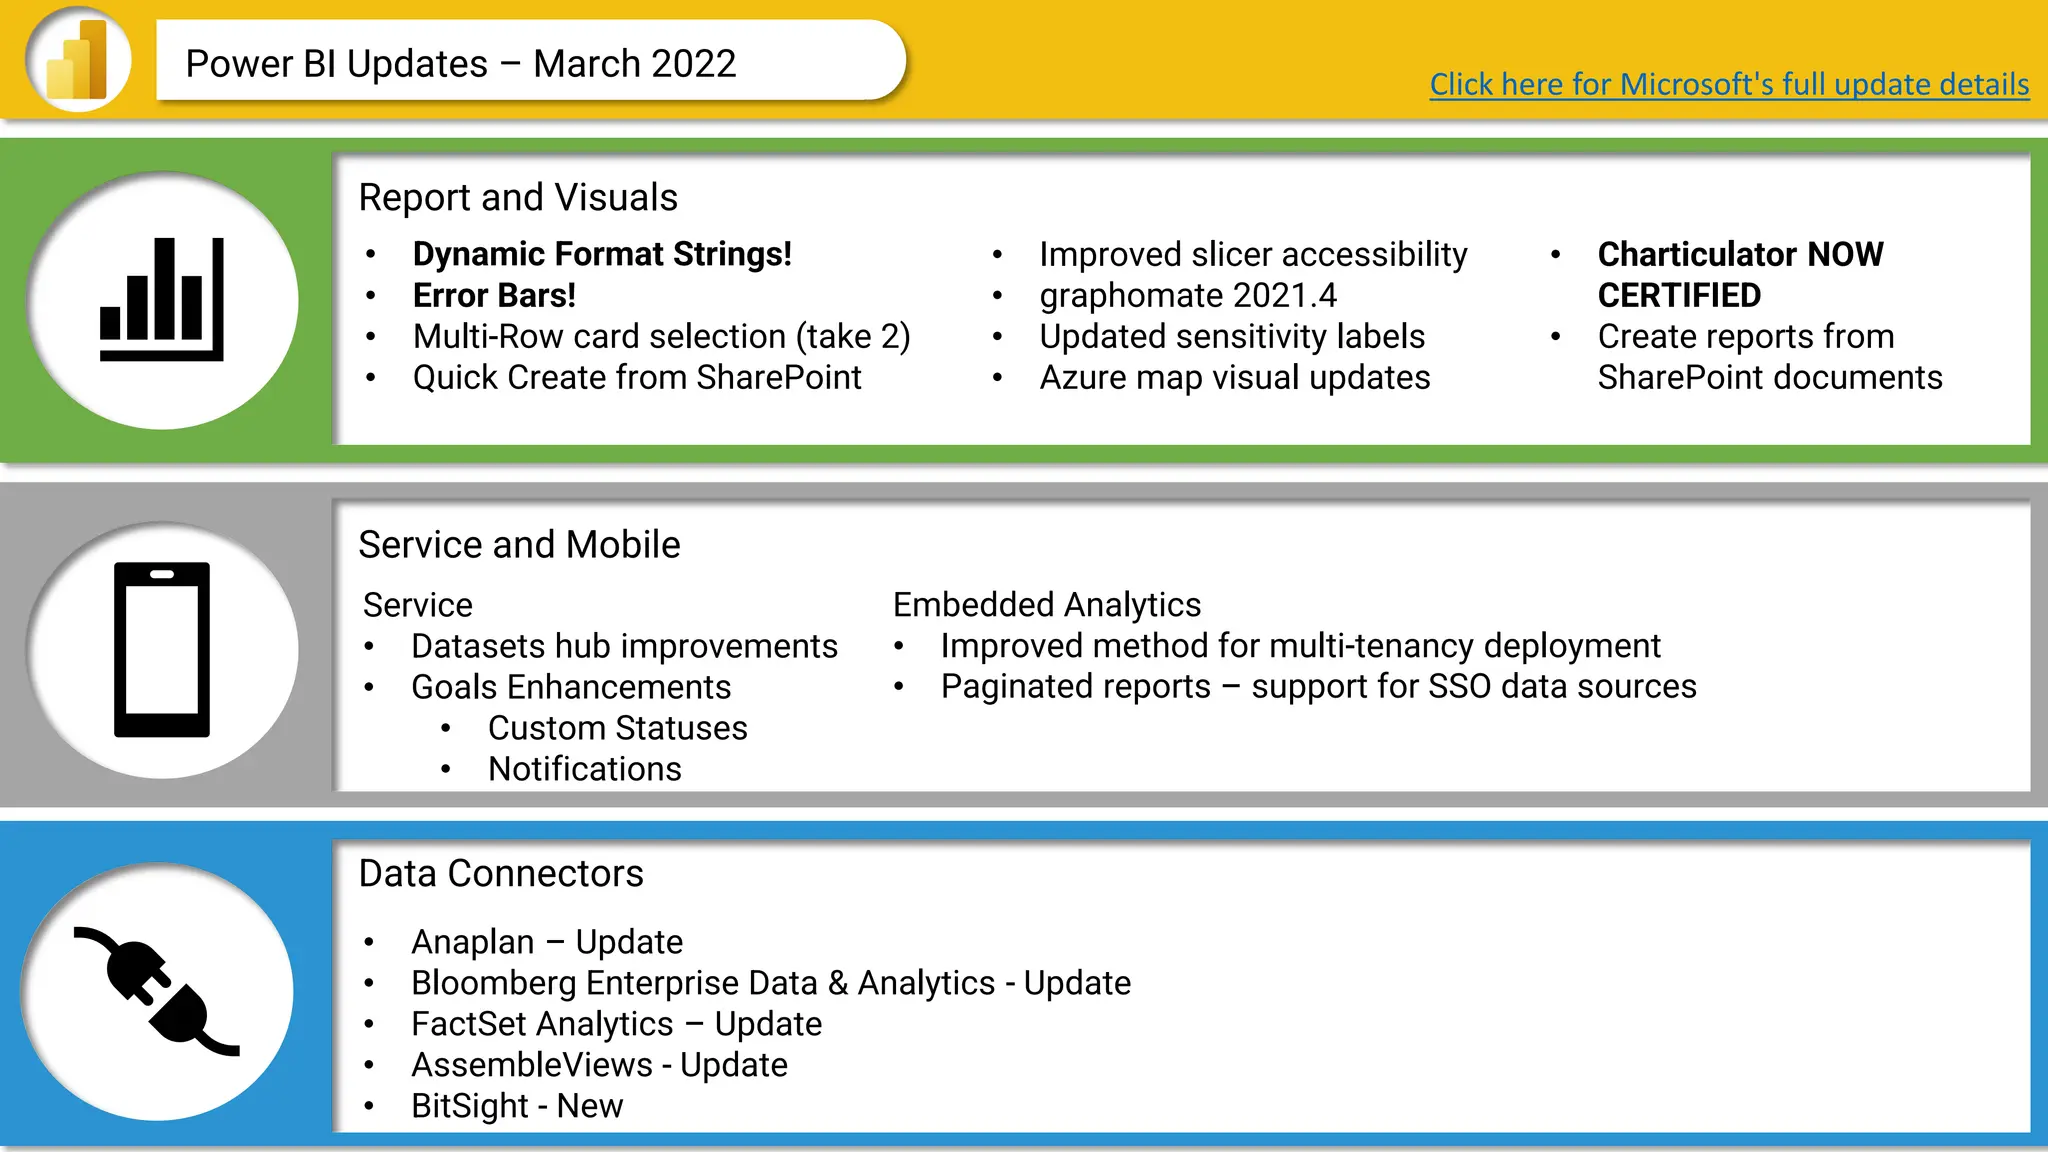
Power BI Updates – March 2022
• Dynamic Format Strings!
• Error Bars!
• Multi-Row card selection (take 2)
• Quick Create from SharePoint
• Anaplan – Update
• Bloomberg Enterprise Data & Analytics - Update
• FactSet Analytics – Update
• AssembleViews - Update
• BitSight - New
Service
• Datasets hub improvements
• Goals Enhancements
• Custom Statuses
• Notifications
• Improved slicer accessibility
• graphomate 2021.4
• Updated sensitivity labels
• Azure map visual updates
Embedded Analytics
• Improved method for multi-tenancy deployment
• Paginated reports – support for SSO data sources
• Charticulator NOW
CERTIFIED
• Create reports from
SharePoint documents
Click here for Microsoft's full update details
23.
Data Connectors
Report andVisuals
Service and Mobile
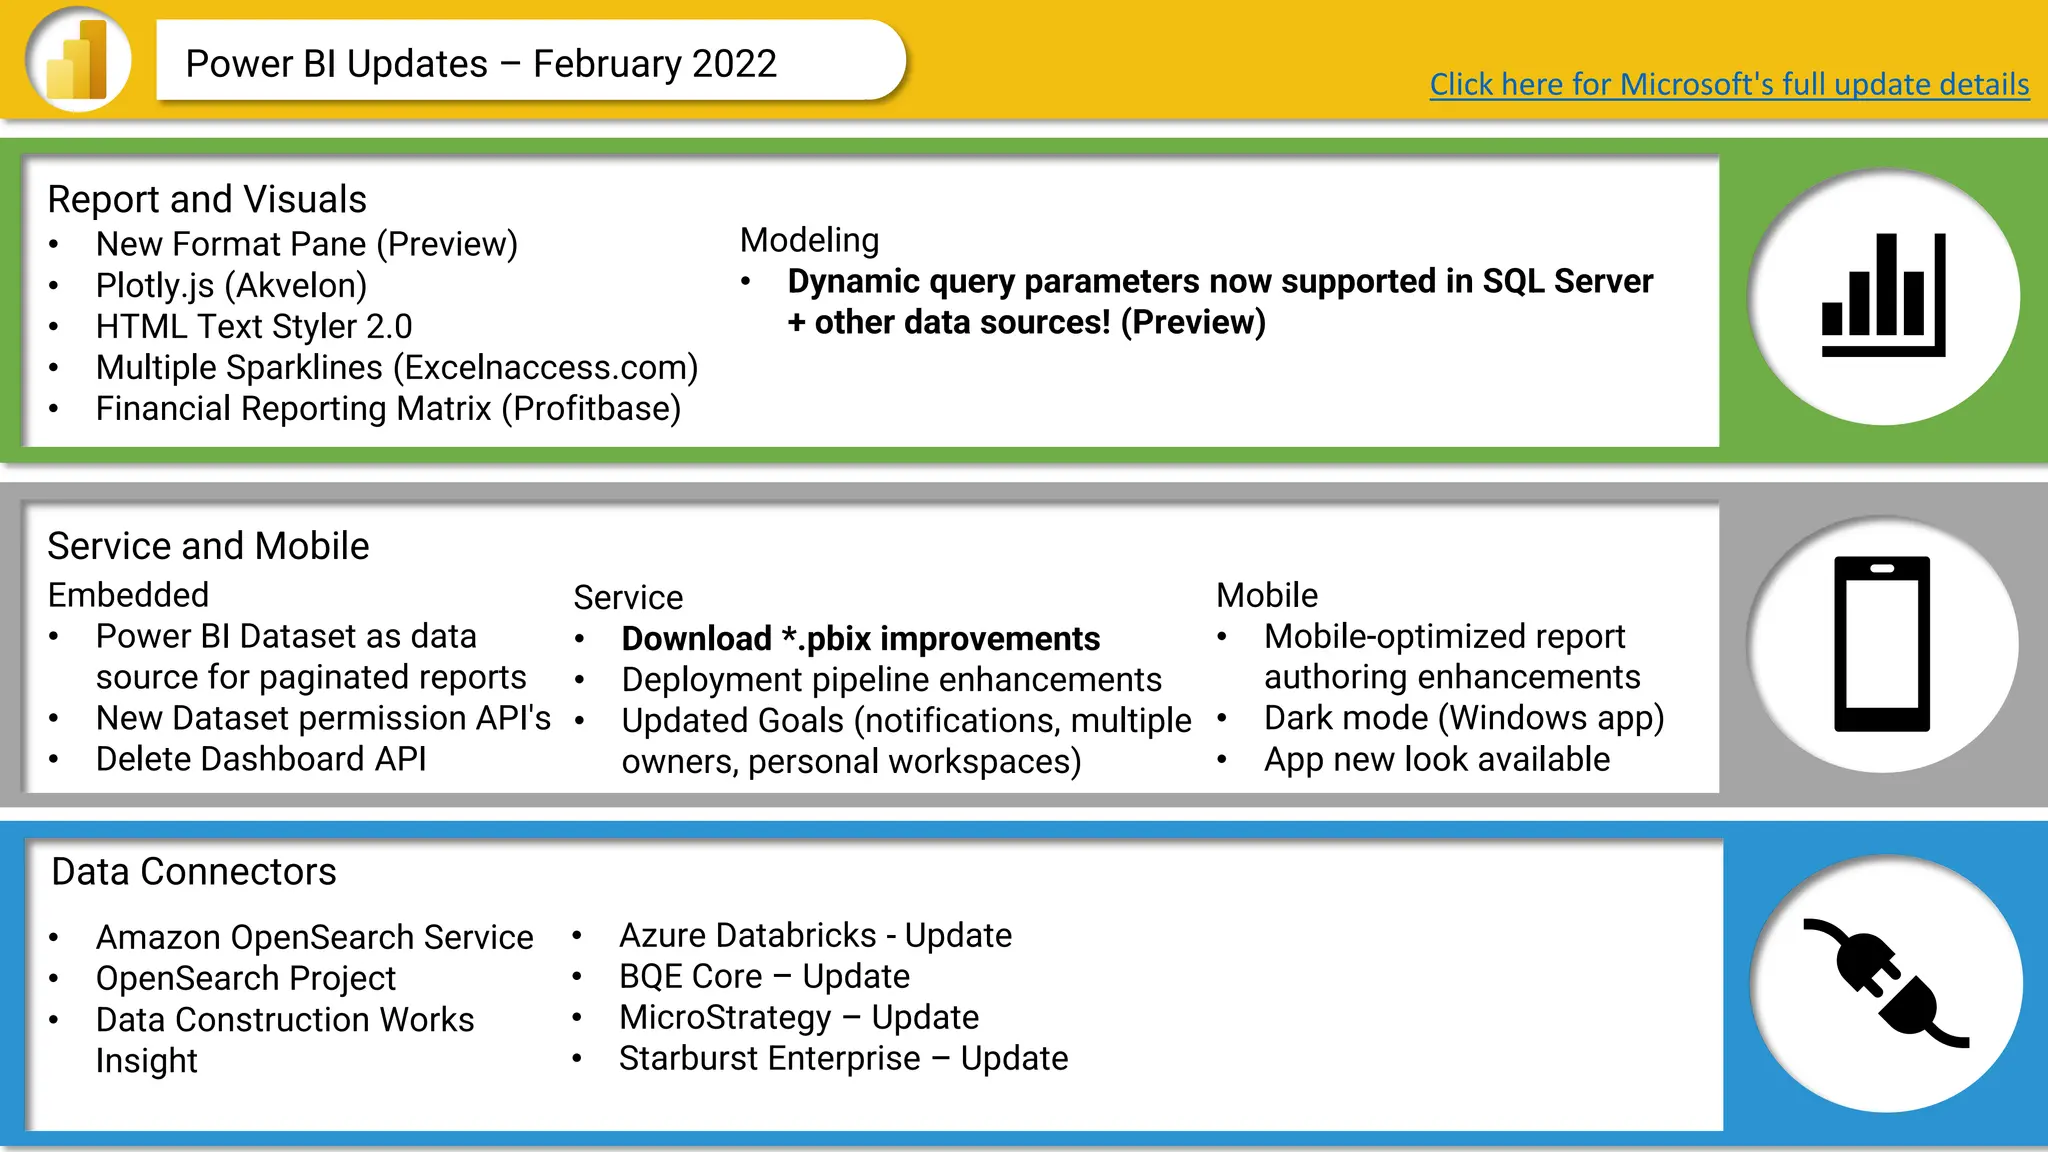
Power BI Updates – February 2022 Click here for Microsoft's full update details
• New Format Pane (Preview)
• Plotly.js (Akvelon)
• HTML Text Styler 2.0
• Multiple Sparklines (Excelnaccess.com)
• Financial Reporting Matrix (Profitbase)
Modeling
• Dynamic query parameters now supported in SQL Server
+ other data sources! (Preview)
Service
• Download *.pbix improvements
• Deployment pipeline enhancements
• Updated Goals (notifications, multiple
owners, personal workspaces)
Embedded
• Power BI Dataset as data
source for paginated reports
• New Dataset permission API's
• Delete Dashboard API
Mobile
• Mobile-optimized report
authoring enhancements
• Dark mode (Windows app)
• App new look available
• Amazon OpenSearch Service
• OpenSearch Project
• Data Construction Works
Insight
• Azure Databricks - Update
• BQE Core – Update
• MicroStrategy – Update
• Starburst Enterprise – Update
24.
January 2022: TheMicrosoft Power BI team
is taking a much-deserved break this month!
25.
Data Connectors
Report andVisuals
Service and Mobile
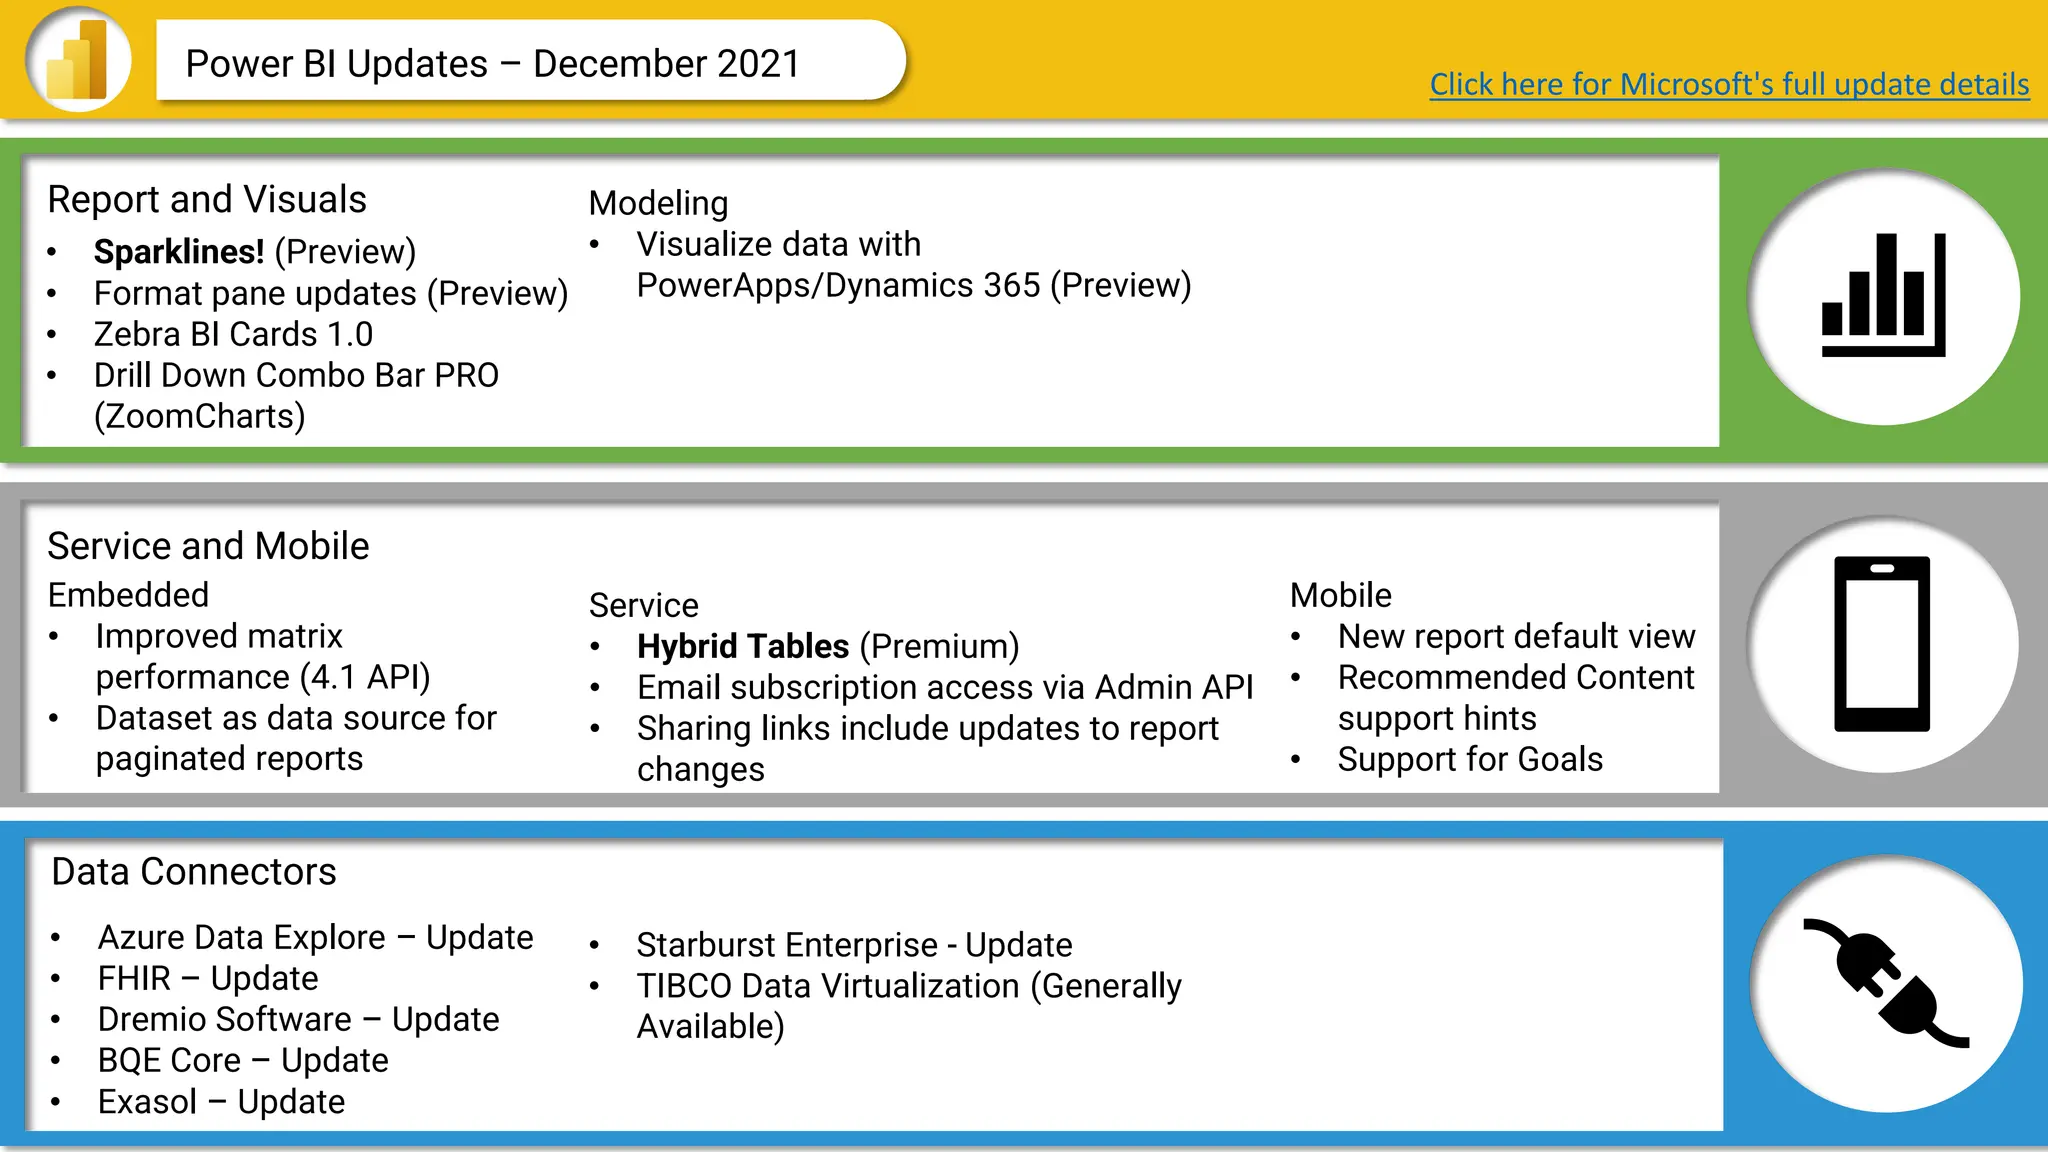
Power BI Updates – December 2021 Click here for Microsoft's full update details
• Sparklines! (Preview)
• Format pane updates (Preview)
• Zebra BI Cards 1.0
• Drill Down Combo Bar PRO
(ZoomCharts)
Modeling
• Visualize data with
PowerApps/Dynamics 365 (Preview)
Service
• Hybrid Tables (Premium)
• Email subscription access via Admin API
• Sharing links include updates to report
changes
Embedded
• Improved matrix
performance (4.1 API)
• Dataset as data source for
paginated reports
Mobile
• New report default view
• Recommended Content
support hints
• Support for Goals
• Azure Data Explore – Update
• FHIR – Update
• Dremio Software – Update
• BQE Core – Update
• Exasol – Update
• Starburst Enterprise - Update
• TIBCO Data Virtualization (Generally
Available)
26.
Data Connectors
Report andVisuals
Service and Mobile
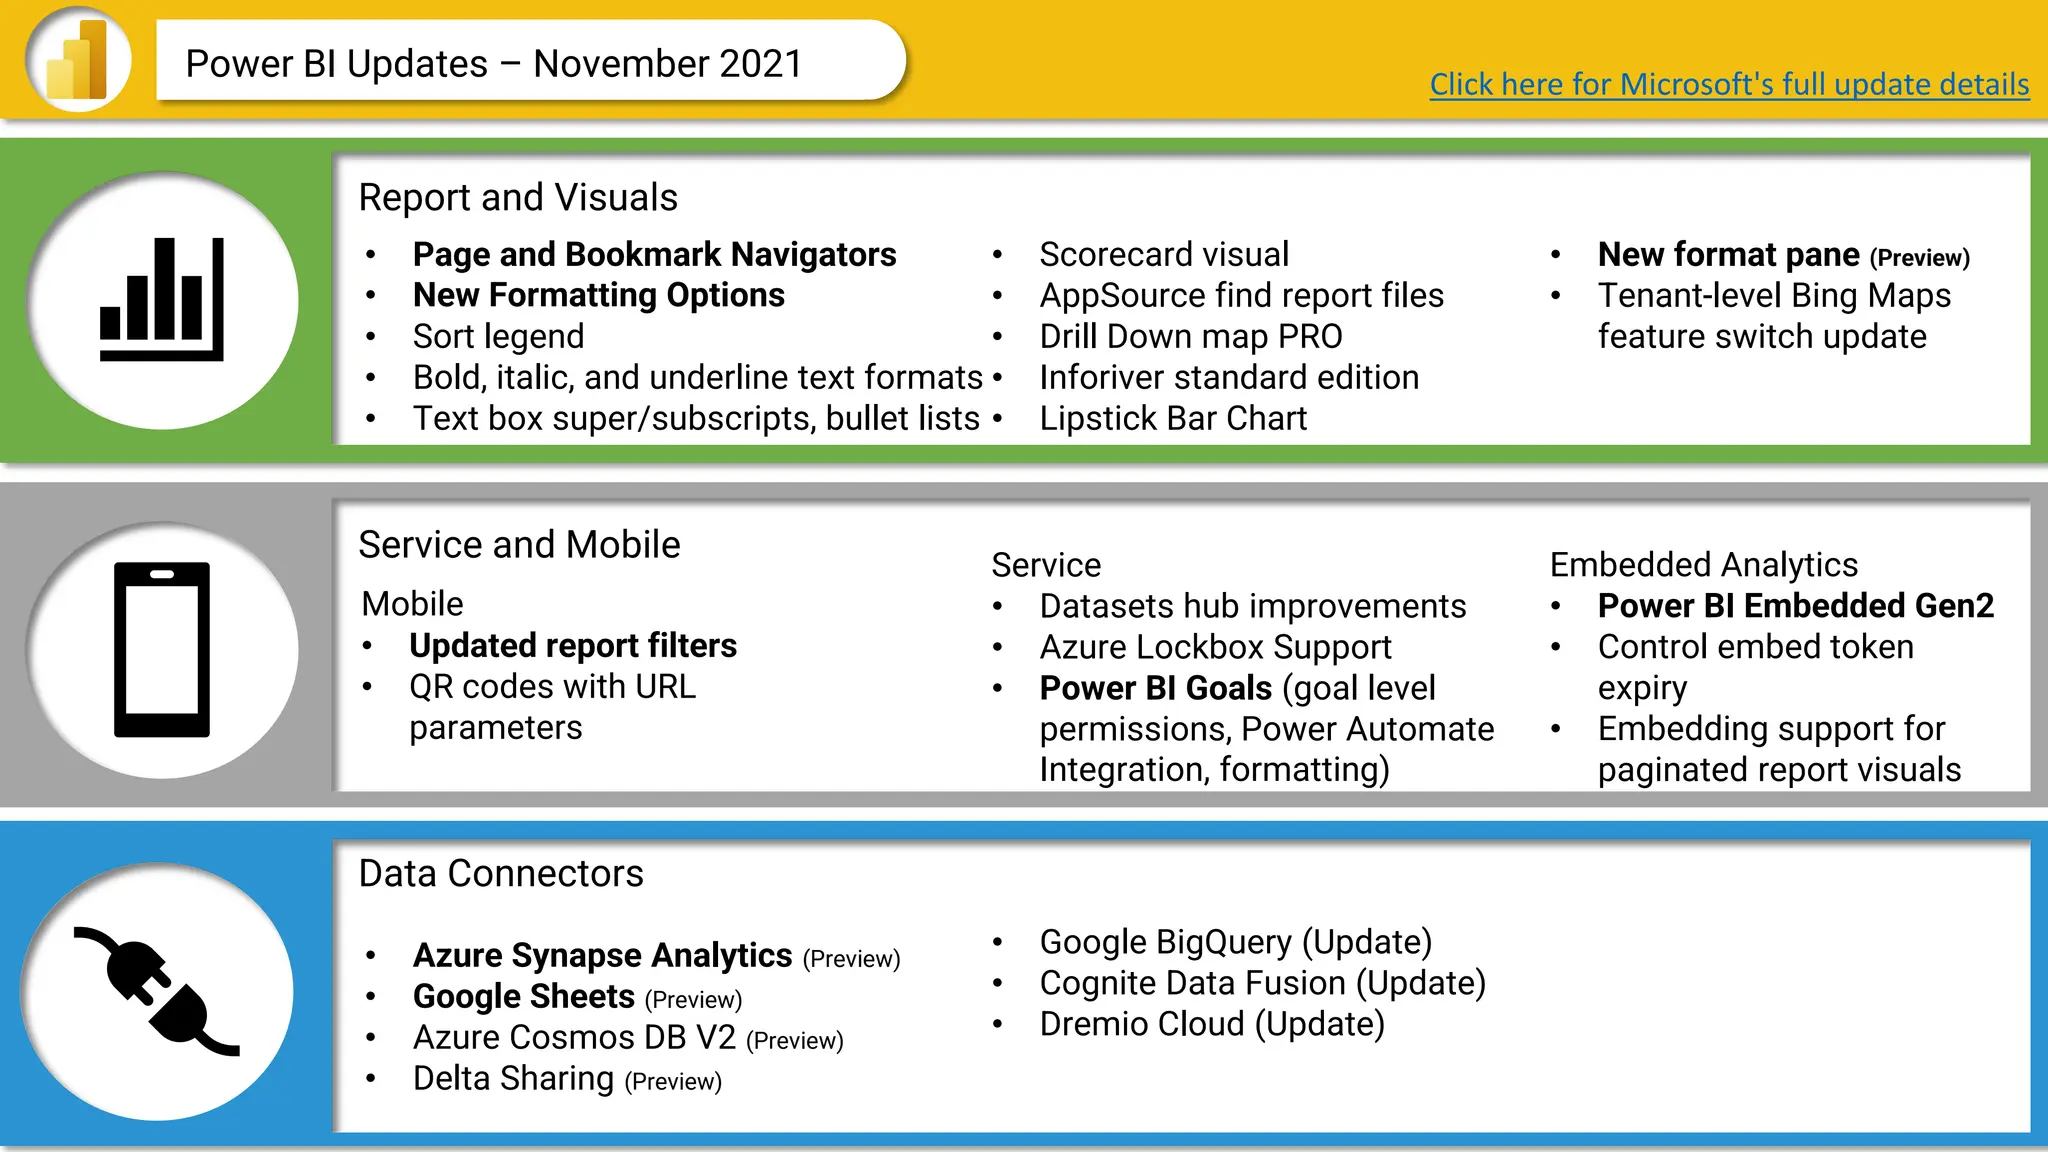
Power BI Updates – November 2021
• Page and Bookmark Navigators
• New Formatting Options
• Sort legend
• Bold, italic, and underline text formats
• Text box super/subscripts, bullet lists
• Azure Synapse Analytics (Preview)
• Google Sheets (Preview)
• Azure Cosmos DB V2 (Preview)
• Delta Sharing (Preview)
• Google BigQuery (Update)
• Cognite Data Fusion (Update)
• Dremio Cloud (Update)
Service
• Datasets hub improvements
• Azure Lockbox Support
• Power BI Goals (goal level
permissions, Power Automate
Integration, formatting)
• Scorecard visual
• AppSource find report files
• Drill Down map PRO
• Inforiver standard edition
• Lipstick Bar Chart
Mobile
• Updated report filters
• QR codes with URL
parameters
Embedded Analytics
• Power BI Embedded Gen2
• Control embed token
expiry
• Embedding support for
paginated report visuals
• New format pane (Preview)
• Tenant-level Bing Maps
feature switch update
Click here for Microsoft's full update details
27.
Data Connectors
Report andVisuals
Service and Mobile
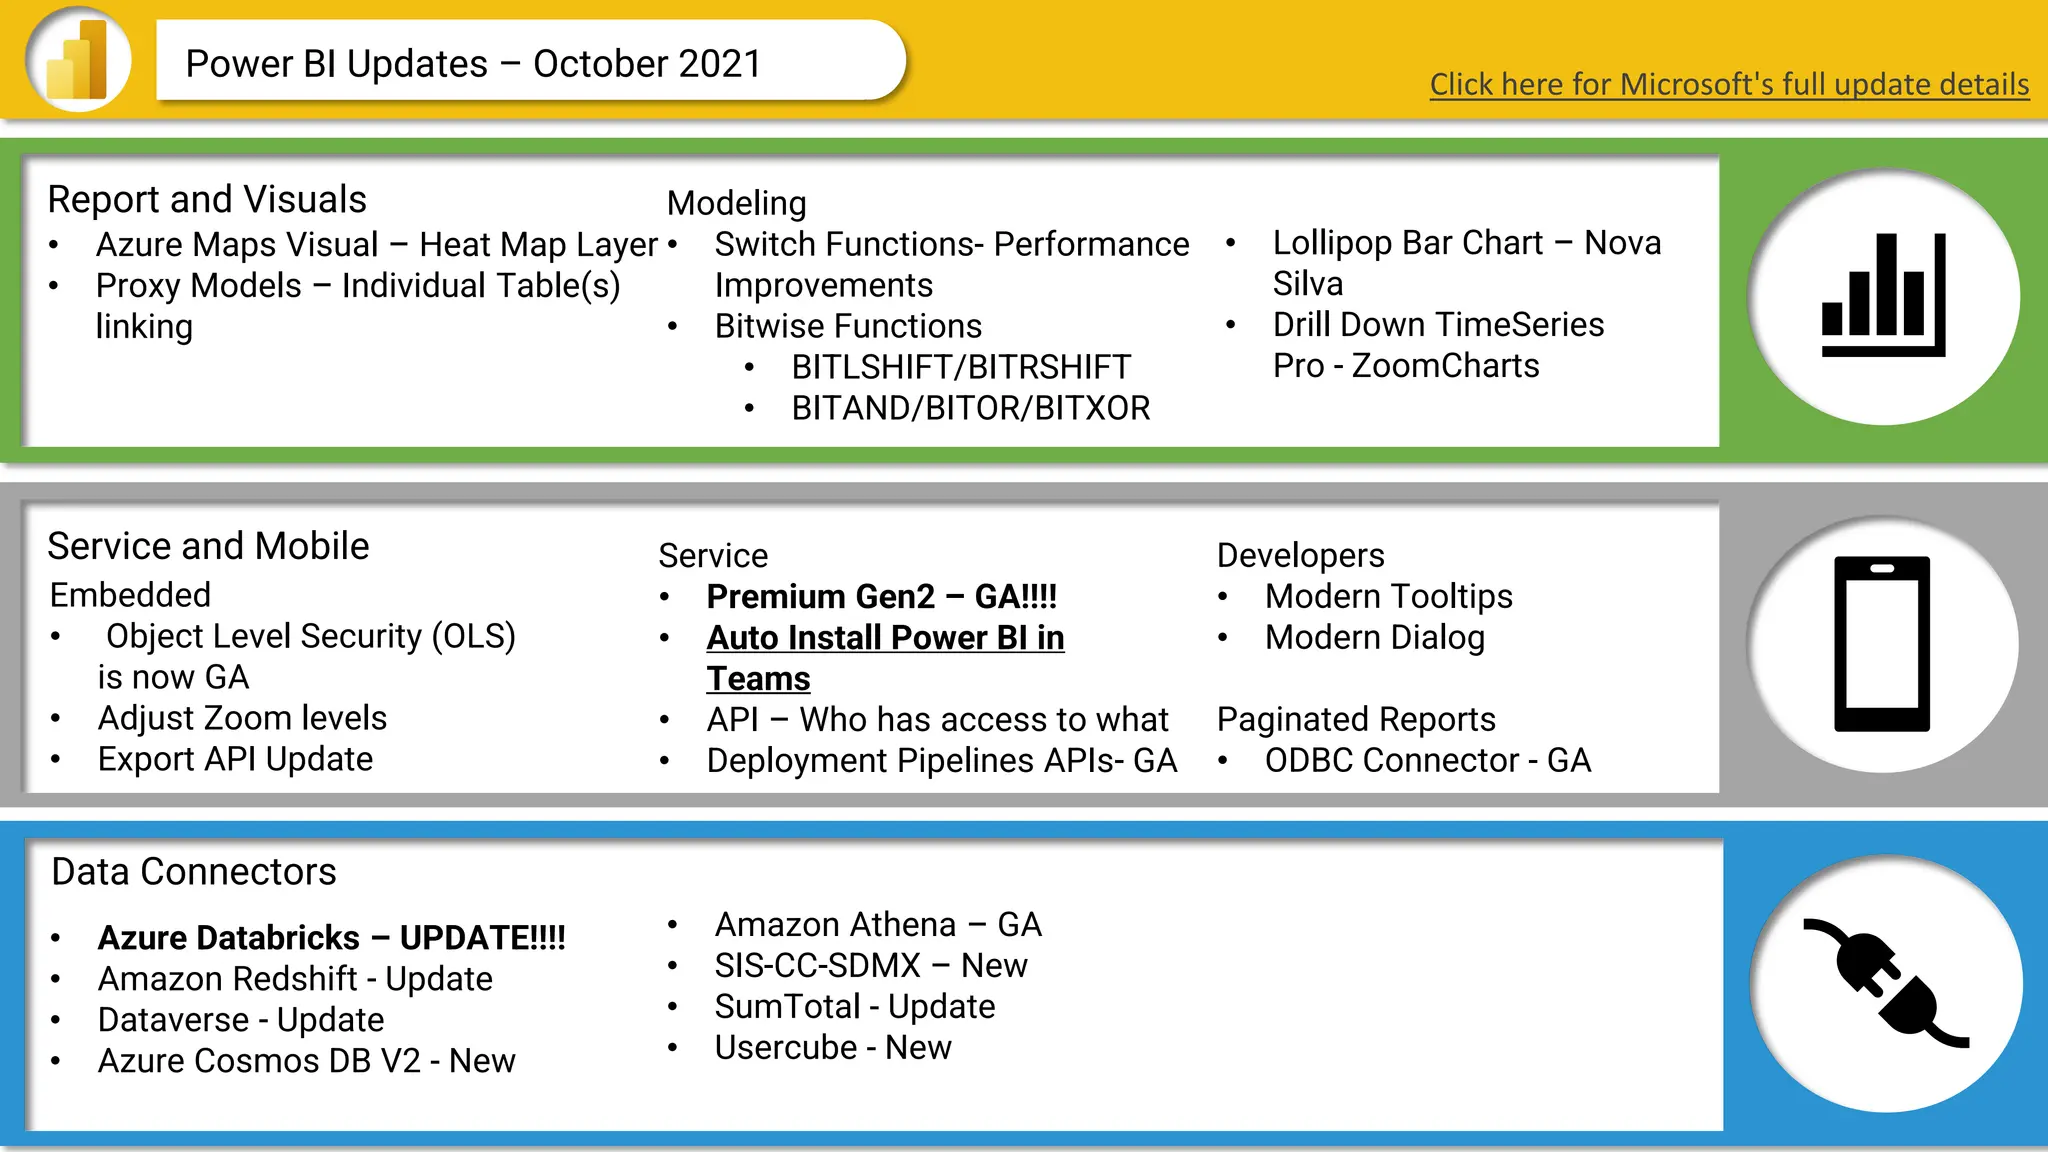
Power BI Updates – October 2021 Click here for Microsoft's full update details
• Azure Maps Visual – Heat Map Layer
• Proxy Models – Individual Table(s)
linking
Modeling
• Switch Functions- Performance
Improvements
• Bitwise Functions
• BITLSHIFT/BITRSHIFT
• BITAND/BITOR/BITXOR
• Lollipop Bar Chart – Nova
Silva
• Drill Down TimeSeries
Pro - ZoomCharts
Service
• Premium Gen2 – GA!!!!
• Auto Install Power BI in
Teams
• API – Who has access to what
• Deployment Pipelines APIs- GA
Embedded
• Object Level Security (OLS)
is now GA
• Adjust Zoom levels
• Export API Update
Developers
• Modern Tooltips
• Modern Dialog
Paginated Reports
• ODBC Connector - GA
• Azure Databricks – UPDATE!!!!
• Amazon Redshift - Update
• Dataverse - Update
• Azure Cosmos DB V2 - New
• Amazon Athena – GA
• SIS-CC-SDMX – New
• SumTotal - Update
• Usercube - New
28.
Data Connectors
Report andVisuals
Service and Mobile
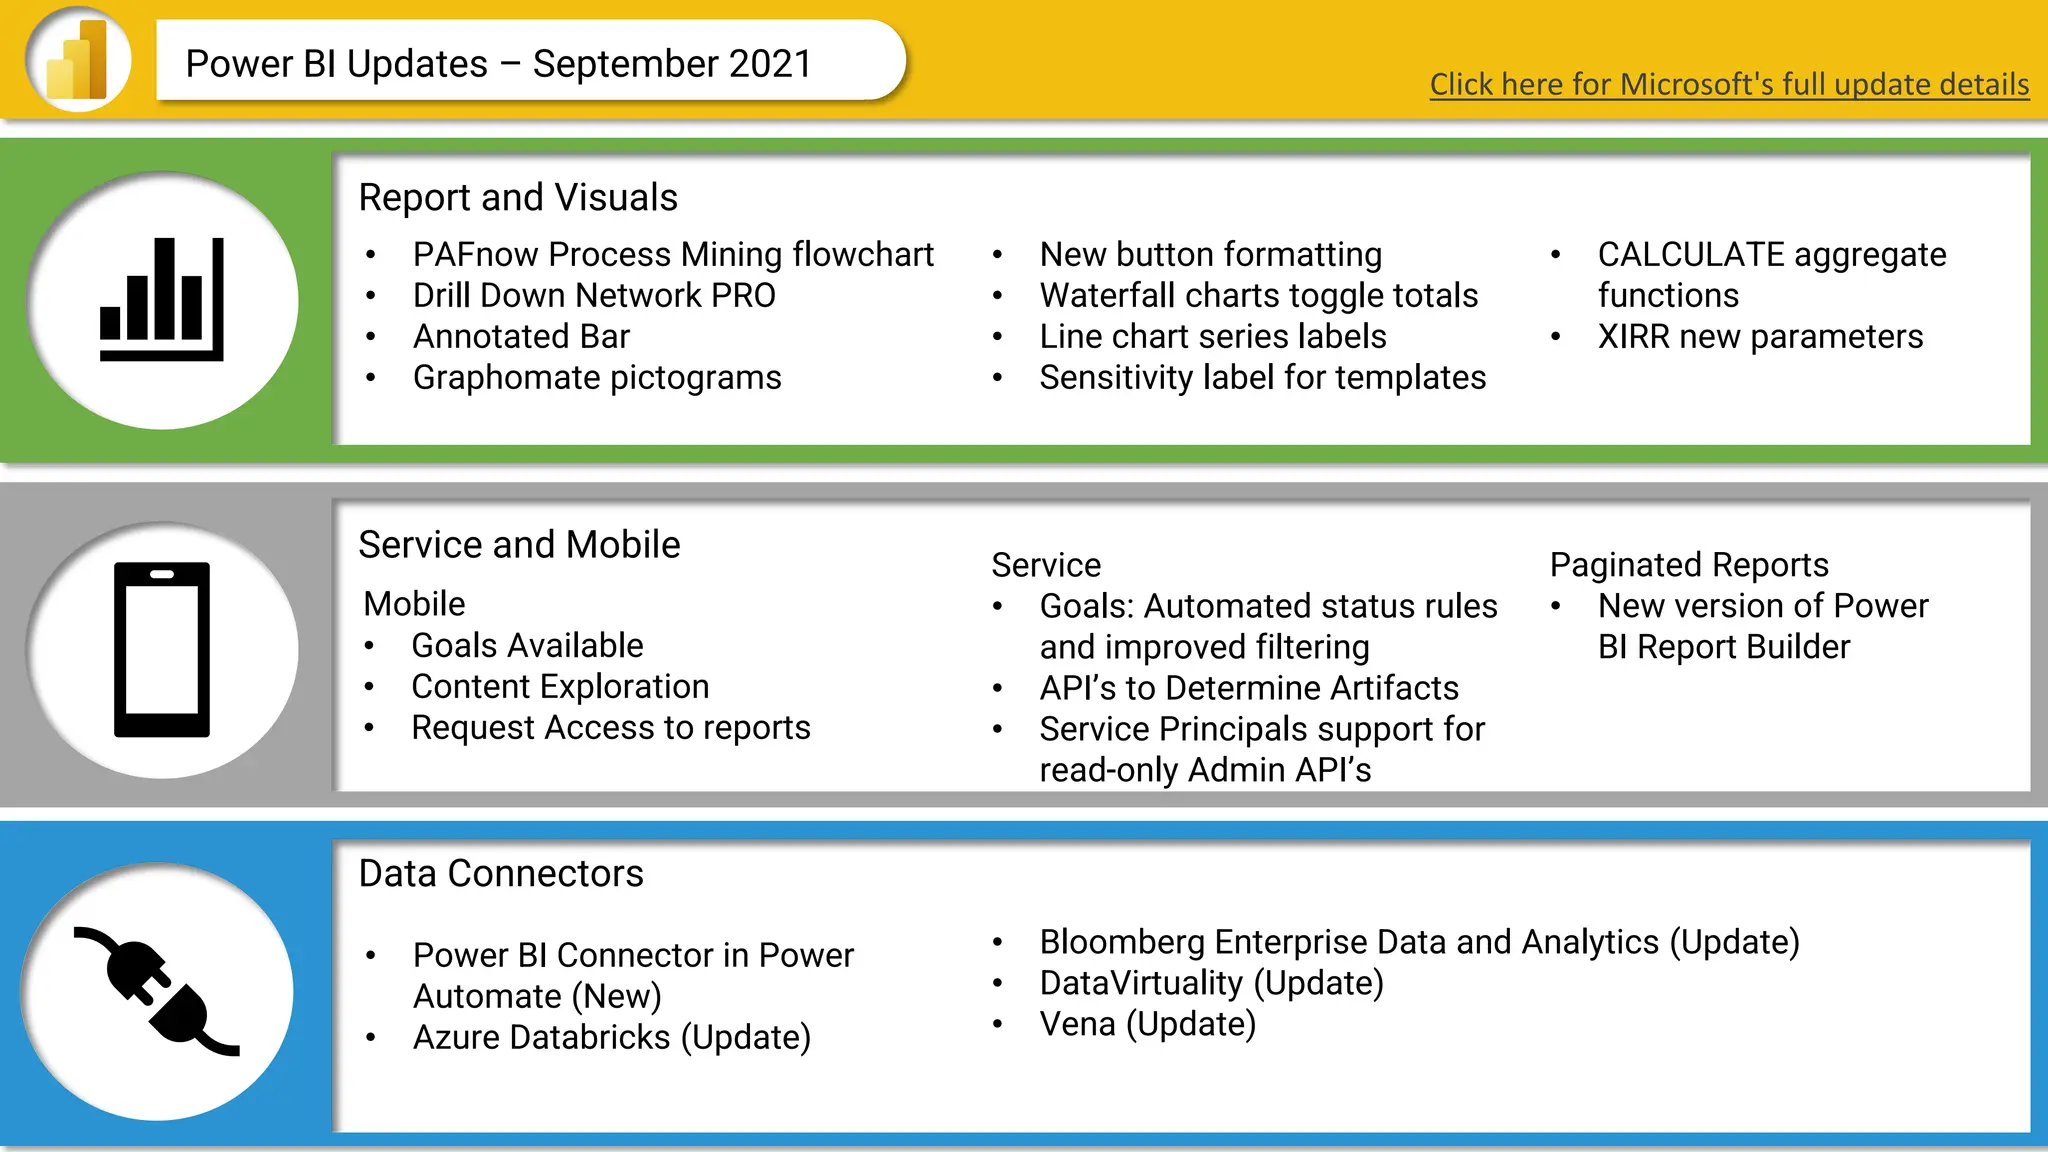
Power BI Updates – September 2021
• PAFnow Process Mining flowchart
• Drill Down Network PRO
• Annotated Bar
• Graphomate pictograms
• Power BI Connector in Power
Automate (New)
• Azure Databricks (Update)
• Bloomberg Enterprise Data and Analytics (Update)
• DataVirtuality (Update)
• Vena (Update)
Service
• Goals: Automated status rules
and improved filtering
• API’s to Determine Artifacts
• Service Principals support for
read-only Admin API’s
• New button formatting
• Waterfall charts toggle totals
• Line chart series labels
• Sensitivity label for templates
Mobile
• Goals Available
• Content Exploration
• Request Access to reports
Paginated Reports
• New version of Power
BI Report Builder
• CALCULATE aggregate
functions
• XIRR new parameters
Click here for Microsoft's full update details
29.
Authors
Helen Wall
LinkedIn Learning[in]structor for Power BI and AWS QuickSight | Data Science, Visualization, and
Analytics | helendatadesign.com
Helen is an instructor for several courses in the LinkedIn Learning library that focus on business
intelligence applications such as Microsoft’s Power BI and AWS QuickSight. Helen recorded the
videos comprising these courses, and also authored, developed, and designed the creative content
and projects within these courses. LinkedIn Learning is a paid subscription service, but it’s a great
investment to learn more about technology and business skills as a subscription allows you to
access unlimited courses in the online library.
Chris Wagner
Analytics Architect at Rockwell Automation | Analytics Rebel | Power BI Boss | White Rabbit
Chris has been working in the Data and Analytics space for nearly 20 years. Chris has dedicated
his professional career to making data and information accessible to the masses. A significant
component in making data available is continually learning new things and teaching others from
these experiences. To help people keep up with this ever-changing landscape, Chris frequently
posts on LinkedIn and to this blog.

![Authors
Helen Wall
LinkedIn Learning [in]structor for Power BI and AWS QuickSight | Data Science, Visualization, and
Analytics | helendatadesign.com
Helen is an instructor for several courses in the LinkedIn Learning library that focus on business
intelligence applications such as Microsoft’s Power BI and AWS QuickSight. Helen recorded the
videos comprising these courses, and also authored, developed, and designed the creative content
and projects within these courses. LinkedIn Learning is a paid subscription service, but it’s a great
investment to learn more about technology and business skills as a subscription allows you to
access unlimited courses in the online library.
Chris Wagner
Analytics Architect at Rockwell Automation | Analytics Rebel | Power BI Boss | White Rabbit
Chris has been working in the Data and Analytics space for nearly 20 years. Chris has dedicated
his professional career to making data and information accessible to the masses. A significant
component in making data available is continually learning new things and teaching others from
these experiences. To help people keep up with this ever-changing landscape, Chris frequently
posts on LinkedIn and to this blog.](https://image.slidesharecdn.com/powerbiupdates-november2023-250420163557-c8f7218e/75/Power-BI-Updates-____November-2023-pdf-29-2048.jpg)


