SlideShare a Scribd company logo
The marital status among the Tswana speaking people in South Africa
Lebogang Caroline Ngakane
Population Statistics Division, Statistics South Africa
References
Introduction
Marital status plays a significant role in determining household structure in many societies. In typical
African societies including the Tswana ethnic group, households are created through marriage rites and
many others are dissolved through marriage instability and deaths. Tswana speaking people are among
the many African ethnic groups that regard marriage as an important occasion in life-course of
individuals and creates a system that characterizes demographic and economic structures.
Traditionally, marriage is a process marked by a number of rituals and exchanges between the two
families. No single ritual or exchange was final in settling the existence of a marriage. Bride-
wealth/price commonly known as “bogadi” constituted about eight head of cattle was paid to the bride’s
family. The exchange was the most elaborate materially and ritually but it often occurred several years
after the couple had been cohabitating, after children had been born and occasionally after the death of
the wife (Mangwegap, 2013). Tswana culture, social organizations, ceremonies, language and religious
beliefs are similar to that of the other two Sotho groups (Pedi and Sotho), although some Tswana
chiefdoms were more highly stratified than those of other Sotho groups. Marriage patterns in Botswana,
a country dominated by Tswana people have witnessed considerable changes over the past three
decades, with trends showing significant increases in proportion never married and average age at
marriage (Gaisie, 1995; Mukamaambo, 1995; Mookodi, 2003).
Results
Figure 1: Percentage distribution of Tswana speaking persons in five-year age groups by marital
status: Census 2011
Figure 2: Percentage distribution of Tswana speaking persons by sex and marital status: Census 2011
Results
Table 1: Percentage distribution of Tswana speaking persons marital status by
demographic factors: Census 2011
Discussion & Conclusion
Figure 3: Percentage distribution of Tswana speaking people by province and marital status:
Census 2011
Objectives
The main objective of this study is to profile nuptial patterns among Tswana ethnic group in South
Africa.
The specific aims:
1. To estimate nuptial patterns and levels among Tswana speaking people.
2. To examine socio-demographic characteristics influencing marital behaviour among the Tswana
people
Contact
LebogangNg@statssa.gov.za
Data & Methods
The relationship between socio-demographic characteristics and the dependent variable marital status is
analyzed in this paper. This paper used cross-sectional data from the Census 2011 10% Sample. The
language question was used to identify Tswana speaking people. In analysis, both univariate and
bivariate methods were employed to profile characteristics of Tswana people in terms of sex, age,
education, employment status, province and geography type. Using bivariate analysis, relationship
between each independent variable (background characteristic) and dependent variable (marital status)
was examined. Chi-square was used to test association between marital status and the selected socio-
demographic characteristic, with level of significance of p˂ 0.001. Marital status was recoded into two
categories;
- Never married and;
-Ever married (combined the married, living together like married partners, divorced, separated and
widowed).
Also analysed using defined logistics regression model. Multivariate analysis in order to understand the
relationships between variables and their relevance to the actual problem being studied. Model 1 =
bivariate model; model 2 = multivariate model, excluding employment; model 3 = multivariate model,
including all variables for ages 15-64 years. Joanne and Harry (2002) defined logistics regression
model as following: 𝐼𝑛𝜌1−𝜌=𝛼+𝛽1𝑥1+𝛽2𝑥2+⋯+𝛽𝑖𝑥𝑖
Where 𝜌 is the probability of the event, 𝛼 is the Y intercept, 𝛽𝑠 are slope parameters and 𝑋𝑠 are a set of
predictors
 Older persons (75-79
and 80 has the highest
number of people who
are ever married as
compared to the other
age groups.
 Younger persons (20-
24 and 25-29) has the
highest number of
people who are never
married as compared
to the other age
groups.
 Tswana males
have the highest
proportion
(51.9%) to be
never married as
compared to the
females (48.1%).
 While, the
females (52.5%)
have the highest
proportion to be
ever married as
compared to the
males (47.5%).
 More women
tend to be have
married than the
males.
 The ever married group had the highest number of Tswana people reported to have never
been in school followed by the primary level while those in secondary level had the highest
number of people to be ever married followed by the tertiary level.
 This implies that those who are reported to have ever been married are those with no
education.
 The logistic regression shows that those aged 25-29 are more likely to be never married as
compared to those aged 30-34 years old.
 From the sex information it can be noted that females are more likely to be never married as
compared to the males while the level of education indicates a higher odds of the never
married Tswana people among secondary and primary level as compared to no schooling
level.
 When compared to those the employed, the likelihood of being never married is highest
among those who are unemployed.
 Tswana persons in traditional areas have higher odds of the never married people as
compared to those in urban and farms areas as noted from the three models.
 Both Northern Cape and Limpopo have higher odds of the Tswana people who are reported
to be never married
 All variables are significant at P<0.001. The information above proves that the younger people
are more likely to be never married as compared to older people among the Tswana speaking
people.
 More females are never married as compared to the males.
 Most Tswana people who are reported to have ever been married are those with no education.
 Most Tswana people who are never married leave in traditional areas.
 A majority of the never married tend to be unemployed.
 Most of the never married are found in Northern Cape and Limpopo.
1. BROCK, C. & TULASLEWICS, W. 1985. Cultural Identity and Educational Policy.
London: Croom Helm
2. Gaisie S K. 1995. Socio-economic Determinants of Fertility Decline in Botswana. Paper
Presented at the 1991 Population and Housing Census Dissemination Seminar, 1-4 May
1995, Gaborone, Botswana.
3. Mangwegap, M. Tswana - Marriage and Family. JRank Jan 15, 2013
4. Moffat, R 1842. Missionary labours in Southern Africa. London: John Shaw.

More Related Content

Viewers also liked

Linda Sick_Resume_Executive Assistant
Linda Sick_Resume_Executive AssistantLinda Sick_Resume_Executive Assistant
Linda Sick_Resume_Executive AssistantLinda Sick
 
JesseNash-Credits
JesseNash-CreditsJesseNash-Credits
JesseNash-CreditsJesse Nash
 
• Cuadro comparativo a partir de la redacción de objetivos, propósitos y comp...
•	Cuadro comparativo a partir de la redacción de objetivos, propósitos y comp...•	Cuadro comparativo a partir de la redacción de objetivos, propósitos y comp...
• Cuadro comparativo a partir de la redacción de objetivos, propósitos y comp...Kimberly Flores zatarain
 
USAID & ODA funded project thru BASC, 1996
USAID & ODA funded project thru BASC, 1996USAID & ODA funded project thru BASC, 1996
USAID & ODA funded project thru BASC, 1996Zia U.K. Mazumder
 
Anit no need foe price of satan.pt.1.jpeg
Anit no need foe price of satan.pt.1.jpegAnit no need foe price of satan.pt.1.jpeg
Anit no need foe price of satan.pt.1.jpegMCDub
 
Advanced Analytics Certificate Flyer
Advanced Analytics Certificate FlyerAdvanced Analytics Certificate Flyer
Advanced Analytics Certificate Flyermisanthropic777
 

Viewers also liked (10)

Linda Sick_Resume_Executive Assistant
Linda Sick_Resume_Executive AssistantLinda Sick_Resume_Executive Assistant
Linda Sick_Resume_Executive Assistant
 
Commscope 1427451 2
Commscope 1427451 2Commscope 1427451 2
Commscope 1427451 2
 
JesseNash-Credits
JesseNash-CreditsJesseNash-Credits
JesseNash-Credits
 
• Cuadro comparativo a partir de la redacción de objetivos, propósitos y comp...
•	Cuadro comparativo a partir de la redacción de objetivos, propósitos y comp...•	Cuadro comparativo a partir de la redacción de objetivos, propósitos y comp...
• Cuadro comparativo a partir de la redacción de objetivos, propósitos y comp...
 
USAID & ODA funded project thru BASC, 1996
USAID & ODA funded project thru BASC, 1996USAID & ODA funded project thru BASC, 1996
USAID & ODA funded project thru BASC, 1996
 
RESUMEAshley
RESUMEAshleyRESUMEAshley
RESUMEAshley
 
artwork cover
artwork coverartwork cover
artwork cover
 
Q
QQ
Q
 
Anit no need foe price of satan.pt.1.jpeg
Anit no need foe price of satan.pt.1.jpegAnit no need foe price of satan.pt.1.jpeg
Anit no need foe price of satan.pt.1.jpeg
 
Advanced Analytics Certificate Flyer
Advanced Analytics Certificate FlyerAdvanced Analytics Certificate Flyer
Advanced Analytics Certificate Flyer
 

Similar to Poster.ppt_Lebo

Kaow arsom lesthaeghe cohabitationglobal -
Kaow arsom lesthaeghe cohabitationglobal -Kaow arsom lesthaeghe cohabitationglobal -
Kaow arsom lesthaeghe cohabitationglobal -Ron Lesthaeghe
 
Soc 2113 ch 14 2017
Soc 2113 ch 14 2017Soc 2113 ch 14 2017
Soc 2113 ch 14 2017WendyScott34
 
Proximate Determinants of Fertility in Eastern Africa: The case of Kenya, Rw...
Proximate Determinants of Fertility in Eastern Africa: The case  of Kenya, Rw...Proximate Determinants of Fertility in Eastern Africa: The case  of Kenya, Rw...
Proximate Determinants of Fertility in Eastern Africa: The case of Kenya, Rw...Scientific Review SR
 
How does a gender lens contribute to a healthy environment and healthy people...
How does a gender lens contribute to a healthy environment and healthy people...How does a gender lens contribute to a healthy environment and healthy people...
How does a gender lens contribute to a healthy environment and healthy people...Jo Vearey
 
httpsezproxy.snhu.eduloginurl=httpssearch.ebscohost.com.docx
httpsezproxy.snhu.eduloginurl=httpssearch.ebscohost.com.docxhttpsezproxy.snhu.eduloginurl=httpssearch.ebscohost.com.docx
httpsezproxy.snhu.eduloginurl=httpssearch.ebscohost.com.docxpauline234567
 
Analysis on the Causes and Implications of Divorce in Keffi Local Government ...
Analysis on the Causes and Implications of Divorce in Keffi Local Government ...Analysis on the Causes and Implications of Divorce in Keffi Local Government ...
Analysis on the Causes and Implications of Divorce in Keffi Local Government ...Jackie Taylor
 
Status of women in Jamaica 2008
Status of women in Jamaica 2008Status of women in Jamaica 2008
Status of women in Jamaica 2008Taitu Heron
 
Gender issues
Gender issuesGender issues
Gender issuesReshma Kc
 
IMPACT OF EDUCATION ON DOMESTIC VIOLENCE
IMPACT OF EDUCATION ON DOMESTIC VIOLENCEIMPACT OF EDUCATION ON DOMESTIC VIOLENCE
IMPACT OF EDUCATION ON DOMESTIC VIOLENCESparkles Soft
 
IMPACT OF EDUCATION ON DOMESTIC VIOLENCE,
IMPACT OF EDUCATION ON DOMESTIC VIOLENCE,IMPACT OF EDUCATION ON DOMESTIC VIOLENCE,
IMPACT OF EDUCATION ON DOMESTIC VIOLENCE,Sparkles Soft
 
AS GEOGRAPHY REVISION - MIGRATION - 5.1 MIGRATION AS POPULATION CHANGE
AS GEOGRAPHY REVISION - MIGRATION - 5.1 MIGRATION AS POPULATION CHANGEAS GEOGRAPHY REVISION - MIGRATION - 5.1 MIGRATION AS POPULATION CHANGE
AS GEOGRAPHY REVISION - MIGRATION - 5.1 MIGRATION AS POPULATION CHANGEGeorge Dumitrache
 
CAMBRIDGE AS GEOGRAPHY REVISION: POPULATION - 4.1 NATURAL INCREASE
CAMBRIDGE AS GEOGRAPHY REVISION: POPULATION - 4.1 NATURAL INCREASECAMBRIDGE AS GEOGRAPHY REVISION: POPULATION - 4.1 NATURAL INCREASE
CAMBRIDGE AS GEOGRAPHY REVISION: POPULATION - 4.1 NATURAL INCREASEGeorge Dumitrache
 
Family diversity lesson
Family diversity lessonFamily diversity lesson
Family diversity lessonPhoebe_Johnson
 
Poverty and Sexual Risk-taking in Africa
Poverty and Sexual Risk-taking in AfricaPoverty and Sexual Risk-taking in Africa
Poverty and Sexual Risk-taking in AfricaIDS
 
EFFECT OF PARENTS’ INFLUENCE ON SEXUAL BEHAVIOUR AMONG STUDENTS IN SECONDAR...
EFFECT OF PARENTS’ INFLUENCE ON   SEXUAL BEHAVIOUR AMONG STUDENTS IN SECONDAR...EFFECT OF PARENTS’ INFLUENCE ON   SEXUAL BEHAVIOUR AMONG STUDENTS IN SECONDAR...
EFFECT OF PARENTS’ INFLUENCE ON SEXUAL BEHAVIOUR AMONG STUDENTS IN SECONDAR...paperpublications3
 

Similar to Poster.ppt_Lebo (20)

Kaow arsom lesthaeghe cohabitationglobal -
Kaow arsom lesthaeghe cohabitationglobal -Kaow arsom lesthaeghe cohabitationglobal -
Kaow arsom lesthaeghe cohabitationglobal -
 
Soc 2113 ch 14 2017
Soc 2113 ch 14 2017Soc 2113 ch 14 2017
Soc 2113 ch 14 2017
 
The Historical Origin of Differences in Gender Norms
The Historical Origin of Differences in Gender NormsThe Historical Origin of Differences in Gender Norms
The Historical Origin of Differences in Gender Norms
 
Mukesh mishra
Mukesh mishraMukesh mishra
Mukesh mishra
 
age and sex structure
 age and sex structure age and sex structure
age and sex structure
 
Proximate Determinants of Fertility in Eastern Africa: The case of Kenya, Rw...
Proximate Determinants of Fertility in Eastern Africa: The case  of Kenya, Rw...Proximate Determinants of Fertility in Eastern Africa: The case  of Kenya, Rw...
Proximate Determinants of Fertility in Eastern Africa: The case of Kenya, Rw...
 
How does a gender lens contribute to a healthy environment and healthy people...
How does a gender lens contribute to a healthy environment and healthy people...How does a gender lens contribute to a healthy environment and healthy people...
How does a gender lens contribute to a healthy environment and healthy people...
 
httpsezproxy.snhu.eduloginurl=httpssearch.ebscohost.com.docx
httpsezproxy.snhu.eduloginurl=httpssearch.ebscohost.com.docxhttpsezproxy.snhu.eduloginurl=httpssearch.ebscohost.com.docx
httpsezproxy.snhu.eduloginurl=httpssearch.ebscohost.com.docx
 
Analysis on the Causes and Implications of Divorce in Keffi Local Government ...
Analysis on the Causes and Implications of Divorce in Keffi Local Government ...Analysis on the Causes and Implications of Divorce in Keffi Local Government ...
Analysis on the Causes and Implications of Divorce in Keffi Local Government ...
 
Status of women in Jamaica 2008
Status of women in Jamaica 2008Status of women in Jamaica 2008
Status of women in Jamaica 2008
 
Gender issues
Gender issuesGender issues
Gender issues
 
IMPACT OF EDUCATION ON DOMESTIC VIOLENCE
IMPACT OF EDUCATION ON DOMESTIC VIOLENCEIMPACT OF EDUCATION ON DOMESTIC VIOLENCE
IMPACT OF EDUCATION ON DOMESTIC VIOLENCE
 
IMPACT OF EDUCATION ON DOMESTIC VIOLENCE,
IMPACT OF EDUCATION ON DOMESTIC VIOLENCE,IMPACT OF EDUCATION ON DOMESTIC VIOLENCE,
IMPACT OF EDUCATION ON DOMESTIC VIOLENCE,
 
AS GEOGRAPHY REVISION - MIGRATION - 5.1 MIGRATION AS POPULATION CHANGE
AS GEOGRAPHY REVISION - MIGRATION - 5.1 MIGRATION AS POPULATION CHANGEAS GEOGRAPHY REVISION - MIGRATION - 5.1 MIGRATION AS POPULATION CHANGE
AS GEOGRAPHY REVISION - MIGRATION - 5.1 MIGRATION AS POPULATION CHANGE
 
CAMBRIDGE AS GEOGRAPHY REVISION: POPULATION - 4.1 NATURAL INCREASE
CAMBRIDGE AS GEOGRAPHY REVISION: POPULATION - 4.1 NATURAL INCREASECAMBRIDGE AS GEOGRAPHY REVISION: POPULATION - 4.1 NATURAL INCREASE
CAMBRIDGE AS GEOGRAPHY REVISION: POPULATION - 4.1 NATURAL INCREASE
 
Family diversity lesson
Family diversity lessonFamily diversity lesson
Family diversity lesson
 
Ppt,contempo
Ppt,contempoPpt,contempo
Ppt,contempo
 
Poverty and Sexual Risk-taking in Africa
Poverty and Sexual Risk-taking in AfricaPoverty and Sexual Risk-taking in Africa
Poverty and Sexual Risk-taking in Africa
 
UNICEF-CSAAC
UNICEF-CSAACUNICEF-CSAAC
UNICEF-CSAAC
 
EFFECT OF PARENTS’ INFLUENCE ON SEXUAL BEHAVIOUR AMONG STUDENTS IN SECONDAR...
EFFECT OF PARENTS’ INFLUENCE ON   SEXUAL BEHAVIOUR AMONG STUDENTS IN SECONDAR...EFFECT OF PARENTS’ INFLUENCE ON   SEXUAL BEHAVIOUR AMONG STUDENTS IN SECONDAR...
EFFECT OF PARENTS’ INFLUENCE ON SEXUAL BEHAVIOUR AMONG STUDENTS IN SECONDAR...
 

Poster.ppt_Lebo

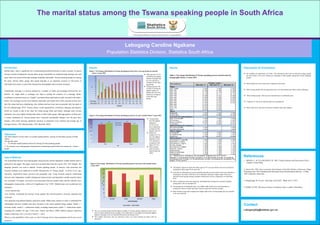
  • 1. The marital status among the Tswana speaking people in South Africa Lebogang Caroline Ngakane Population Statistics Division, Statistics South Africa References Introduction Marital status plays a significant role in determining household structure in many societies. In typical African societies including the Tswana ethnic group, households are created through marriage rites and many others are dissolved through marriage instability and deaths. Tswana speaking people are among the many African ethnic groups that regard marriage as an important occasion in life-course of individuals and creates a system that characterizes demographic and economic structures. Traditionally, marriage is a process marked by a number of rituals and exchanges between the two families. No single ritual or exchange was final in settling the existence of a marriage. Bride- wealth/price commonly known as “bogadi” constituted about eight head of cattle was paid to the bride’s family. The exchange was the most elaborate materially and ritually but it often occurred several years after the couple had been cohabitating, after children had been born and occasionally after the death of the wife (Mangwegap, 2013). Tswana culture, social organizations, ceremonies, language and religious beliefs are similar to that of the other two Sotho groups (Pedi and Sotho), although some Tswana chiefdoms were more highly stratified than those of other Sotho groups. Marriage patterns in Botswana, a country dominated by Tswana people have witnessed considerable changes over the past three decades, with trends showing significant increases in proportion never married and average age at marriage (Gaisie, 1995; Mukamaambo, 1995; Mookodi, 2003). Results Figure 1: Percentage distribution of Tswana speaking persons in five-year age groups by marital status: Census 2011 Figure 2: Percentage distribution of Tswana speaking persons by sex and marital status: Census 2011 Results Table 1: Percentage distribution of Tswana speaking persons marital status by demographic factors: Census 2011 Discussion & Conclusion Figure 3: Percentage distribution of Tswana speaking people by province and marital status: Census 2011 Objectives The main objective of this study is to profile nuptial patterns among Tswana ethnic group in South Africa. The specific aims: 1. To estimate nuptial patterns and levels among Tswana speaking people. 2. To examine socio-demographic characteristics influencing marital behaviour among the Tswana people Contact LebogangNg@statssa.gov.za Data & Methods The relationship between socio-demographic characteristics and the dependent variable marital status is analyzed in this paper. This paper used cross-sectional data from the Census 2011 10% Sample. The language question was used to identify Tswana speaking people. In analysis, both univariate and bivariate methods were employed to profile characteristics of Tswana people in terms of sex, age, education, employment status, province and geography type. Using bivariate analysis, relationship between each independent variable (background characteristic) and dependent variable (marital status) was examined. Chi-square was used to test association between marital status and the selected socio- demographic characteristic, with level of significance of p˂ 0.001. Marital status was recoded into two categories; - Never married and; -Ever married (combined the married, living together like married partners, divorced, separated and widowed). Also analysed using defined logistics regression model. Multivariate analysis in order to understand the relationships between variables and their relevance to the actual problem being studied. Model 1 = bivariate model; model 2 = multivariate model, excluding employment; model 3 = multivariate model, including all variables for ages 15-64 years. Joanne and Harry (2002) defined logistics regression model as following: 𝐼𝑛𝜌1−𝜌=𝛼+𝛽1𝑥1+𝛽2𝑥2+⋯+𝛽𝑖𝑥𝑖 Where 𝜌 is the probability of the event, 𝛼 is the Y intercept, 𝛽𝑠 are slope parameters and 𝑋𝑠 are a set of predictors  Older persons (75-79 and 80 has the highest number of people who are ever married as compared to the other age groups.  Younger persons (20- 24 and 25-29) has the highest number of people who are never married as compared to the other age groups.  Tswana males have the highest proportion (51.9%) to be never married as compared to the females (48.1%).  While, the females (52.5%) have the highest proportion to be ever married as compared to the males (47.5%).  More women tend to be have married than the males.  The ever married group had the highest number of Tswana people reported to have never been in school followed by the primary level while those in secondary level had the highest number of people to be ever married followed by the tertiary level.  This implies that those who are reported to have ever been married are those with no education.  The logistic regression shows that those aged 25-29 are more likely to be never married as compared to those aged 30-34 years old.  From the sex information it can be noted that females are more likely to be never married as compared to the males while the level of education indicates a higher odds of the never married Tswana people among secondary and primary level as compared to no schooling level.  When compared to those the employed, the likelihood of being never married is highest among those who are unemployed.  Tswana persons in traditional areas have higher odds of the never married people as compared to those in urban and farms areas as noted from the three models.  Both Northern Cape and Limpopo have higher odds of the Tswana people who are reported to be never married  All variables are significant at P<0.001. The information above proves that the younger people are more likely to be never married as compared to older people among the Tswana speaking people.  More females are never married as compared to the males.  Most Tswana people who are reported to have ever been married are those with no education.  Most Tswana people who are never married leave in traditional areas.  A majority of the never married tend to be unemployed.  Most of the never married are found in Northern Cape and Limpopo. 1. BROCK, C. & TULASLEWICS, W. 1985. Cultural Identity and Educational Policy. London: Croom Helm 2. Gaisie S K. 1995. Socio-economic Determinants of Fertility Decline in Botswana. Paper Presented at the 1991 Population and Housing Census Dissemination Seminar, 1-4 May 1995, Gaborone, Botswana. 3. Mangwegap, M. Tswana - Marriage and Family. JRank Jan 15, 2013 4. Moffat, R 1842. Missionary labours in Southern Africa. London: John Shaw.