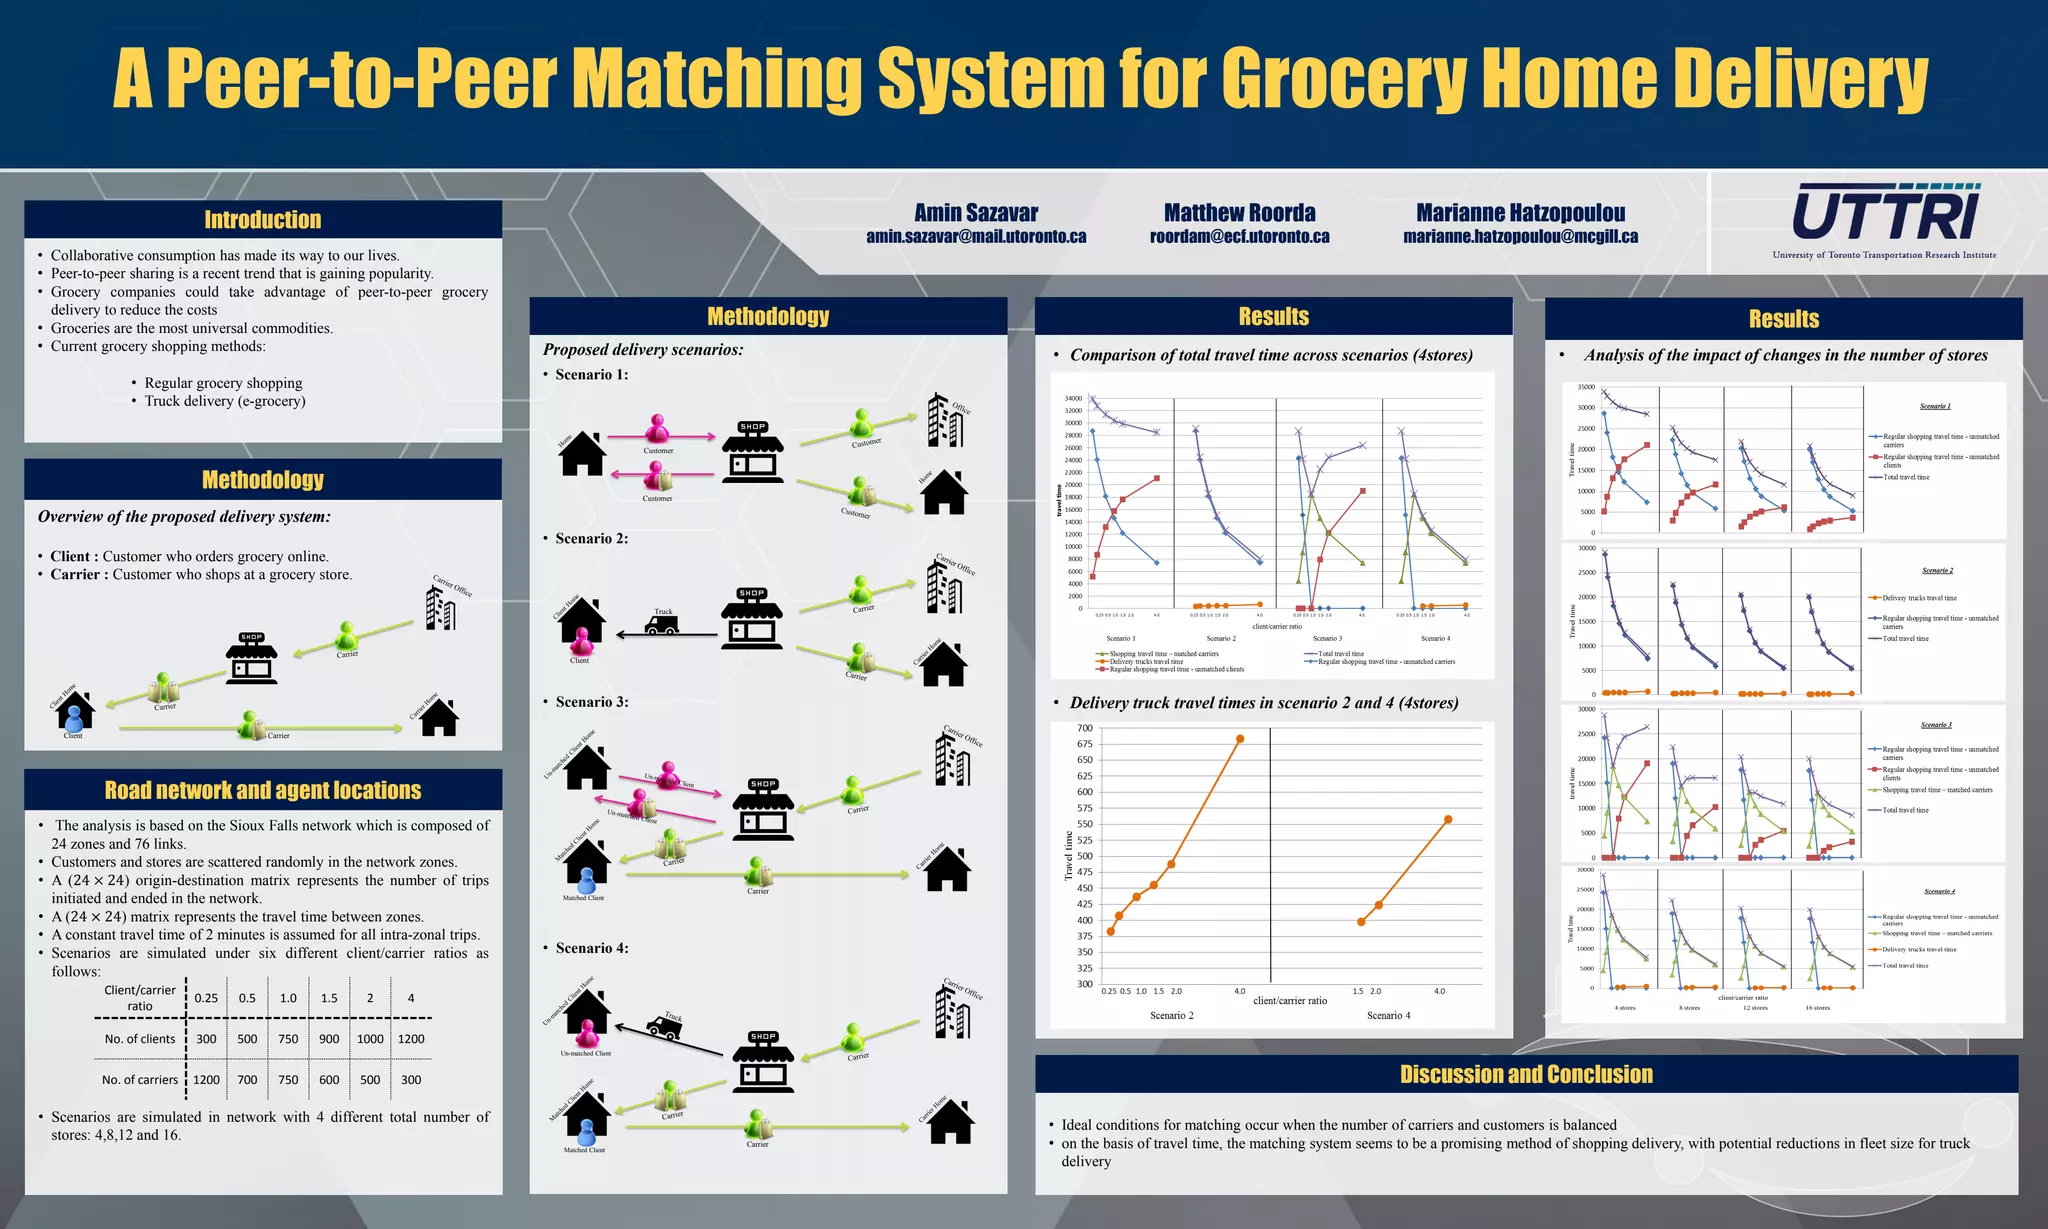
Amin Sazavar
amin.sazavar@mail.utoronto.ca
A Peer-to-Peer Matching System for Grocery Home Delivery
Matthew Roorda
roordam@ecf.utoronto.ca
Marianne Hatzopoulou
marianne.hatzopoulou@mcgill.ca
• Collaborative consumption has made its way to our lives.
• Peer-to-peer sharing is a recent trend that is gaining popularity.
• Grocery companies could take advantage of peer-to-peer grocery
delivery to reduce the costs
• Groceries are the most universal commodities.
• Current grocery shopping methods:
• Regular grocery shopping
• Truck delivery (e-grocery)
Introduction
Overview of the proposed delivery system:
• Client : Customer who orders grocery online.
• Carrier : Customer who shops at a grocery store.
Proposed delivery scenarios:
• Scenario 1:
• Scenario 2:
• Scenario 3:
• Scenario 4:
• Analysis of the impact of changes in the number of stores
Results
Methodology
Methodology
• Comparison of total travel time across scenarios (4stores)
• Delivery truck travel times in scenario 2 and 4 (4stores)
Results
• The analysis is based on the Sioux Falls network which is composed of
24 zones and 76 links.
• Customers and stores are scattered randomly in the network zones.
• A (24 × 24) origin-destination matrix represents the number of trips
initiated and ended in the network.
• A (24 × 24) matrix represents the travel time between zones.
• A constant travel time of 2 minutes is assumed for all intra-zonal trips.
• Scenarios are simulated under six different client/carrier ratios as
follows:
• Scenarios are simulated in network with 4 different total number of
stores: 4,8,12 and 16.
Road network and agent locations
• Ideal conditions for matching occur when the number of carriers and customers is balanced
• on the basis of travel time, the matching system seems to be a promising method of shopping delivery, with potential reductions in fleet size for truck
delivery
Discussion and Conclusion
Carrier
Carrier
Client
Matched Client
Un-matched Client
Matched Client
CarrierClient
Client/carrier
ratio
0.25 0.5 1.0 1.5 2 4
No. of clients 300 500 750 900 1000 1200
No. of carriers 1200 700 750 600 500 300
Truck
Customer
Customer

Poster Amin - 2

  • 1.
    Amin Sazavar amin.sazavar@mail.utoronto.ca A Peer-to-PeerMatching System for Grocery Home Delivery Matthew Roorda roordam@ecf.utoronto.ca Marianne Hatzopoulou marianne.hatzopoulou@mcgill.ca • Collaborative consumption has made its way to our lives. • Peer-to-peer sharing is a recent trend that is gaining popularity. • Grocery companies could take advantage of peer-to-peer grocery delivery to reduce the costs • Groceries are the most universal commodities. • Current grocery shopping methods: • Regular grocery shopping • Truck delivery (e-grocery) Introduction Overview of the proposed delivery system: • Client : Customer who orders grocery online. • Carrier : Customer who shops at a grocery store. Proposed delivery scenarios: • Scenario 1: • Scenario 2: • Scenario 3: • Scenario 4: • Analysis of the impact of changes in the number of stores Results Methodology Methodology • Comparison of total travel time across scenarios (4stores) • Delivery truck travel times in scenario 2 and 4 (4stores) Results • The analysis is based on the Sioux Falls network which is composed of 24 zones and 76 links. • Customers and stores are scattered randomly in the network zones. • A (24 × 24) origin-destination matrix represents the number of trips initiated and ended in the network. • A (24 × 24) matrix represents the travel time between zones. • A constant travel time of 2 minutes is assumed for all intra-zonal trips. • Scenarios are simulated under six different client/carrier ratios as follows: • Scenarios are simulated in network with 4 different total number of stores: 4,8,12 and 16. Road network and agent locations • Ideal conditions for matching occur when the number of carriers and customers is balanced • on the basis of travel time, the matching system seems to be a promising method of shopping delivery, with potential reductions in fleet size for truck delivery Discussion and Conclusion Carrier Carrier Client Matched Client Un-matched Client Matched Client CarrierClient Client/carrier ratio 0.25 0.5 1.0 1.5 2 4 No. of clients 300 500 750 900 1000 1200 No. of carriers 1200 700 750 600 500 300 Truck Customer Customer