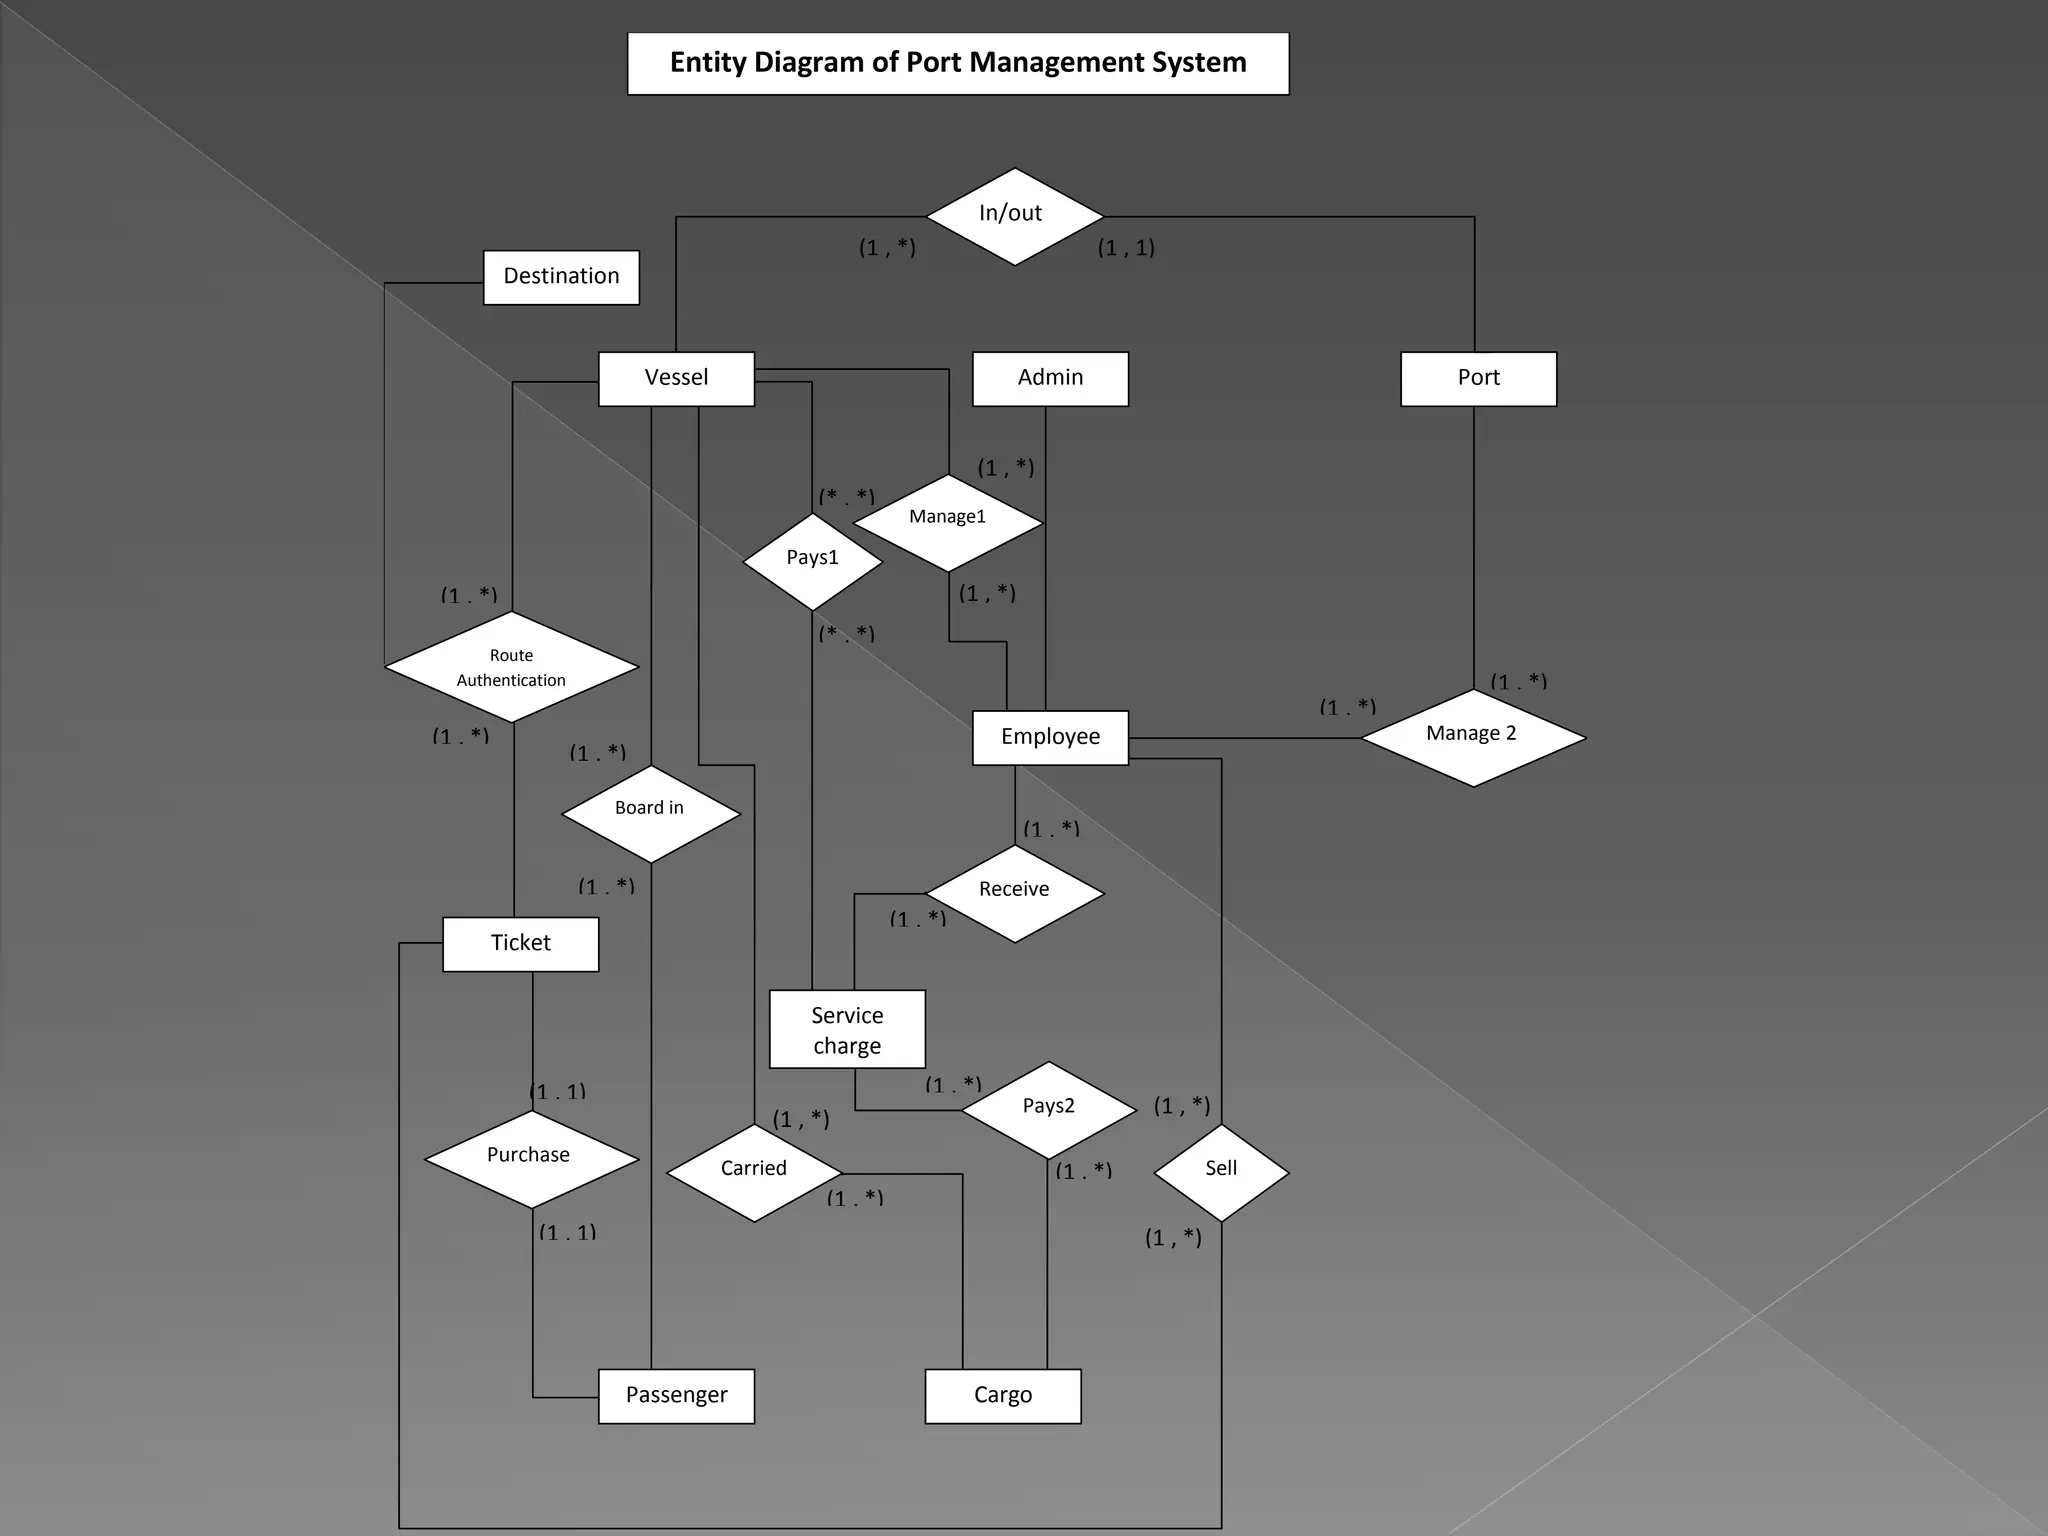
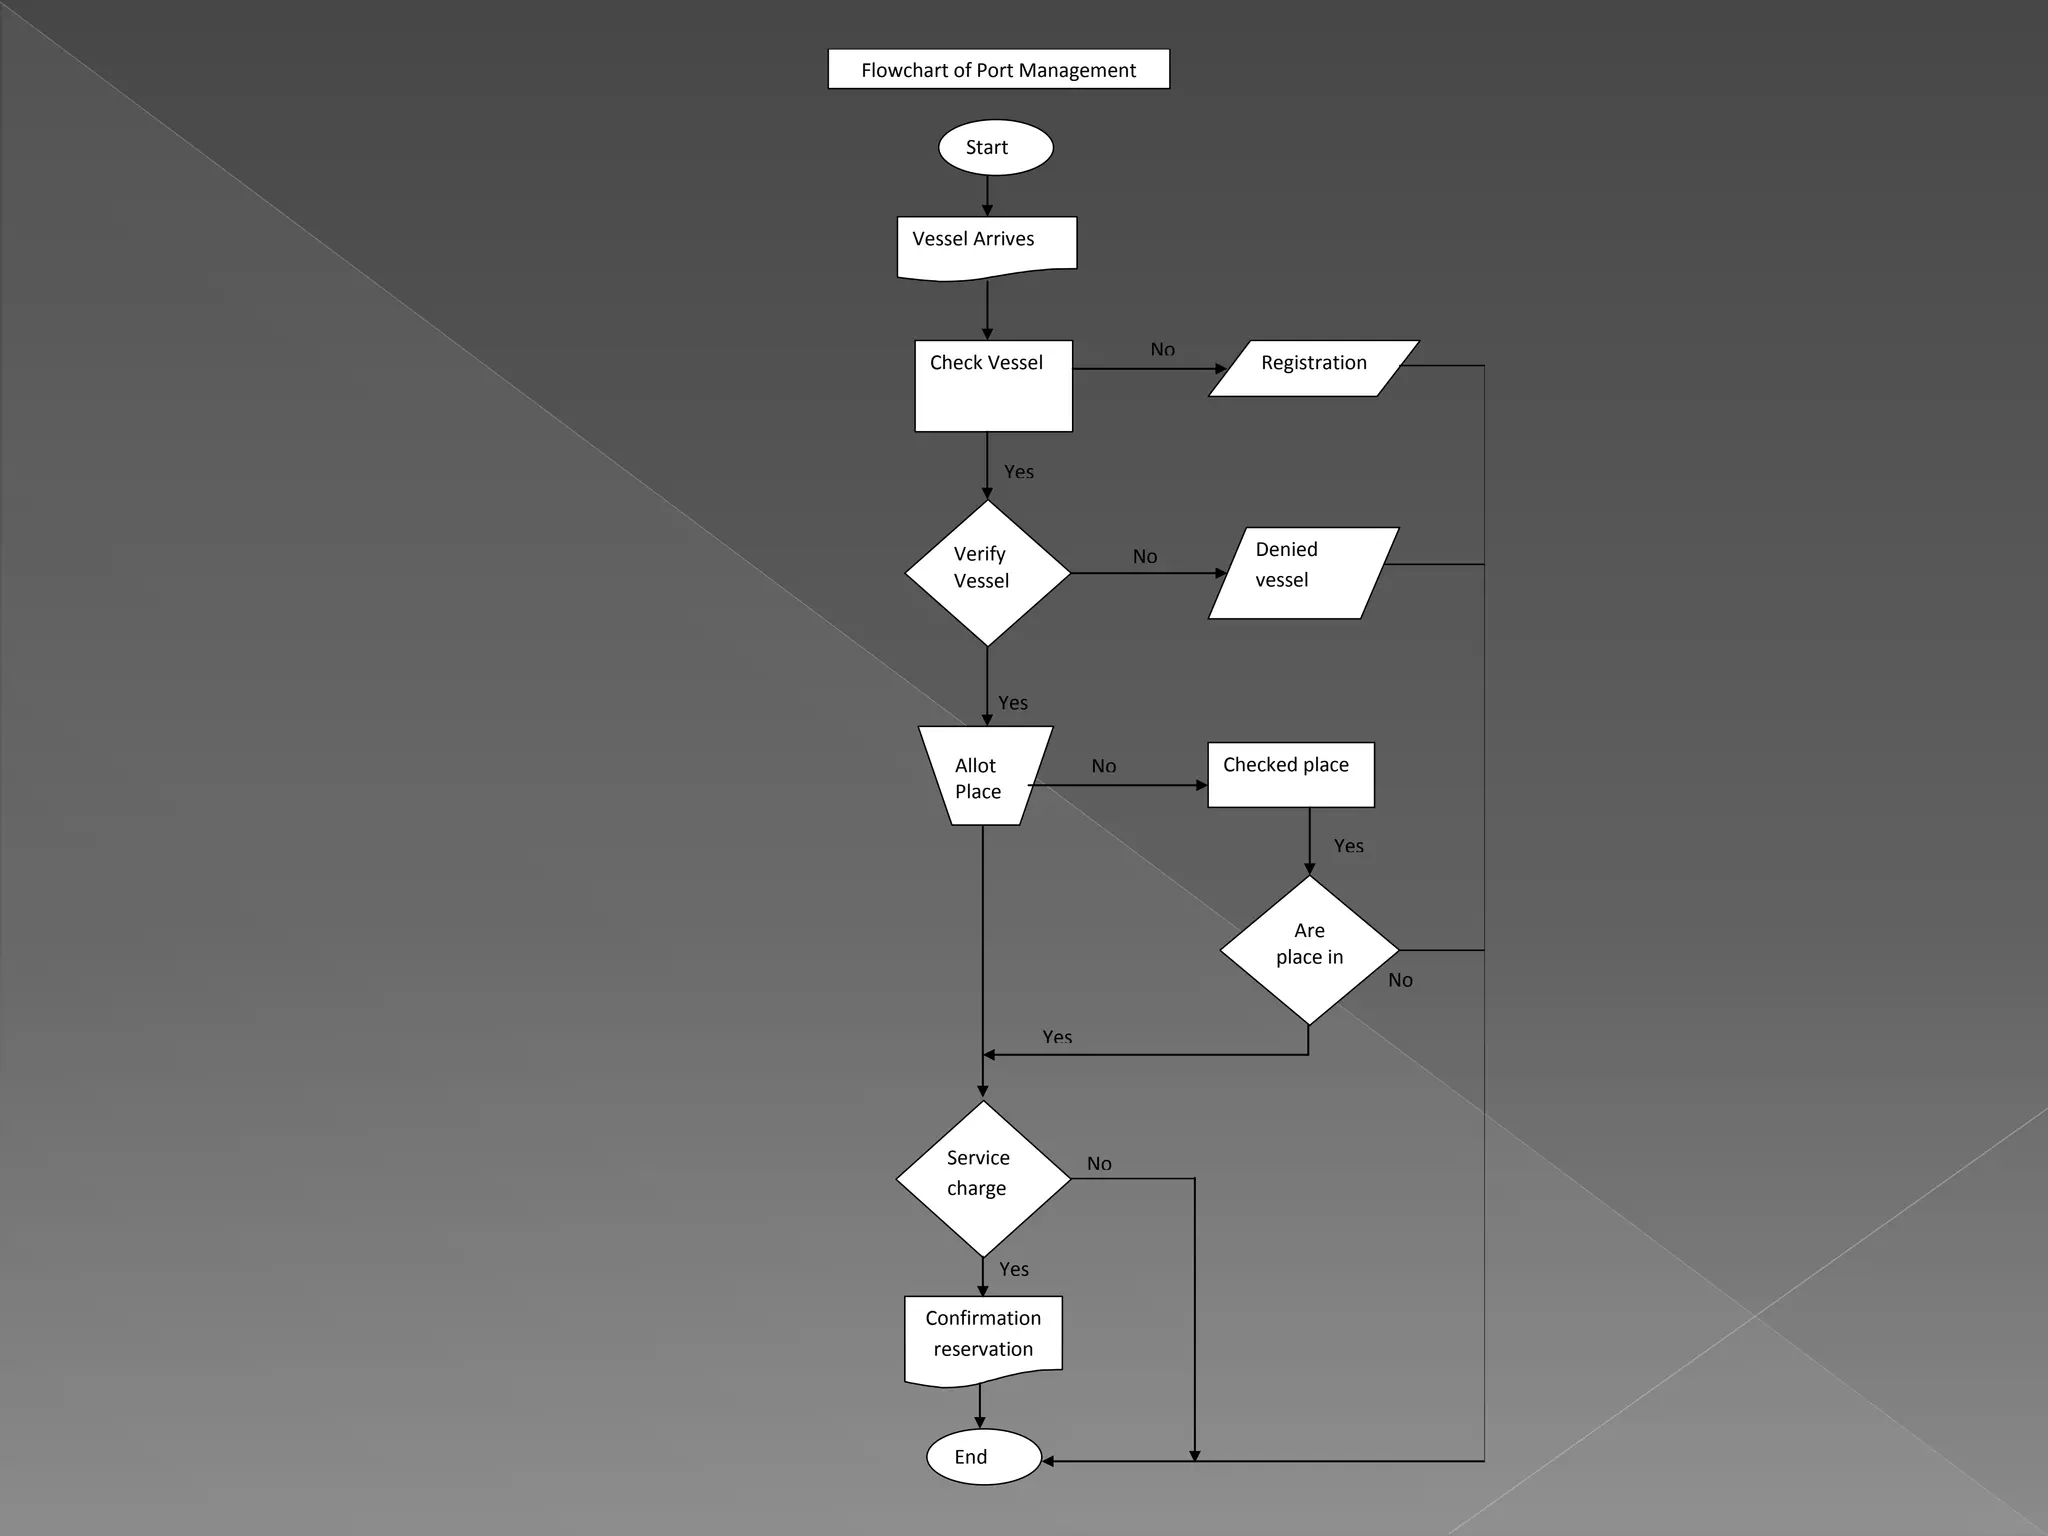
This presentation is unique. I can not find any assignment about Port Management in Site. So I have uploaded this presentation as a result students understand about Port Management System's E-R Diagram, Flowchart, and DFD.
Thank You
9. Entity Diagram of Port Management System
Port
In/out
Admin
Vessel
Employee
Ticket
Manage
Destination
Service
charge
Pays1
Receive
Passenger
Route
Authentication
Cargo
Purchase
Sell
Board in
Carried
Pays2
ID(PK)
Name
Address
Mob. No.
ID(PK)
Name
Address
Mob. No.
ID(PK) Owner
Name
Price No. (PK)
Seat no.
ID(PK) Name
Mo. No. Address
ID(PK)Name
ID(PK) Address
ID(PK) Item name
ID(PK)
Name
12. No
Start
Vessel Arrives
Check Vessel
Are
place in
Allot
Place
Service
charge
Confirmation
reservation
End
Registration
Denied
vessel
Checked place
Verify
Vessel
Yes
No
No
No
Yes
Yes
Yes
No
Yes
Flowchart of Port Management
20. It describes the boundaries of the system.
It is beneficial for communicating existing system
knowledge to the users.
A straightforward graphical technique which is easy
to recognize.
DFDs can provide a detailed representation of
system components.
It is used as the part of system documentation file.
DFDs are easier to understand by technical and
nontechnical audiences
It is logic systmem.
Editor's Notes
An enterprise information system (EIS) is any kind of information system which improves the functions of an enterprise business processes by integration. ... An EIS must be able to be used by all parts and all levels of an enterprise.
After completed this Presentation we will be learn about Port Management’s ER Diagram, Flowchart, Varies of Data Flow Diagram and more.
Port is a harbor inside town or city where ships load or unload. Where passenger and different kinds of products loaded and uploaded from one place to another place. When entire port is managed by employee or CEO by using computerized System then it is called Port Management System.
Star UML is an open source software modeling tool.
Microsoft Office is an office suite of applications,
Entity Relationship Diagram (ERD) is a visual representation of Different related data. It gives clear picture of Database Structure. It is a prototype that is useful to implement Database by using SQL, Oracle etc. To implement Database we should follow three step which are Conceptual, Logical and physical data model
Entity-Relationship (ER) Grammar notation
Grammar Format:
Entity: EmployeeEntity: VesselEntity: PortEntity: Admin (Weak)Entity: Service chargeEntity: PassengerEntity: TicketEntity: CargoEntity: Destination
Relationship: Manage1Connected Entities: (1, *) Employee (1, *) Vessel
Relationship: Manage 2Connected Entities: (1, *) Employee (1, *) Port
Relationship: ReceiveConnected Entities: (1, *) Employee (1, *) Service Charge
Relationship: SellConnected Entities: (1, *) Employee (1, *) Ticket
Relationship: In/outConnected Entities: (1, *) Vessel (1, 1) Port
Relationship: Pays 1Connected Entities: (1, *) Vessel (1, *) Service chargeRelationship: CarriedConnected Entities: (1, *) Vessel (1, *) Cargo
Relationship: Board inConnected Entities: (1, 1) Vessel (1, 1) Passenger
Relationship: Route Authentication Connected Entities: (1, *) Vessel (1, *) Ticket
Relationship: Route Authentication Connected Entities: (1, *) Destination (1, *) Ticket
Relationship: Purchase Connected Entities: (1, *) Passenger (1, *) Ticket
Relationship: Pays 2 Connected Entities: (1, *) Service charge (1, *) Cargo
(Employee/Vessel) Cardinalities
Employees are necessarily assigned to Vessel.- Minimum Participation of Employee = 1
Every Vessel has at least one employee assigned to control it.- Minimum participation of Vessel = 1
Many employees can work in a Vessel.- Maximum Participation of Employee = N(*)
A Vessel may have many employees assigned to it.- Maximum participation of Vessel = N(*)
(Employee/Port Dept.) Cardinalities
Employees are necessarily assigned to Port Dept.- Minimum Participation of Employee = 1
Every Port Dept. has at least one employee assigned to it. - Minimum participation of Port Department = 1
Many employees can work in a Port Department.- Maximum Participation of Employee = N(*)
A Port department may have many employees assigned to it- Maximum participation of Port Department = N(*)
(Employee/Service charge) Cardinalities
Employees are necessarily assigned to Service charge.- Minimum Participation of Employee = 1
Service Charge has at least one employee assigned to it. -Minimum Participation of Vessel =1
Many employees can work in a Vessel.-Maximum Participation of Employee = N(*)
A Vessel may have many employees assigned to it.- Maximum participation of Vessel = N(*)
(Employee/Ticket) Cardinalities
Employees are necessarily for selling Ticket.- Minimum Participation of Employee = 1
Ticket dept. has at least one employee assigned to it. - Minimum Participation of Ticket =1
Many employees can work in a Ticket Dept.- Maximum Participation of Employee = N(*)
A ticket sells only one employee. - Maximum participation of Ticket = 1
(Vessel/Port) Cardinalities
Vessel are necessarily assigned to Port Dept.- Minimum participation of Vessel = 1
Every Port Department has at least one Vessel assigned to it.- Minimum participation of Port Department = 1
Many vessels can hold in one Port Department. -Maximum Participation of Vessel=N(*)
A Port Department may have many hold Vessel.- Maximum Participation of Port = 1
(Vessel/Service Charge) Cardinalities
Vessel gives service charge in time.- Minimum Participation of Vessel = 1
Every Service charge Dept. at least one employee assigned to it. -Minimum Participation of Service Charge =1
Many vessels give Service Charge.- Maximum Participation of Vessel = N(*)
Service Charge needs Many vessel to get charge.- Maximum Participation of Service charge = N(*)
(Passenger /Vessel) Cardinalities
Passengers are necessary assigned to Vessel. - Minimum Participation of Passenger = 1
Every Vessel has at least one passenger assigned to it.- Minimum Participation of Vessel = 1
Many Passengers may Board in a Vessel. - Maximum Participation of Passenger = N(*)
A Vessel may have many Passenger Board in it.
Maximum participation of Vessel = N(*)
(Passenger /Ticket) Cardinalities
Passengers are necessarily for selling Ticket. - Minimum Participation of Passenger = 1
Ticket may have to a Passenger or not.- Minimum Participation of Ticket = 1
Passenger has at least one ticket.- Maximum Participation of Passenger = 1
Ticket may have to a passenger.- Maximum Participation of Ticket = 1
Explain Entities and Attributes and Primary key
Visual representation is most effective benefits of ER diagram design. ER diagram gives clear visual picture of a Database design. It contains interrelated Data of a system so it shows better Visual representation.
Effective Communication: ER diagram is simply clear and specific so Database structure is appropriate for implantation system. Where as ER uses normally three kinds of symbols for representing information. Diamond Represents Relationships, Oval Represent Attribute, Rectangle represents the Entities. So ER diagram is Effective Communication.
Simple to Understand: ER diagram Interrelated data is connected with specific path. So Database engineer and administration employee understand easily this Diagram.
High Flexibility: The ERD model is quite flexible to use its relationships can be derived easily from the already existing ones. This can be done using other relational tables and mathematical formula.
Flowcharts were introduced by Frank Gilberth in 1921, and they were called “Process Flow Charts” at the beginning . Allan H. Mogensen is credited with training business people on the use of Flowcharts.
Flowchart is a flow of diagram of an process. It is a sequence process of a complex system. It uses different kinds of symbol that symbols are interconnected each other. There are different kinds of symbols are used to represent flowchart. Some Mentioned symbols are Single document, Start Terminator, Document, Manual Operation, Process, Decision, End Terminator etc. In Flowchart each step is process which are represented different symbols. Document represents the report of a system. Rectangle represents a normal process.
Terminator: An oval flow chart shape indicating the start or end of the process.
Process: A rectangular flow chart shape indicating a normal process flow step.
Decision: A diamond flow chart shape indication a branch in the process flow.
Connector: A small, labeled, circular flow chart shape used to indicate a jump in the process flow. (Shown as the circle with the letter “A”, below.)
Data: A parallelogram that indicates data input or output (I/O) for a process.
Document: Used to indicate a document or report (see image in sample flow chart below).
Visual Clarity: One of the most benefits of flowchart is clear visualize multiple process and sequence into a single Document
Instant Communication: Flowchart is simply clarifying progress that helps team members instantly understand what they should do step by step
Problem Solving: Flowchart is a process that is used to understand clearly because it uses different familiar symbols that is easy meaning to us so that we can understand Flowchart process so we solve problem easily . It also low cost and reduce time to implement a complex system.
Proper Documentation: Flowchart creates a efficient model that is specific process system. So System analyst keeps the flowchart as a proper Documentation.
Effective Coordination: Flowchart is sequence task so that it reduces extra members because it work sequence and accurately. So it creates coordinate of each process steps.
DFD Level 0 is also called a Context Diagram. It’s a basic overview of the whole system or process being analyzed or modeled. It’s designed to be an at-a-glance view, showing the system as a single high-level process, with its relationship to external entities. It should be easily understood by a wide audience, including stakeholders, business analysts, data analysts and developers.
The context diagram shows one process (representing the entire system) and the sources/sinks that represent the boundaries of the system
It shows us simple overview of whole system. Look at the slide here you will see three symbol one is soruce middle symbol is process and last symbol is sinks which uses to control whole system. Whole system we will see data flow form one place to anther place. Data come and go parallel system.
A data flow diagram (DFD) is a graphical representation of the "flow" of data through an information system. It creates a overview of a system. It is used for Visualization of Data. A DFD shows what kind of information will be input and output. DFD divide into few levels to keep their size and complexity manageable. There are Some varieties Data flow Diagram such as Context level , o level , 1 level , 2 level and 3,4 level.
There are different kinds of symbol are used for representing Data Flow diagram. Process, Data store , Flow line etc.
Process system is oval size which is used to process data and it sends data to other process circle through flow line and it also used Data store symbol which is rectangle size.
DFD 1 level shows us more details than 0 level . It do highlight the main function. It also represents sub process. It also add external agent or process. It creates functionality of whole system.
This level is more deeper than 1 level. It contains more text and represents whole system. It also represents the whole overview of a system. In this level more than 6 process contains. It describes details about the whole functions.