1. POPULATION
Demography: The study of population.
Fertility rate: The average number of children per family
Changes in population Population can increase or decrease.
- Natural changes: Are caused by the number of births and deaths.
- Migration: Movement of people from one area to another.
- Immigrant: People that live and work in one country but are from another.
- Emigrant: People that leave their country to live in a different one.
Graphs and charts.
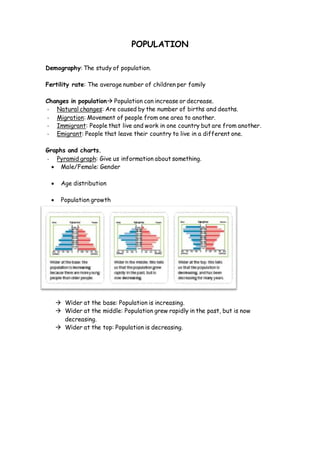
- Pyramid graph: Give us information about something.
Male/Female: Gender
Age distribution
Population growth
Wider at the base: Population is increasing.
Wider at the middle: Population grew rapidly in the past, but is now
decreasing.
Wider at the top: Population is decreasing.
2. - Pie chart: To show percentages.
- Line graphs: Changes in population.
We can divide the population of a country into groups according to various
factors, such as gender or age.
Ethnic group: People that have common language and culture.
Population density: The average number of people living in each km2
Spain:
- Has a low population density.
- Has a low fertility rate.
- Cities and coastal areas: Have a lot of people living.
- Rural areas: Have fewer people.
- Population growth in 2000-2011 because of immigration.
- Population began to decrease in 2012 as immigrants returned home because of
the high unemployment.
Europe.
- The population is 730 million people in Europe and 507 million people in the
European Union (EU).
- There are differences between the population density of EU countries.
3. - There are more female than male 52% and 48%
- Fertility rate is 1,6 children
- The average age of the people is increasing.
- Germany is the European country with highest number of people