Download to read offline


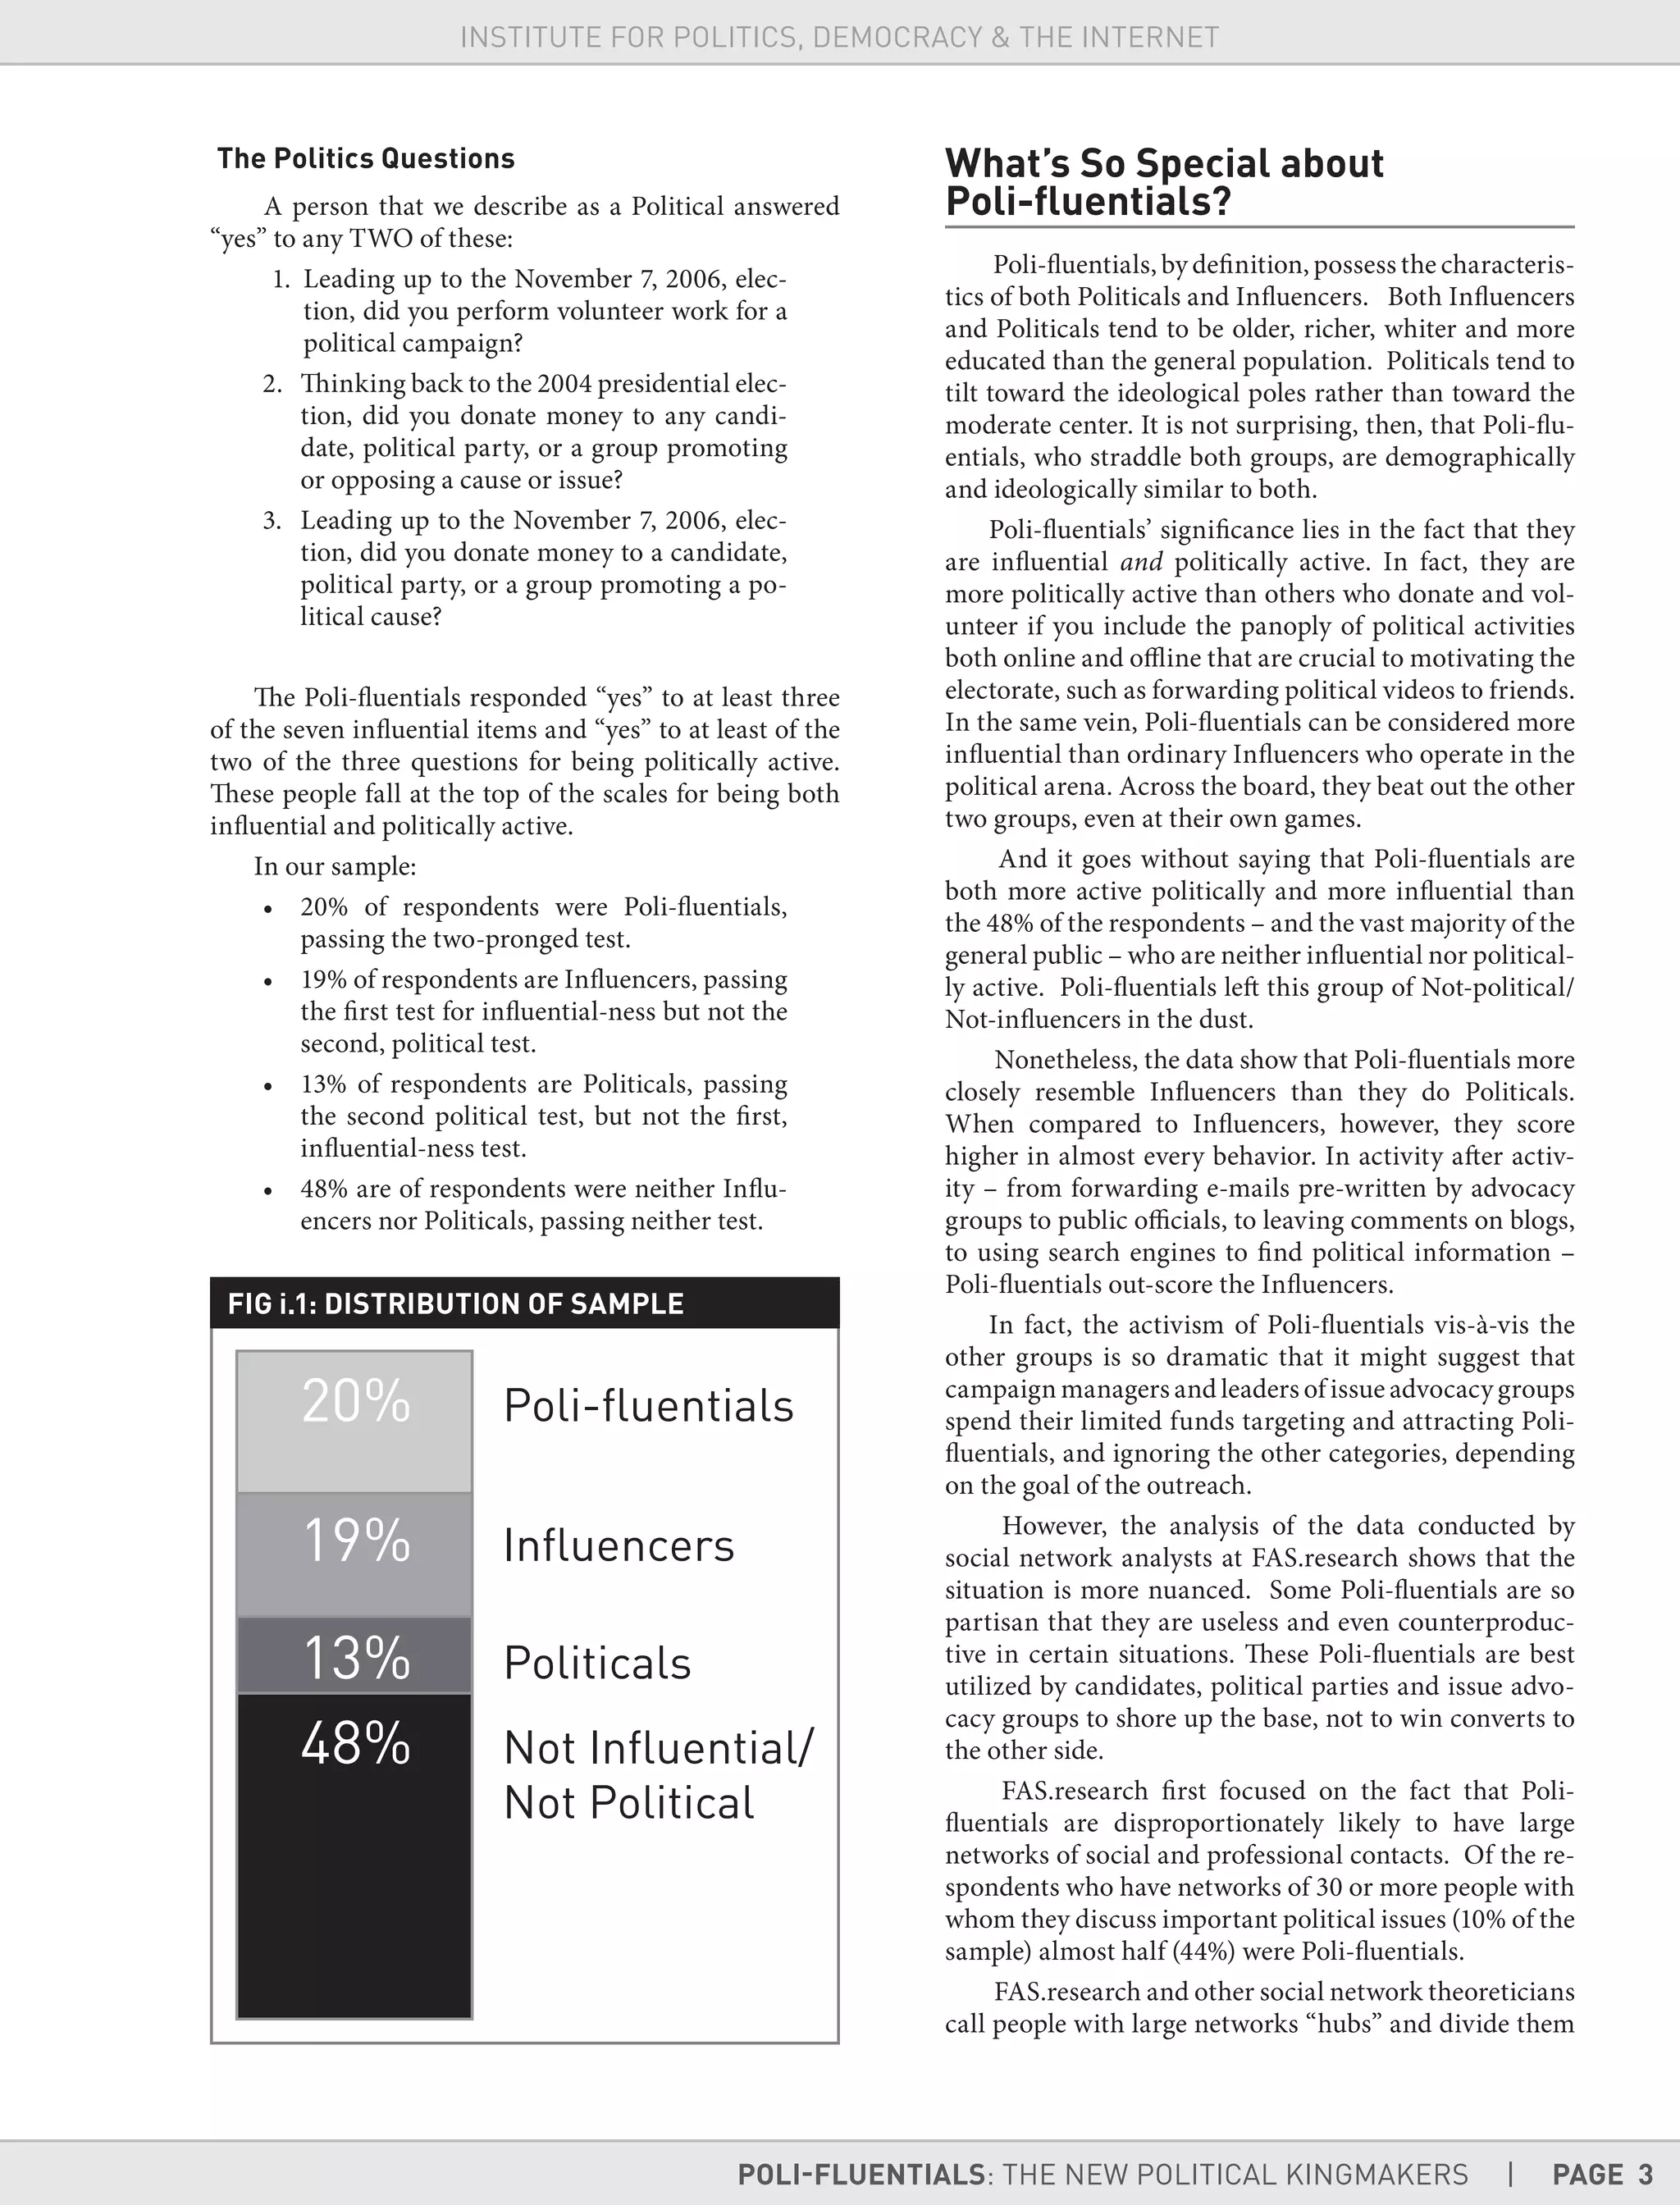

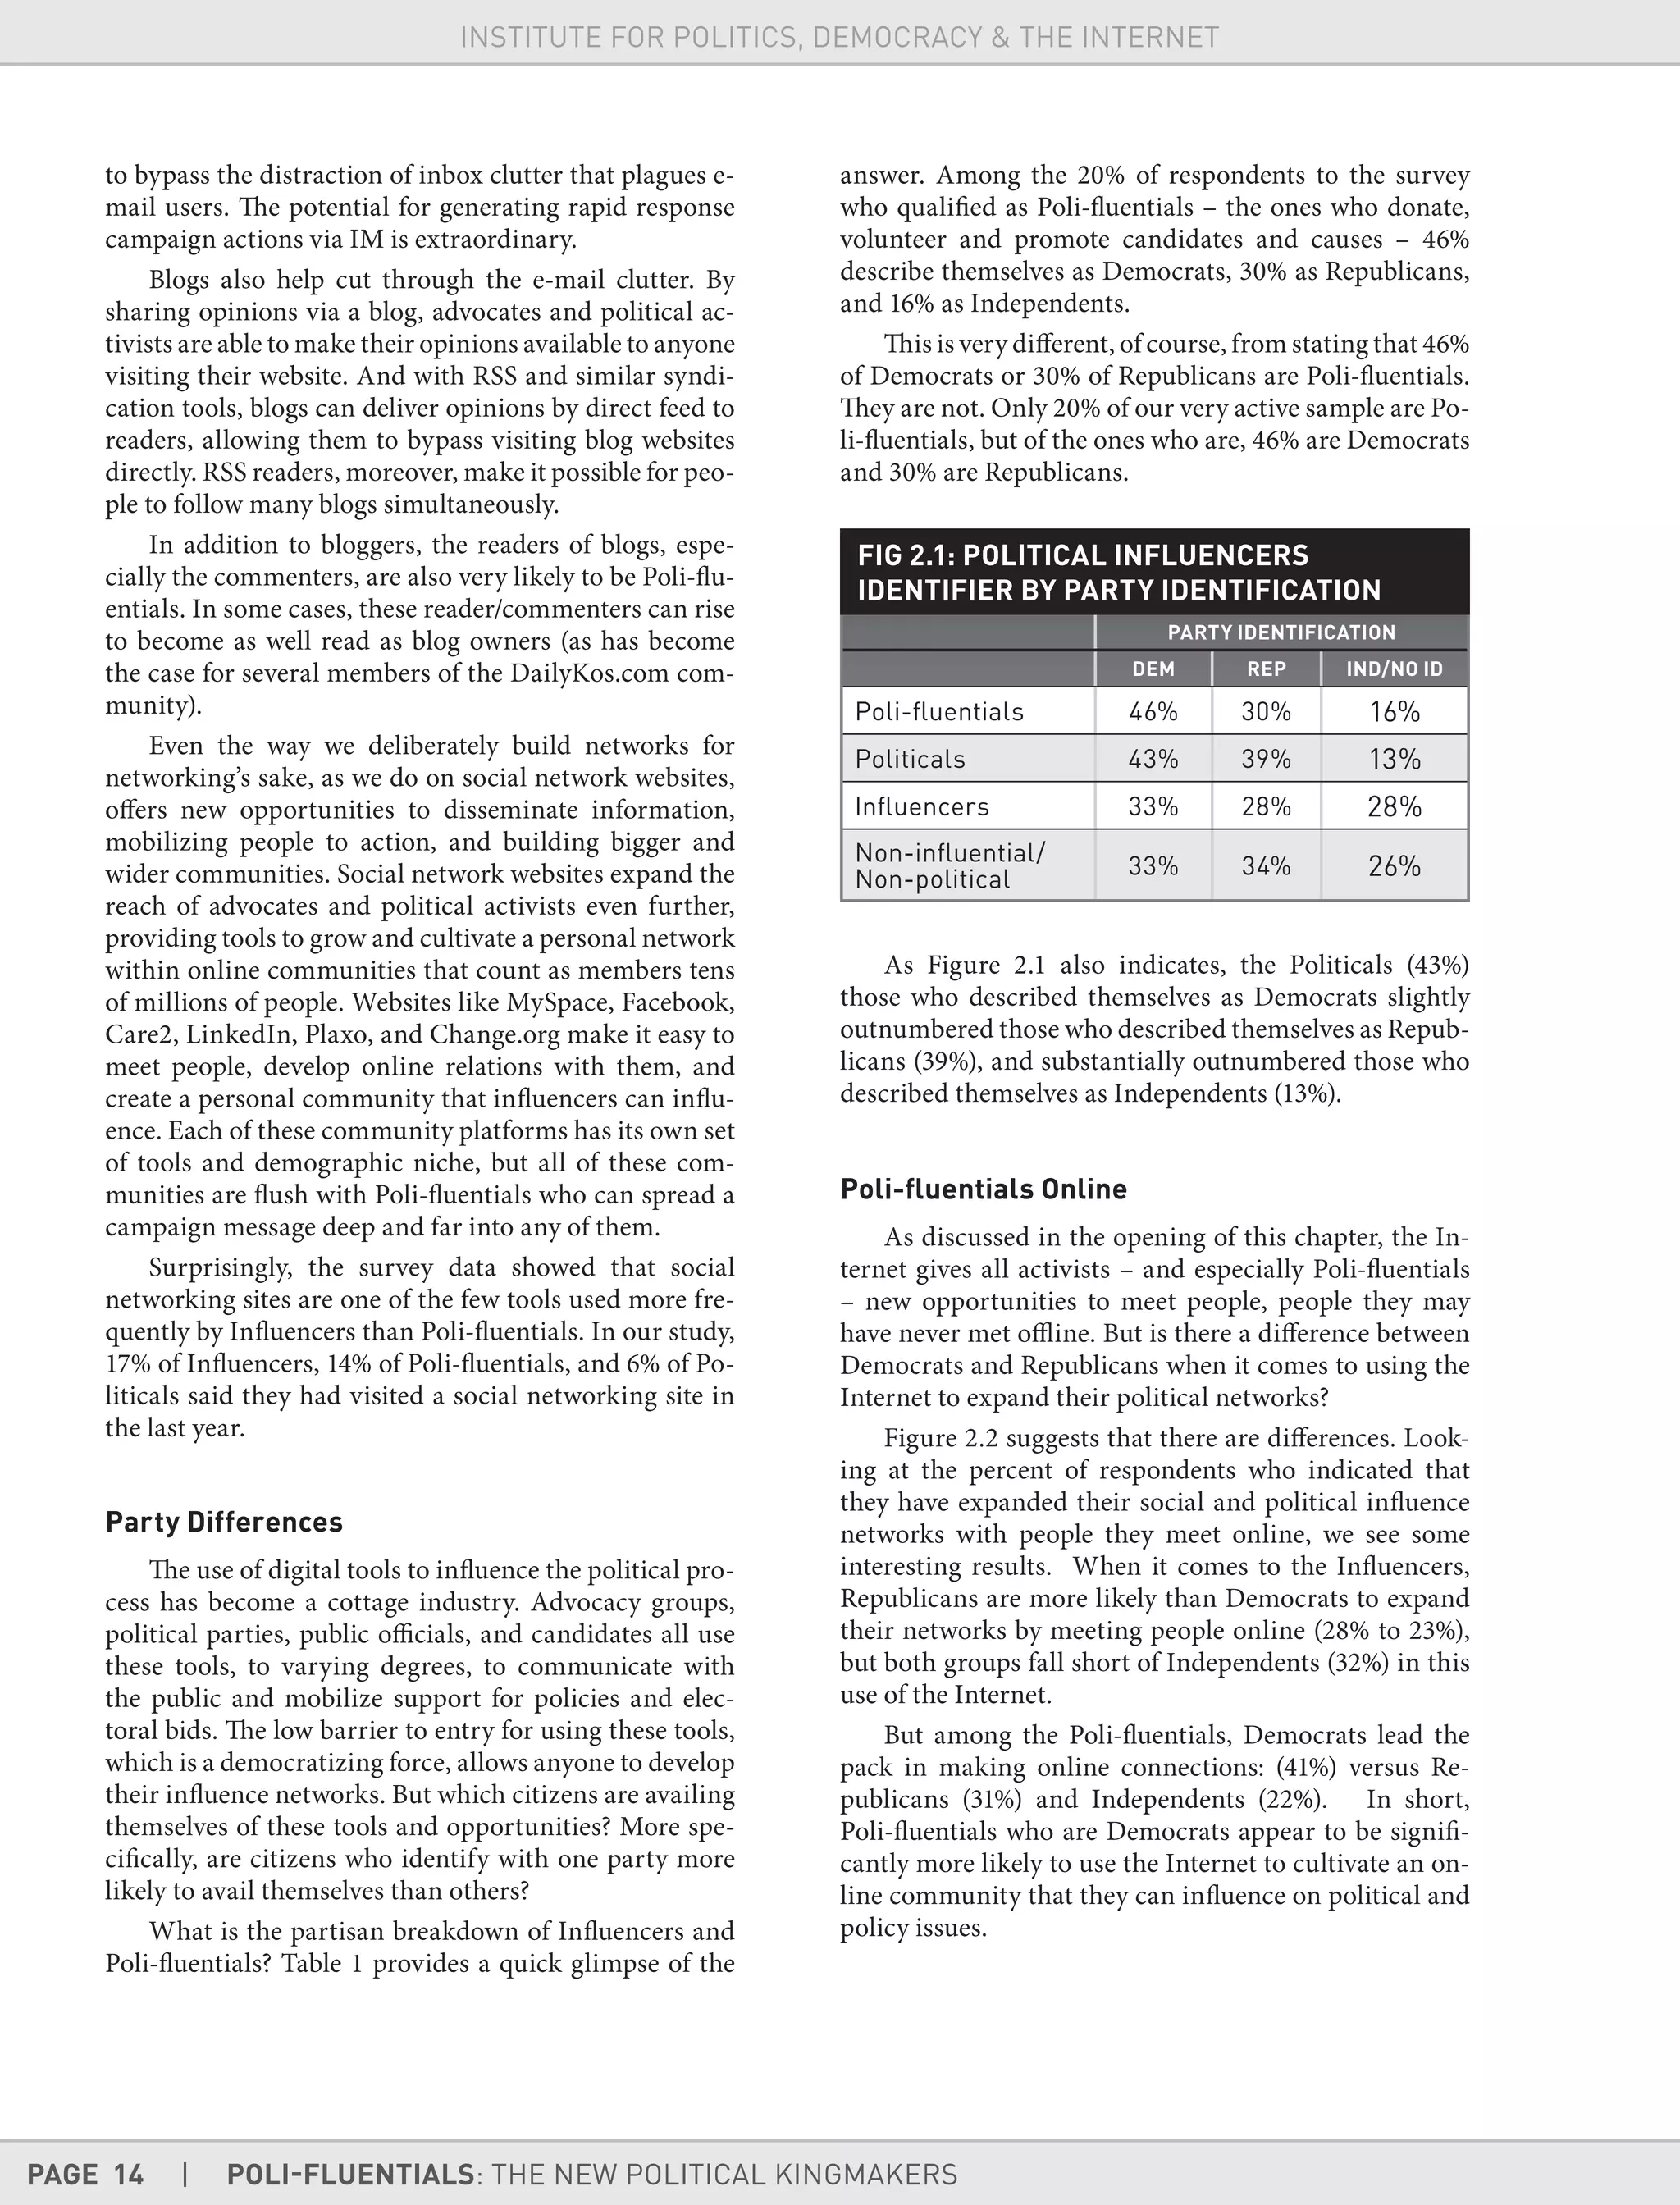
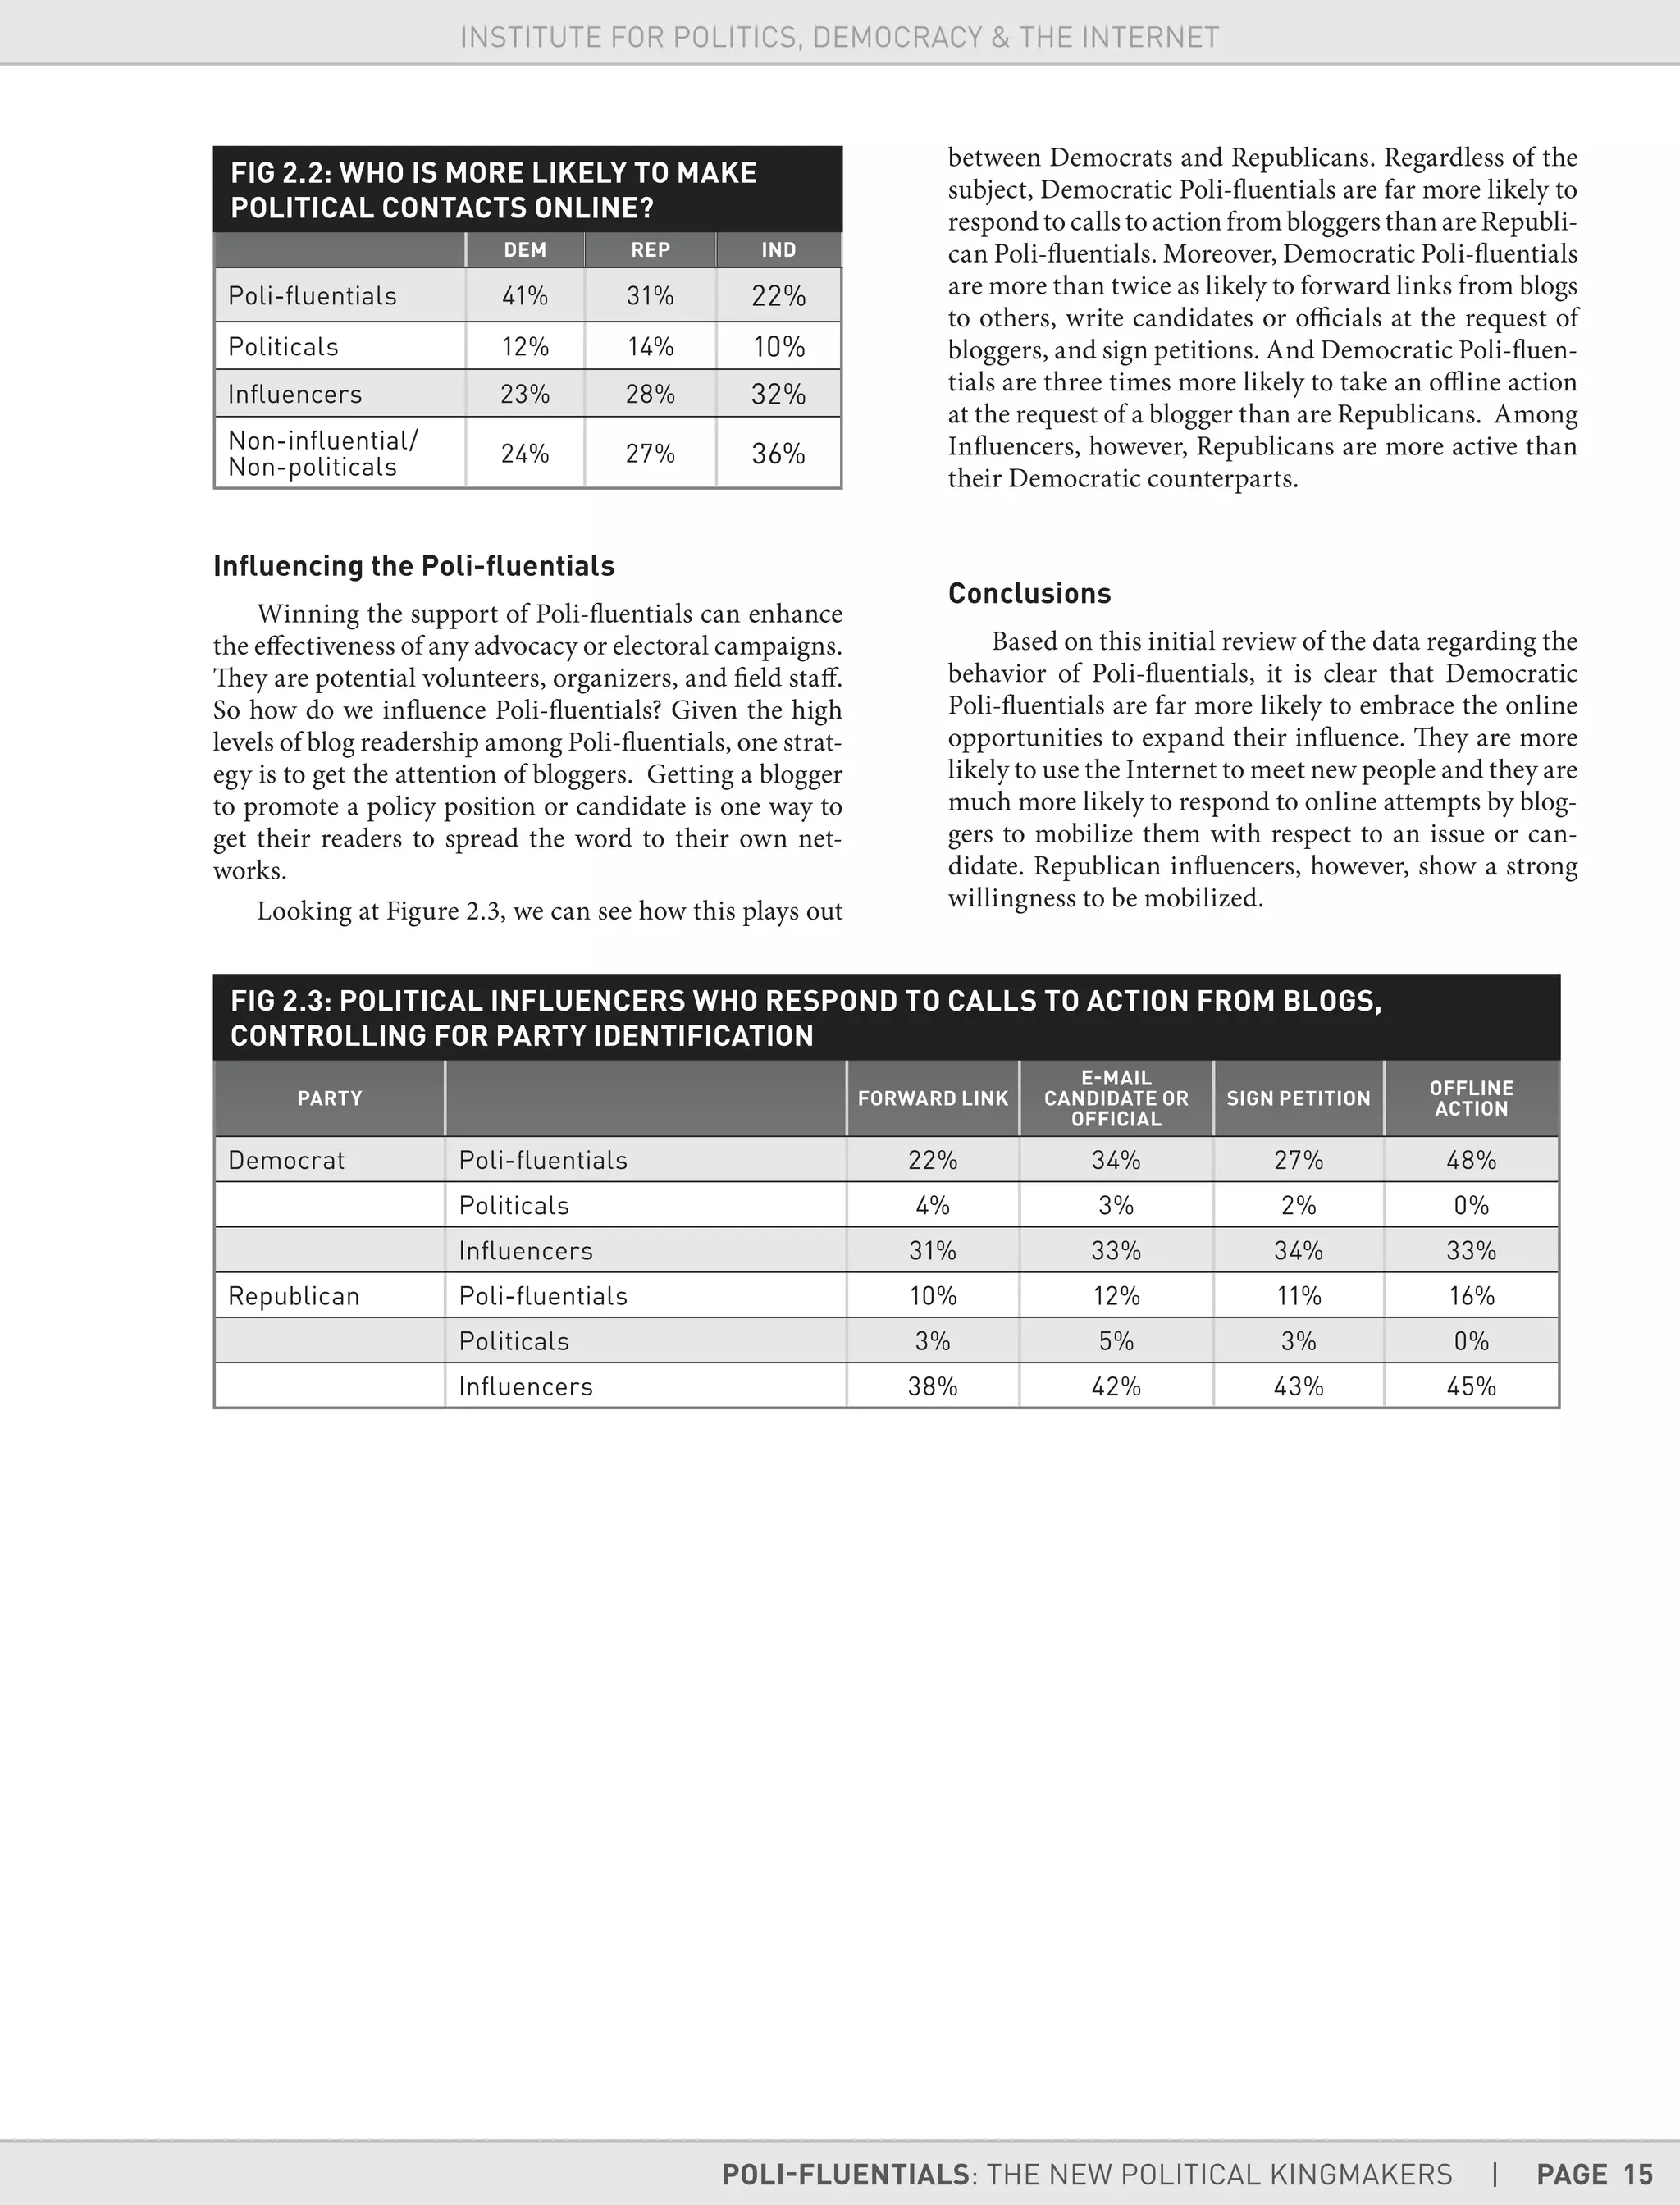


This document summarizes a study on "Poli-fluentials", defined as American adults who will be the most politically active in the 2008 election through volunteering, donating, promoting candidates, and online/word-of-mouth advocacy. The study identifies Poli-fluentials based on their willingness to publicly advocate positions and involvement in political donations/volunteering. It finds Poli-fluentials are more likely than other groups to volunteer, consume news voraciously including alternative sources, have large social/professional networks, and be Democrats and liberals. The study aims to help political groups understand and communicate with these influential activists.


