This user guide provides information about the PowerLogic Series 800 Power Meter. It describes the hardware, features, setup, metering capabilities, inputs/outputs, alarms, logging, waveform capture, and disturbance monitoring functions of the PowerLogic power meters. The guide contains safety and operational instructions as well as technical specifications for using the meters.


![© 2011 Schneider Electric. All Rights Reserved.
PowerLogicTM
Series 800 Power Meter 63230-500-225A2
Contents 3/2011
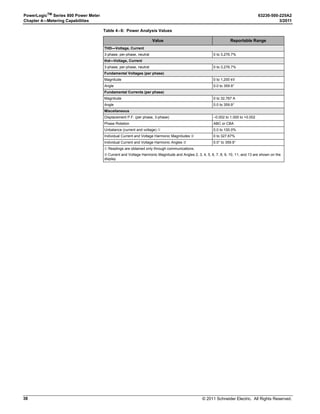
vi
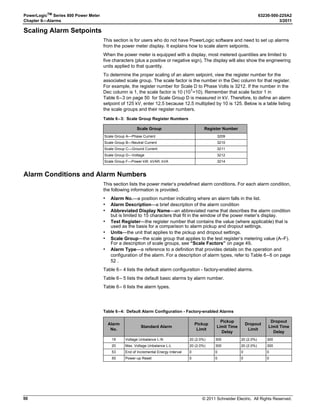
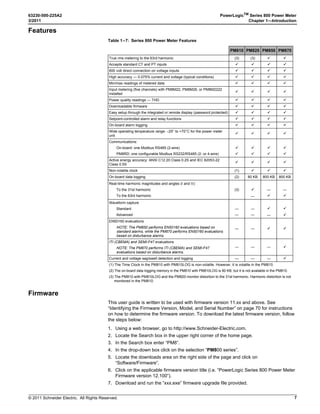
Chapter 8—Waveform Capture - - - - - - - - - - - - - - - - - - - - - - - - - - - - - - - - - - - - - - -63
Introduction - - - - - - - - - - - - - - - - - - - - - - - - - - - - - - - - - - - - - - - - - - - - - - - - - - - -63
Waveform Capture - - - - - - - - - - - - - - - - - - - - - - - - - - - - - - - - - - - - - - - - - - - - - - -63
Waveform Storage - - - - - - - - - - - - - - - - - - - - - - - - - - - - - - - - - - - - - - - - - - - - - - -64
How the Power Meter Captures an Event - - - - - - - - - - - - - - - - - - - - - - - - - - - - - - -64
Channel Selection in PowerLogic Software - - - - - - - - - - - - - - - - - - - - - - - - - - - - - -64
Chapter 9—Disturbance Monitoring (PM870) - - - - - - - - - - - - - - - - - - - - - - - - - - - - -65
About Disturbance Monitoring - - - - - - - - - - - - - - - - - - - - - - - - - - - - - - - - - - - - - - -65
Capabilities of the PM870 During an Event - - - - - - - - - - - - - - - - - - - - - - - - - - - - - -67
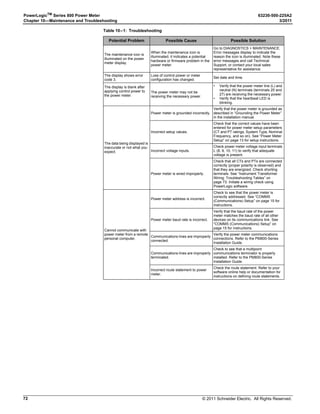
Chapter 10—Maintenance and Troubleshooting - - - - - - - - - - - - - - - - - - - - - - - - - -69
Introduction - - - - - - - - - - - - - - - - - - - - - - - - - - - - - - - - - - - - - - - - - - - - - - - - - - - -69
Power Meter Memory - - - - - - - - - - - - - - - - - - - - - - - - - - - - - - - - - - - - - - - - - - - - -69
Identifying the Firmware Version, Model, and Serial Number - - - - - - - - - - - - - - - - -70
Viewing the Display in Different Languages - - - - - - - - - - - - - - - - - - - - - - - - - - - - -70
Technical Support - - - - - - - - - - - - - - - - - - - - - - - - - - - - - - - - - - - - - - - - - - - - - - -70
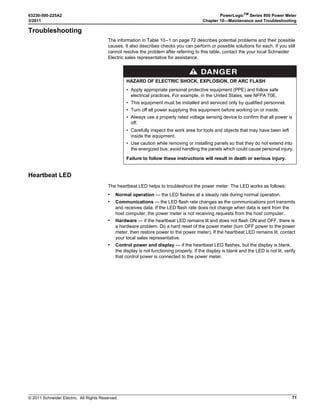
Troubleshooting - - - - - - - - - - - - - - - - - - - - - - - - - - - - - - - - - - - - - - - - - - - - - - - - -71
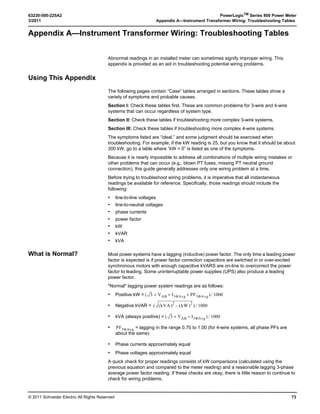
Appendix A—Instrument Transformer Wiring: Troubleshooting Tables - - - - - - - - 73
Using This Appendix - - - - - - - - - - - - - - - - - - - - - - - - - - - - - - - - - - - - - - - - - - - - -73
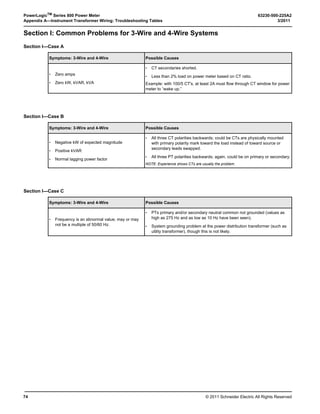
Section I: Common Problems for 3-Wire and 4-Wire Systems - - - - - - - - - - - - - - - -74
Section II: 3-Wire System Troubleshooting - - - - - - - - - - - - - - - - - - - - - - - - - - - - - -75
Section III: 4-Wire System Troubleshooting - - - - - - - - - - - - - - - - - - - - - - - - - - - - -76
Field Example - - - - - - - - - - - - - - - - - - - - - - - - - - - - - - - - - - - - - - - - - - - - - - - - - -78
Appendix B—Register List - - - - - - - - - - - - - - - - - - - - - - - - - - - - - - - - - - - - - - - - - - 79
Register List Access - - - - - - - - - - - - - - - - - - - - - - - - - - - - - - - - - - - - - - - - - - - - - -79
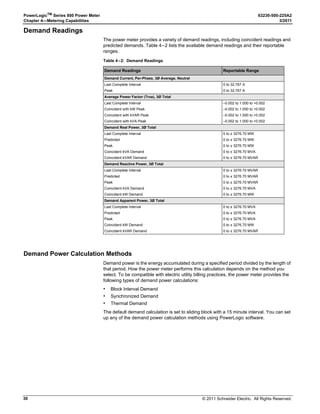
About Registers - - - - - - - - - - - - - - - - - - - - - - - - - - - - - - - - - - - - - - - - - - - - - - - - -79
How Date and Time are Stored in Registers - - - - - - - - - - - - - - - - - - - - - - - - - - - - -80
How Signed Power Factor is Stored in the Register - - - - - - - - - - - - - - - - - - - - - - - -80
Supported Modbus Commands - - - - - - - - - - - - - - - - - - - - - - - - - - - - - - - - - - - - - -81
Resetting Registers - - - - - - - - - - - - - - - - - - - - - - - - - - - - - - - - - - - - - - - - - - - - - -81
Appendix C—Using the Command Interface- - - - - - - - - - - - - - - - - - - - - - - - - - - - - 83
Overview of the Command Interface - - - - - - - - - - - - - - - - - - - - - - - - - - - - - - - - - -83
Operating Outputs from the Command Interface - - - - - - - - - - - - - - - - - - - - - - - - - -86
Using the Command Interface to Change Configuration Registers - - - - - - - - - - - - -86
Conditional Energy - - - - - - - - - - - - - - - - - - - - - - - - - - - - - - - - - - - - - - - - - - - - - - -87
Incremental Energy - - - - - - - - - - - - - - - - - - - - - - - - - - - - - - - - - - - - - - - - - - - - - -88
Setting Up Individual Harmonic Calculations - - - - - - - - - - - - - - - - - - - - - - - - - - - - -89
Changing Scale Factors - - - - - - - - - - - - - - - - - - - - - - - - - - - - - - - - - - - - - - - - - - -90
Enabling Floating-point Registers - - - - - - - - - - - - - - - - - - - - - - - - - - - - - - - - - - - -91
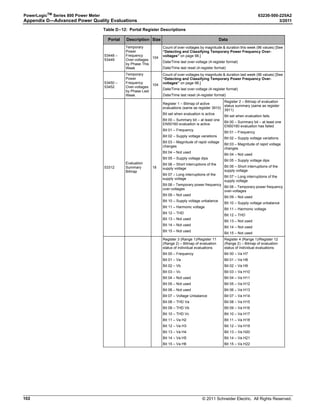
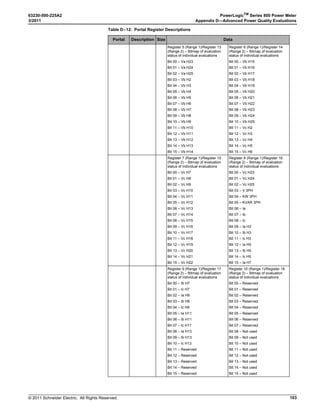
Appendix D—Advanced Power Quality Evaluations - - - - - - - - - - - - - - - - - - - - - - - 93
Power Quality Standards - - - - - - - - - - - - - - - - - - - - - - - - - - - - - - - - - - - - - - - - - -93
SEMI-F47/ITI (CBEMA) Specification - - - - - - - - - - - - - - - - - - - - - - - - - - - - - - - - - -93
EN50160:2000 Specification - - - - - - - - - - - - - - - - - - - - - - - - - - - - - - - - - - - - - - - -95
How Evaluation Results Are Reported - - - - - - - - - - - - - - - - - - - - - - - - - - - - - - - - -95
Possible Configurations Through Register Writes - - - - - - - - - - - - - - - - - - - - - - - - -96
Evaluation During Normal Operation - - - - - - - - - - - - - - - - - - - - - - - - - - - - - - - - - -96
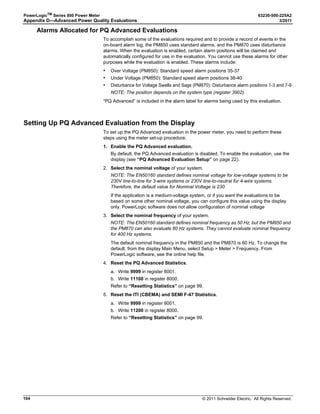
Evaluations During Abnormal Operation - - - - - - - - - - - - - - - - - - - - - - - - - - - - - - - -97
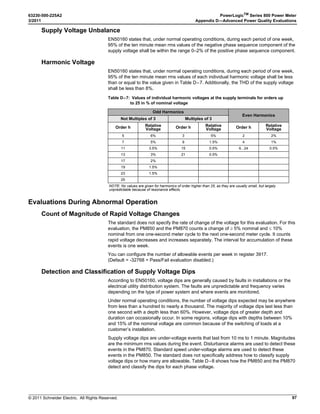
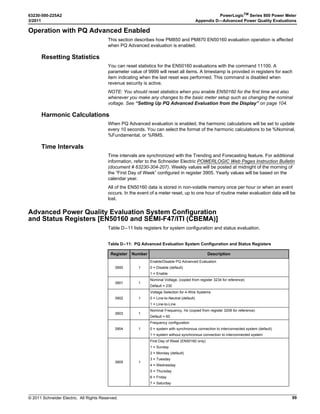
Operation with PQ Advanced Enabled - - - - - - - - - - - - - - - - - - - - - - - - - - - - - - - - -99
Advanced Power Quality Evaluation System Configuration
and Status Registers [EN50160 and SEMI-F47/ITI (CBEMA)] - - - - - - - - - - - - - - - -99
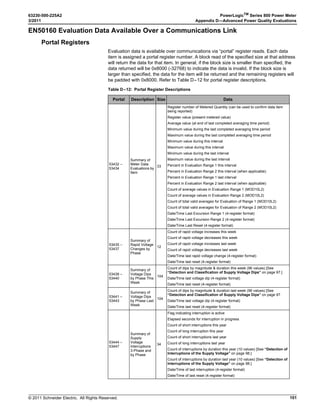
EN50160 Evaluation Data Available Over a Communications Link - - - - - - - - - - - - 101
Setting Up PQ Advanced Evaluation from the Display - - - - - - - - - - - - - - - - - - - - - 104
Glossary - - - - - - - - - - - - - - - - - - - - - - - - - - - - - - - - - - - - - - - - - - - - - - - - - - - - - - - 105
Terms - - - - - - - - - - - - - - - - - - - - - - - - - - - - - - - - - - - - - - - - - - - - - - - - - - - - - - - 105
Abbreviations and Symbols - - - - - - - - - - - - - - - - - - - - - - - - - - - - - - - - - - - - - - - - 107
Index - - - - - - - - - - - - - - - - - - - - - - - - - - - - - - - - - - - - - - - - - - - - - - - - - - - - - - - - - - 109](https://image.slidesharecdn.com/pm800userguide-150708030314-lva1-app6891/85/Pm800-userguide-6-320.jpg)


![© 2011 Schneider Electric. All Rights Reserved.
PowerLogicTM
Series 800 Power Meter 63230-500-225A2
Chapter 3—Operation 3/2011
12
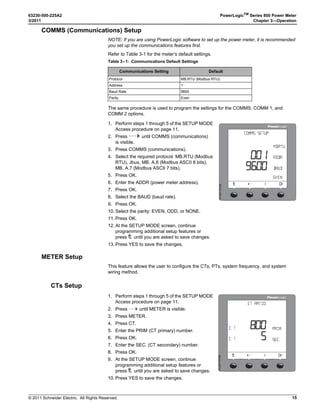
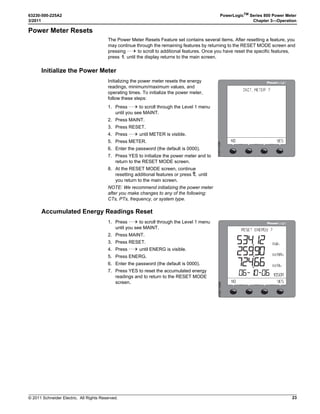
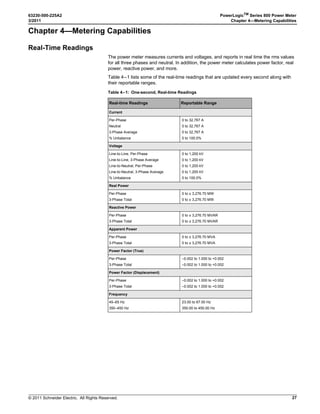
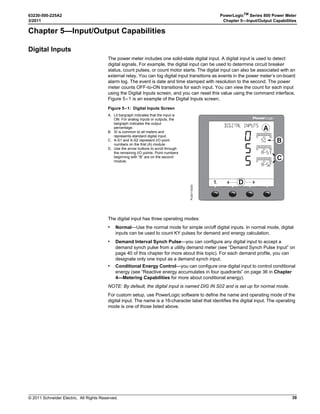
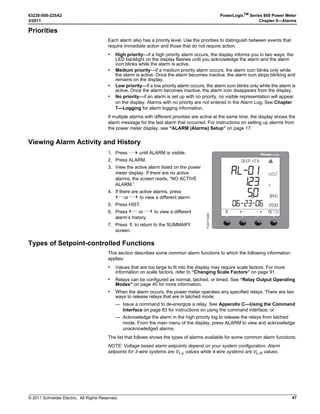
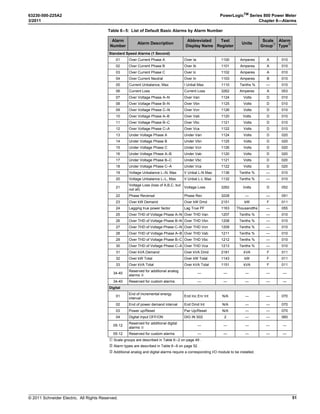
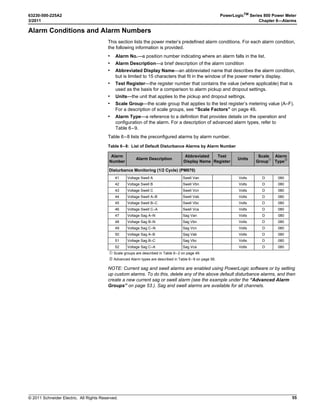
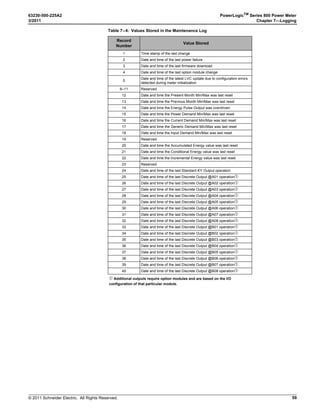
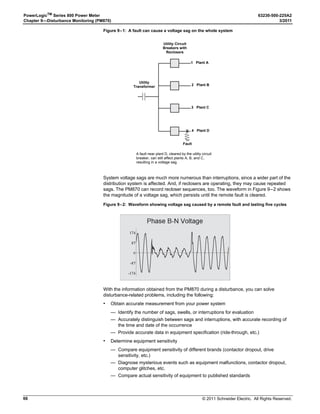
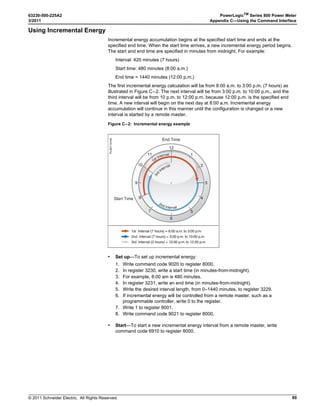
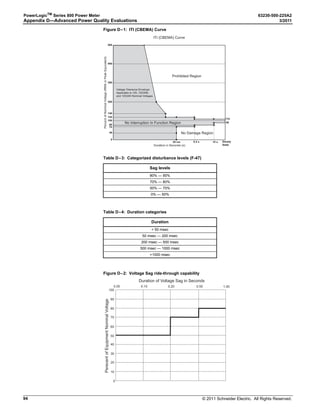
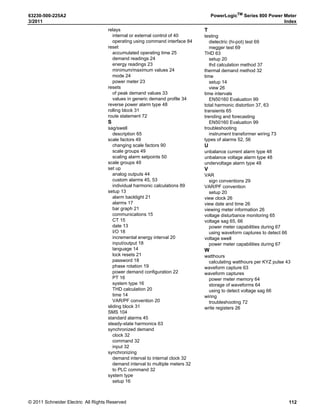
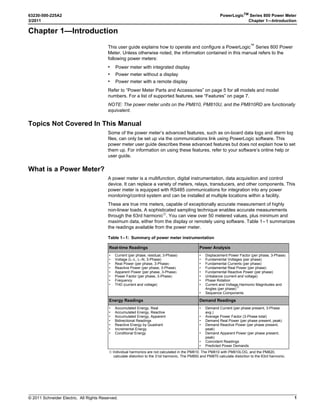
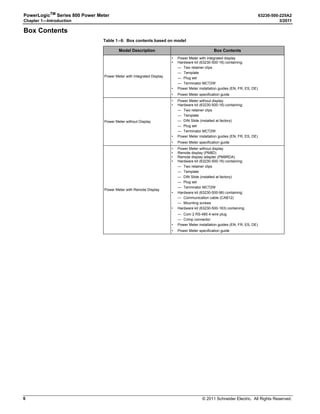
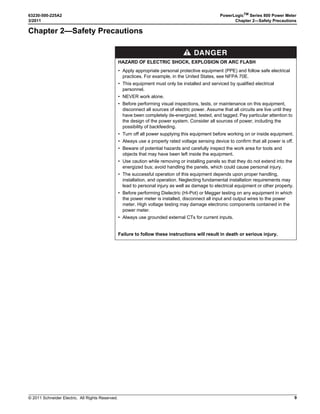
Figure 3–2: Abbreviated List of PM800 Menu Items in IEEE (IEC) Mode
➀ Available on the PM810 only when an optional Power Meter Logging Module (PM810LOG) is installed. Available on all other PM800 Series models.
➁ Available with some models.
➂ Both IEC and IEEE modes are available. Depending on the mode selected, menu labels will be different. See “Display Mode Change” on page 24 to select the
desired mode.
➃ The PM810 has a volatile clock. The PM810 with an optional Power Meter Logging Module (PM810LOG), and all other PM800 Series models, have a non-volatile
clock.
PHASE I - DMD UNBAL
PWR (PQS) PHASE P - DMD
TRUE DISPL
V L-L (U) V L-N (V) I
MINMX AMPS (I) VOLTS (U-V) UNBAL PWR (PQS) PF HZ (F) THD V THD I
ACTIV HIST
DATE TIME LANG COMMS (COM) METER ALARM I/O PASSW TIMER ADVAN
AMPS (I)
VOLTS (U-V)
PWR (PQS)
ENERG (E)
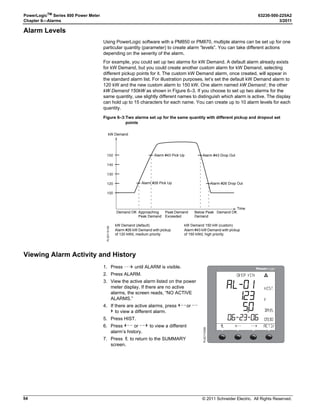
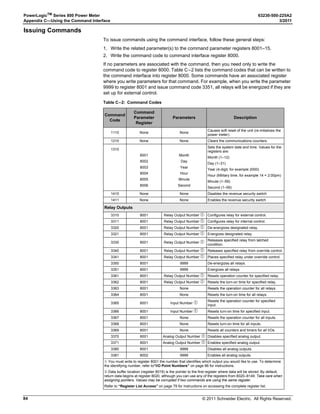
PF
HZ (F)
THD
MINMX
ALARM
I/O
RESET
SETUP
DIAG
HARM
METER ENERG (E) DMD MINMX MODE TIMER
CONTR
MAINT
TIMER
PM8M2222
COMM1
COMM2
PM8RD
D OUT D IN A OUT A IN
METER REG CLOCK
1
3
2
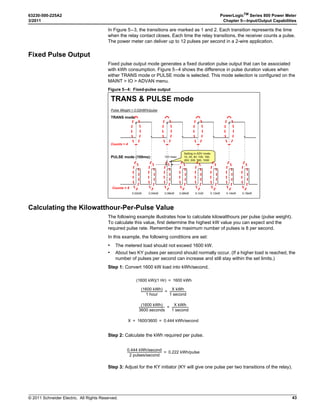
D OUT [Digital KY Out]
D IN [Digital In]
A OUT [Analog Out]
A IN [Analog In]
PM8M2222
PM8M2222, PM8M26, and PM8M22
4 4
4
1
V L-L (U) V L-N (V) I
V L-L (U) V L-N (V)
Wh VAh VARh INC
LEVEL 1 LEVEL 2](https://image.slidesharecdn.com/pm800userguide-150708030314-lva1-app6891/85/Pm800-userguide-19-320.jpg)