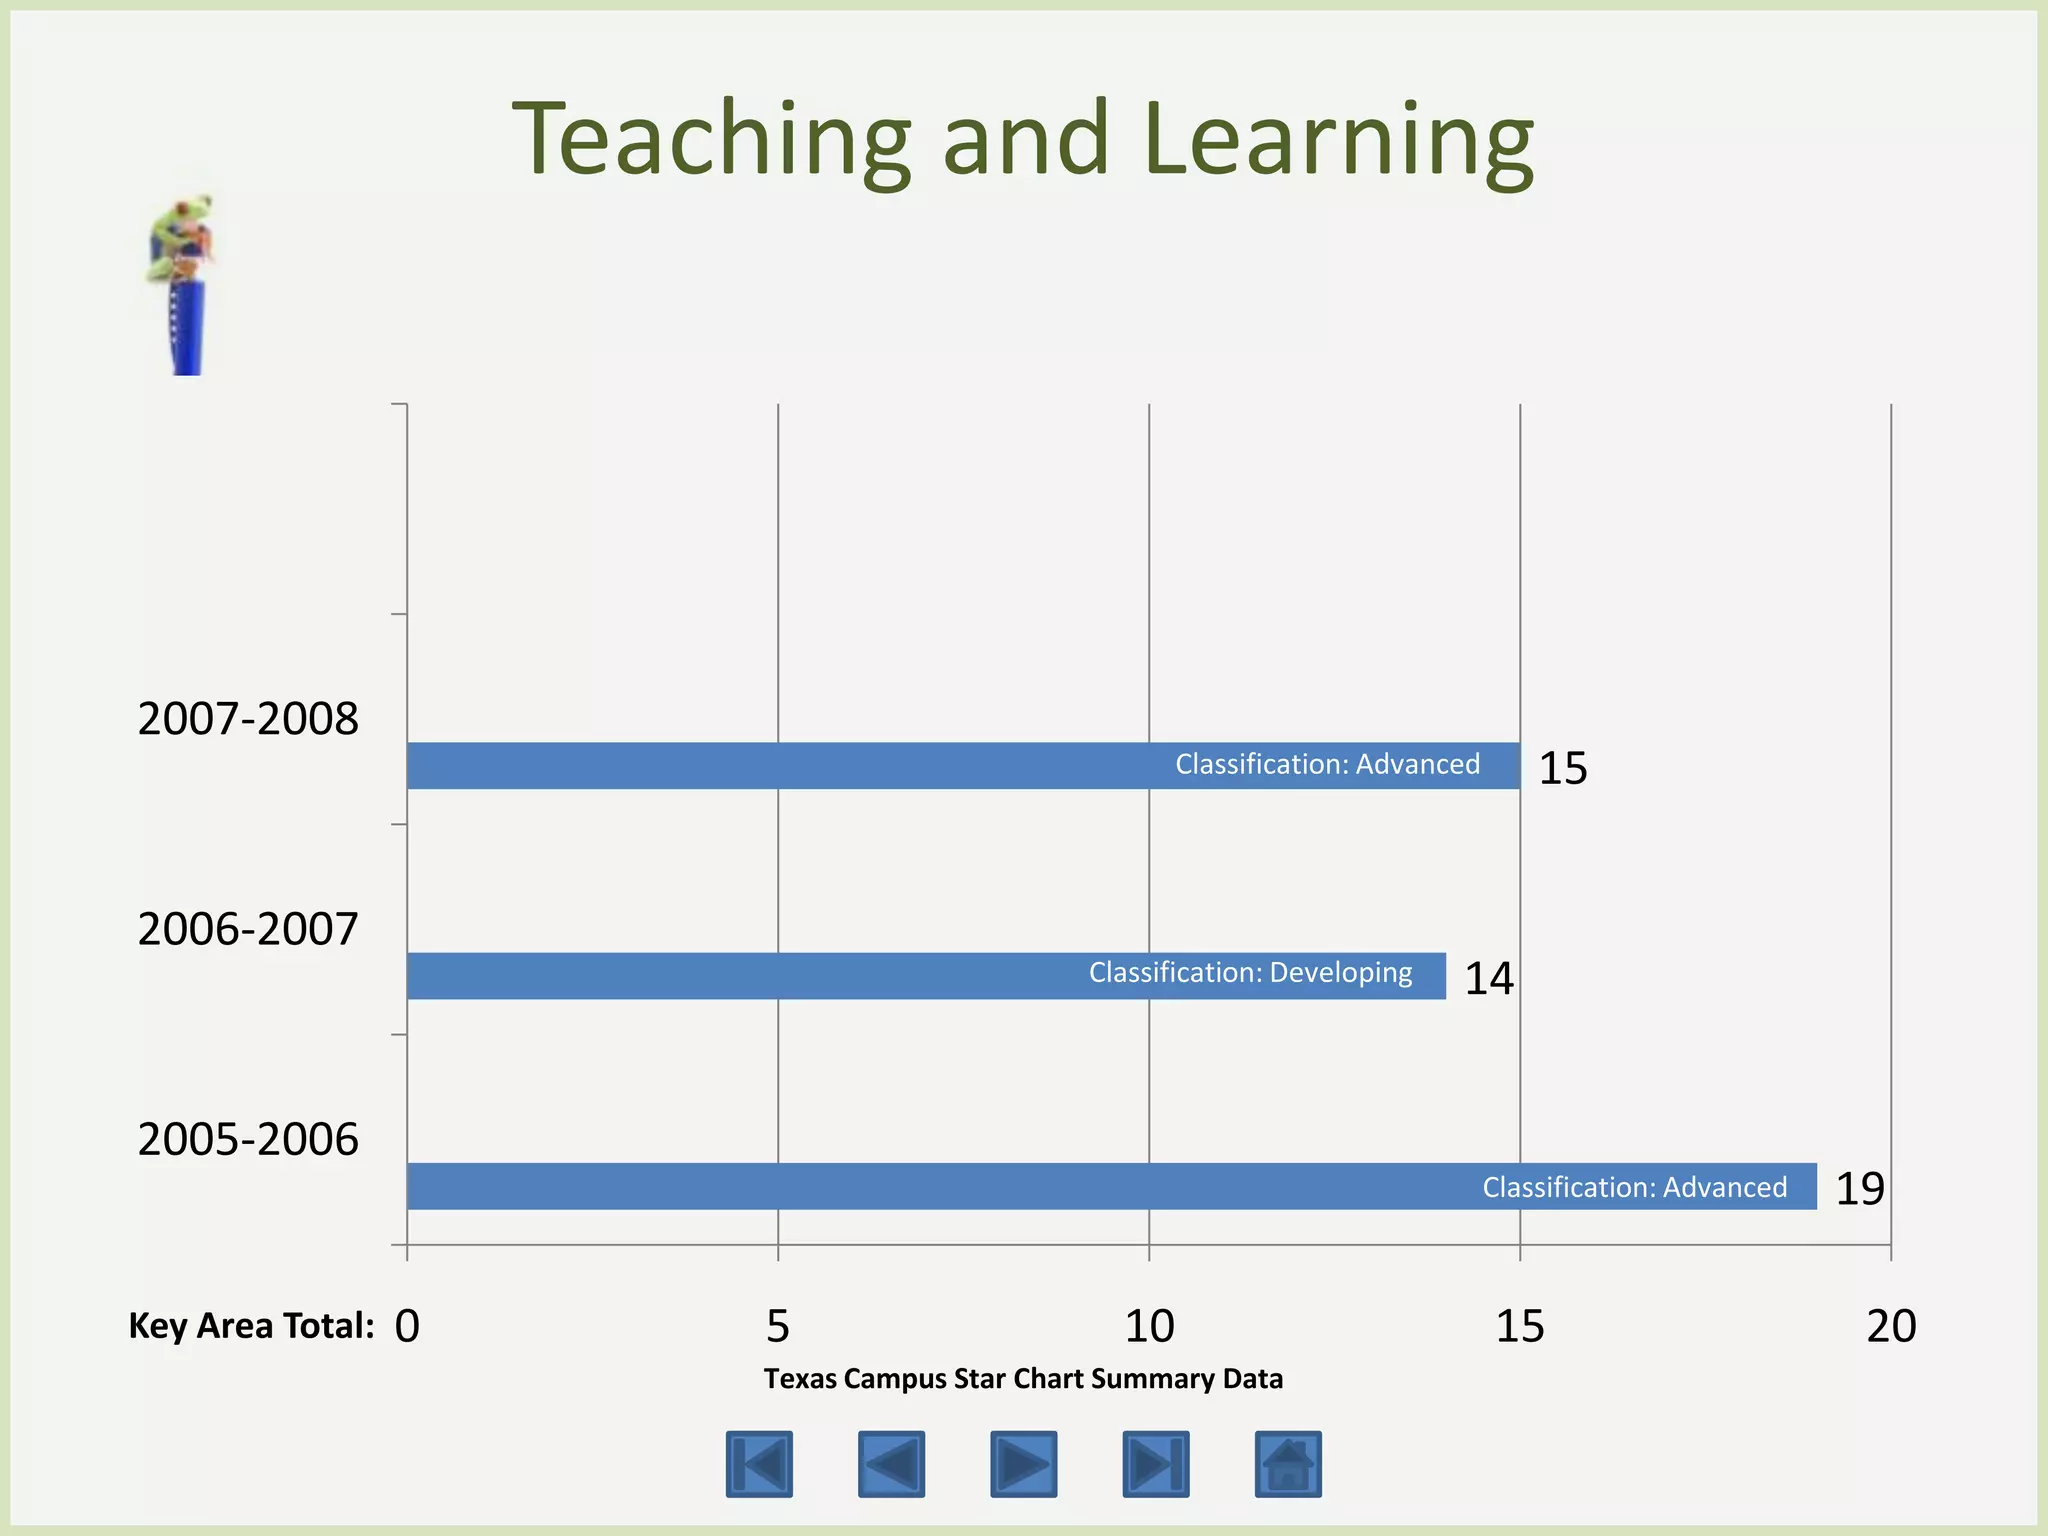
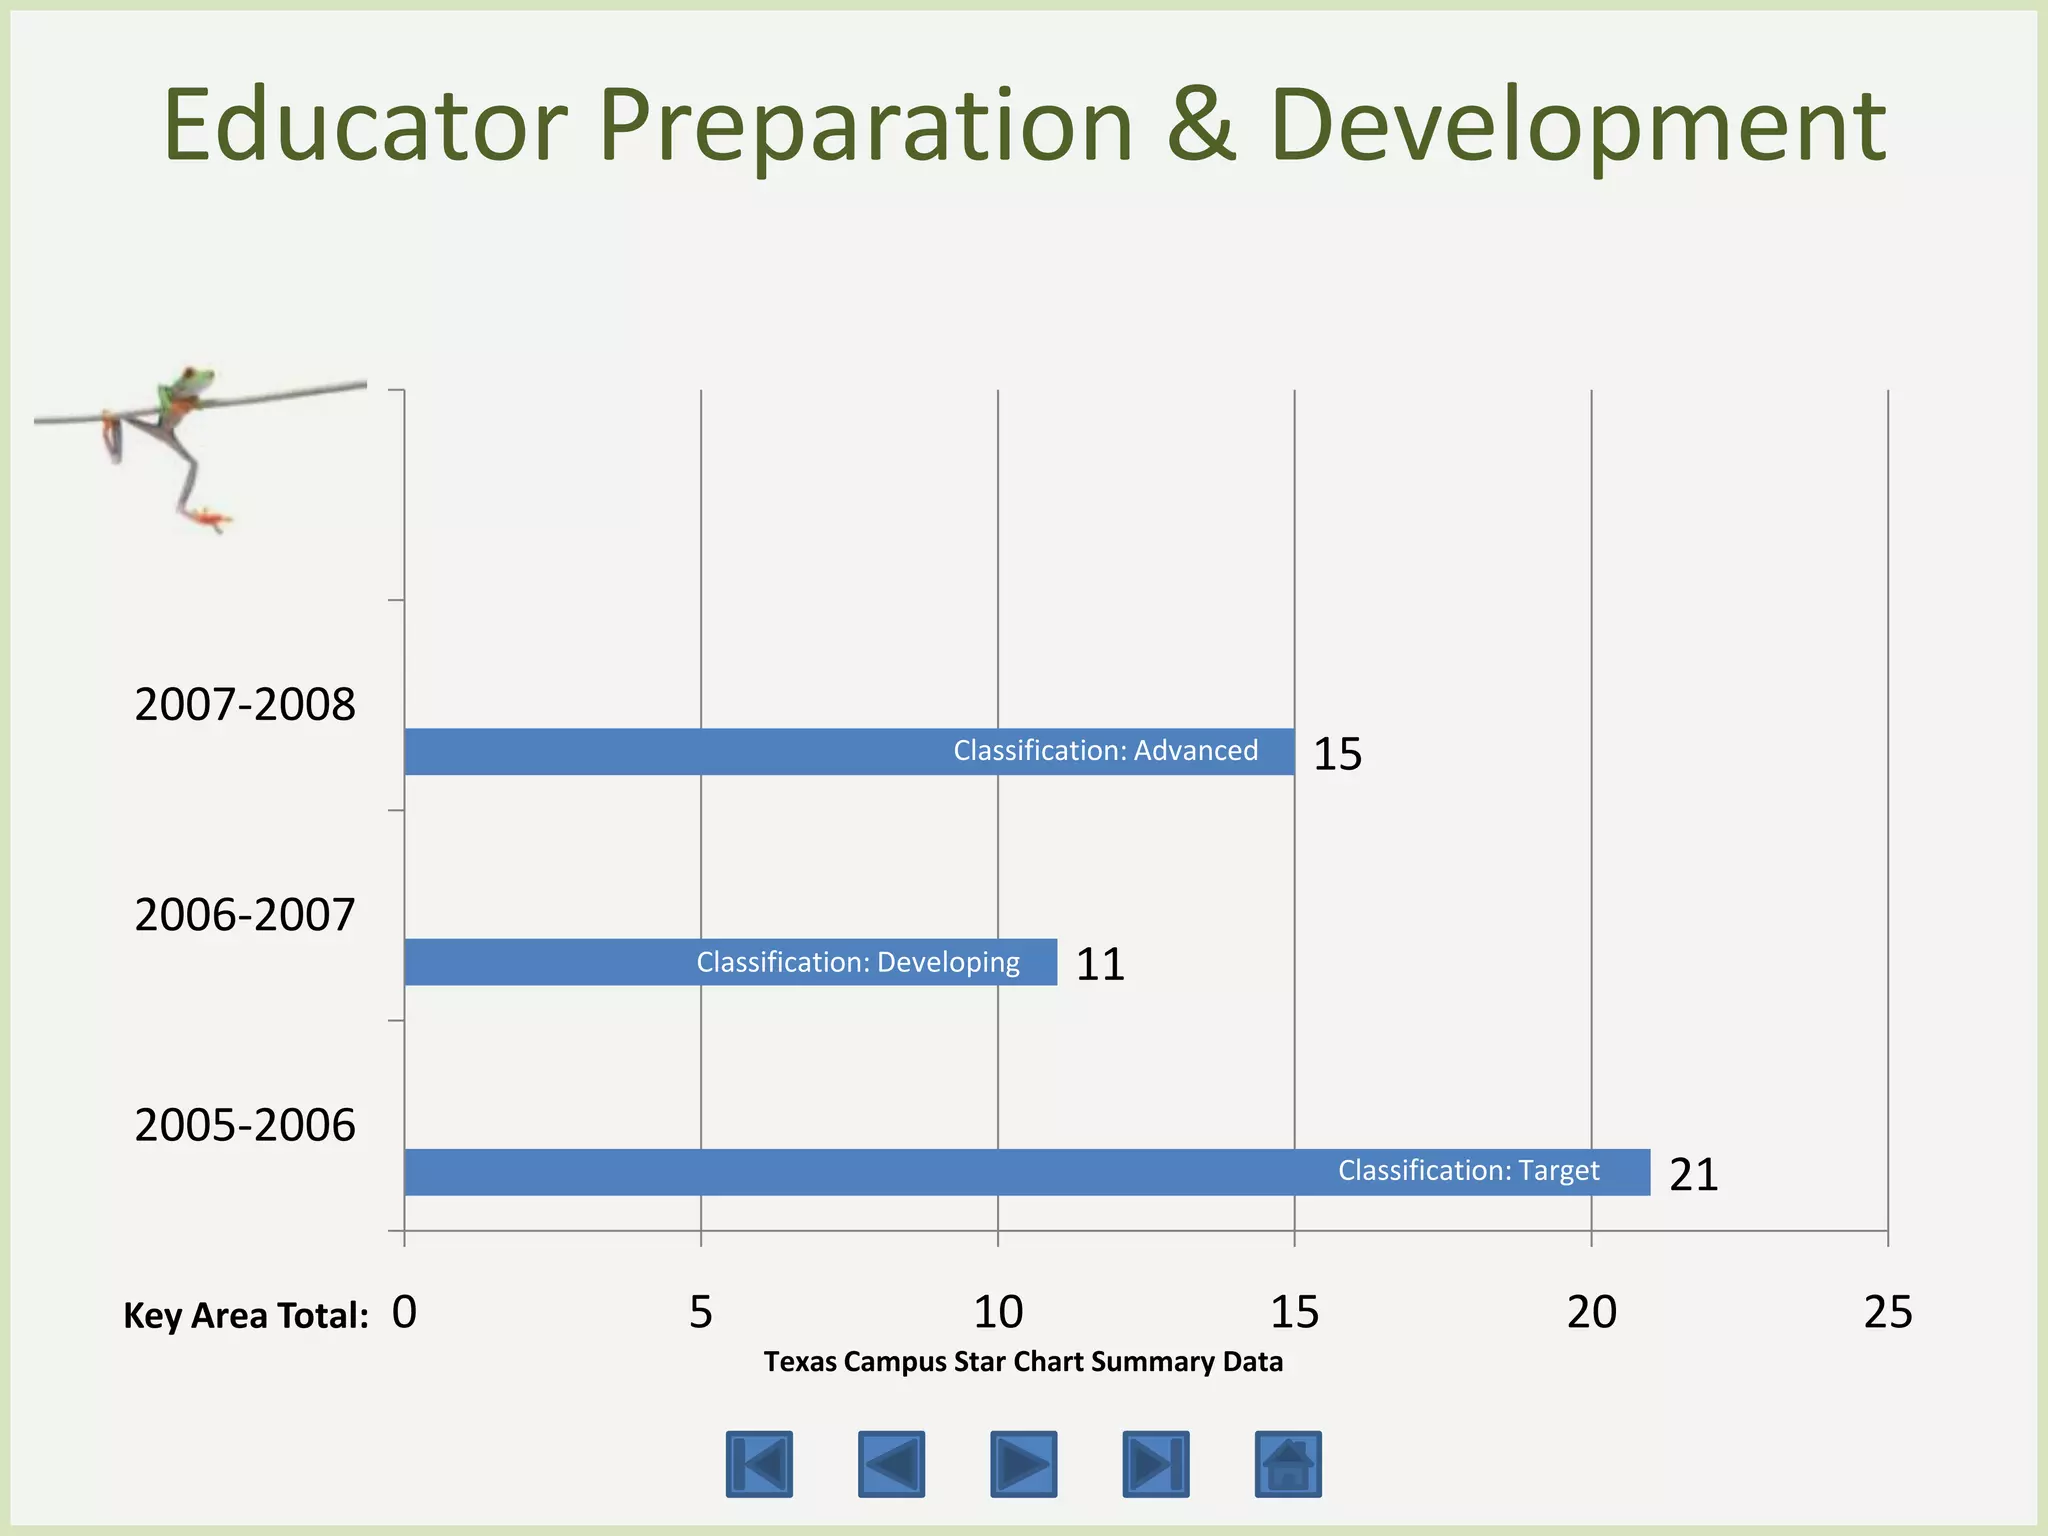
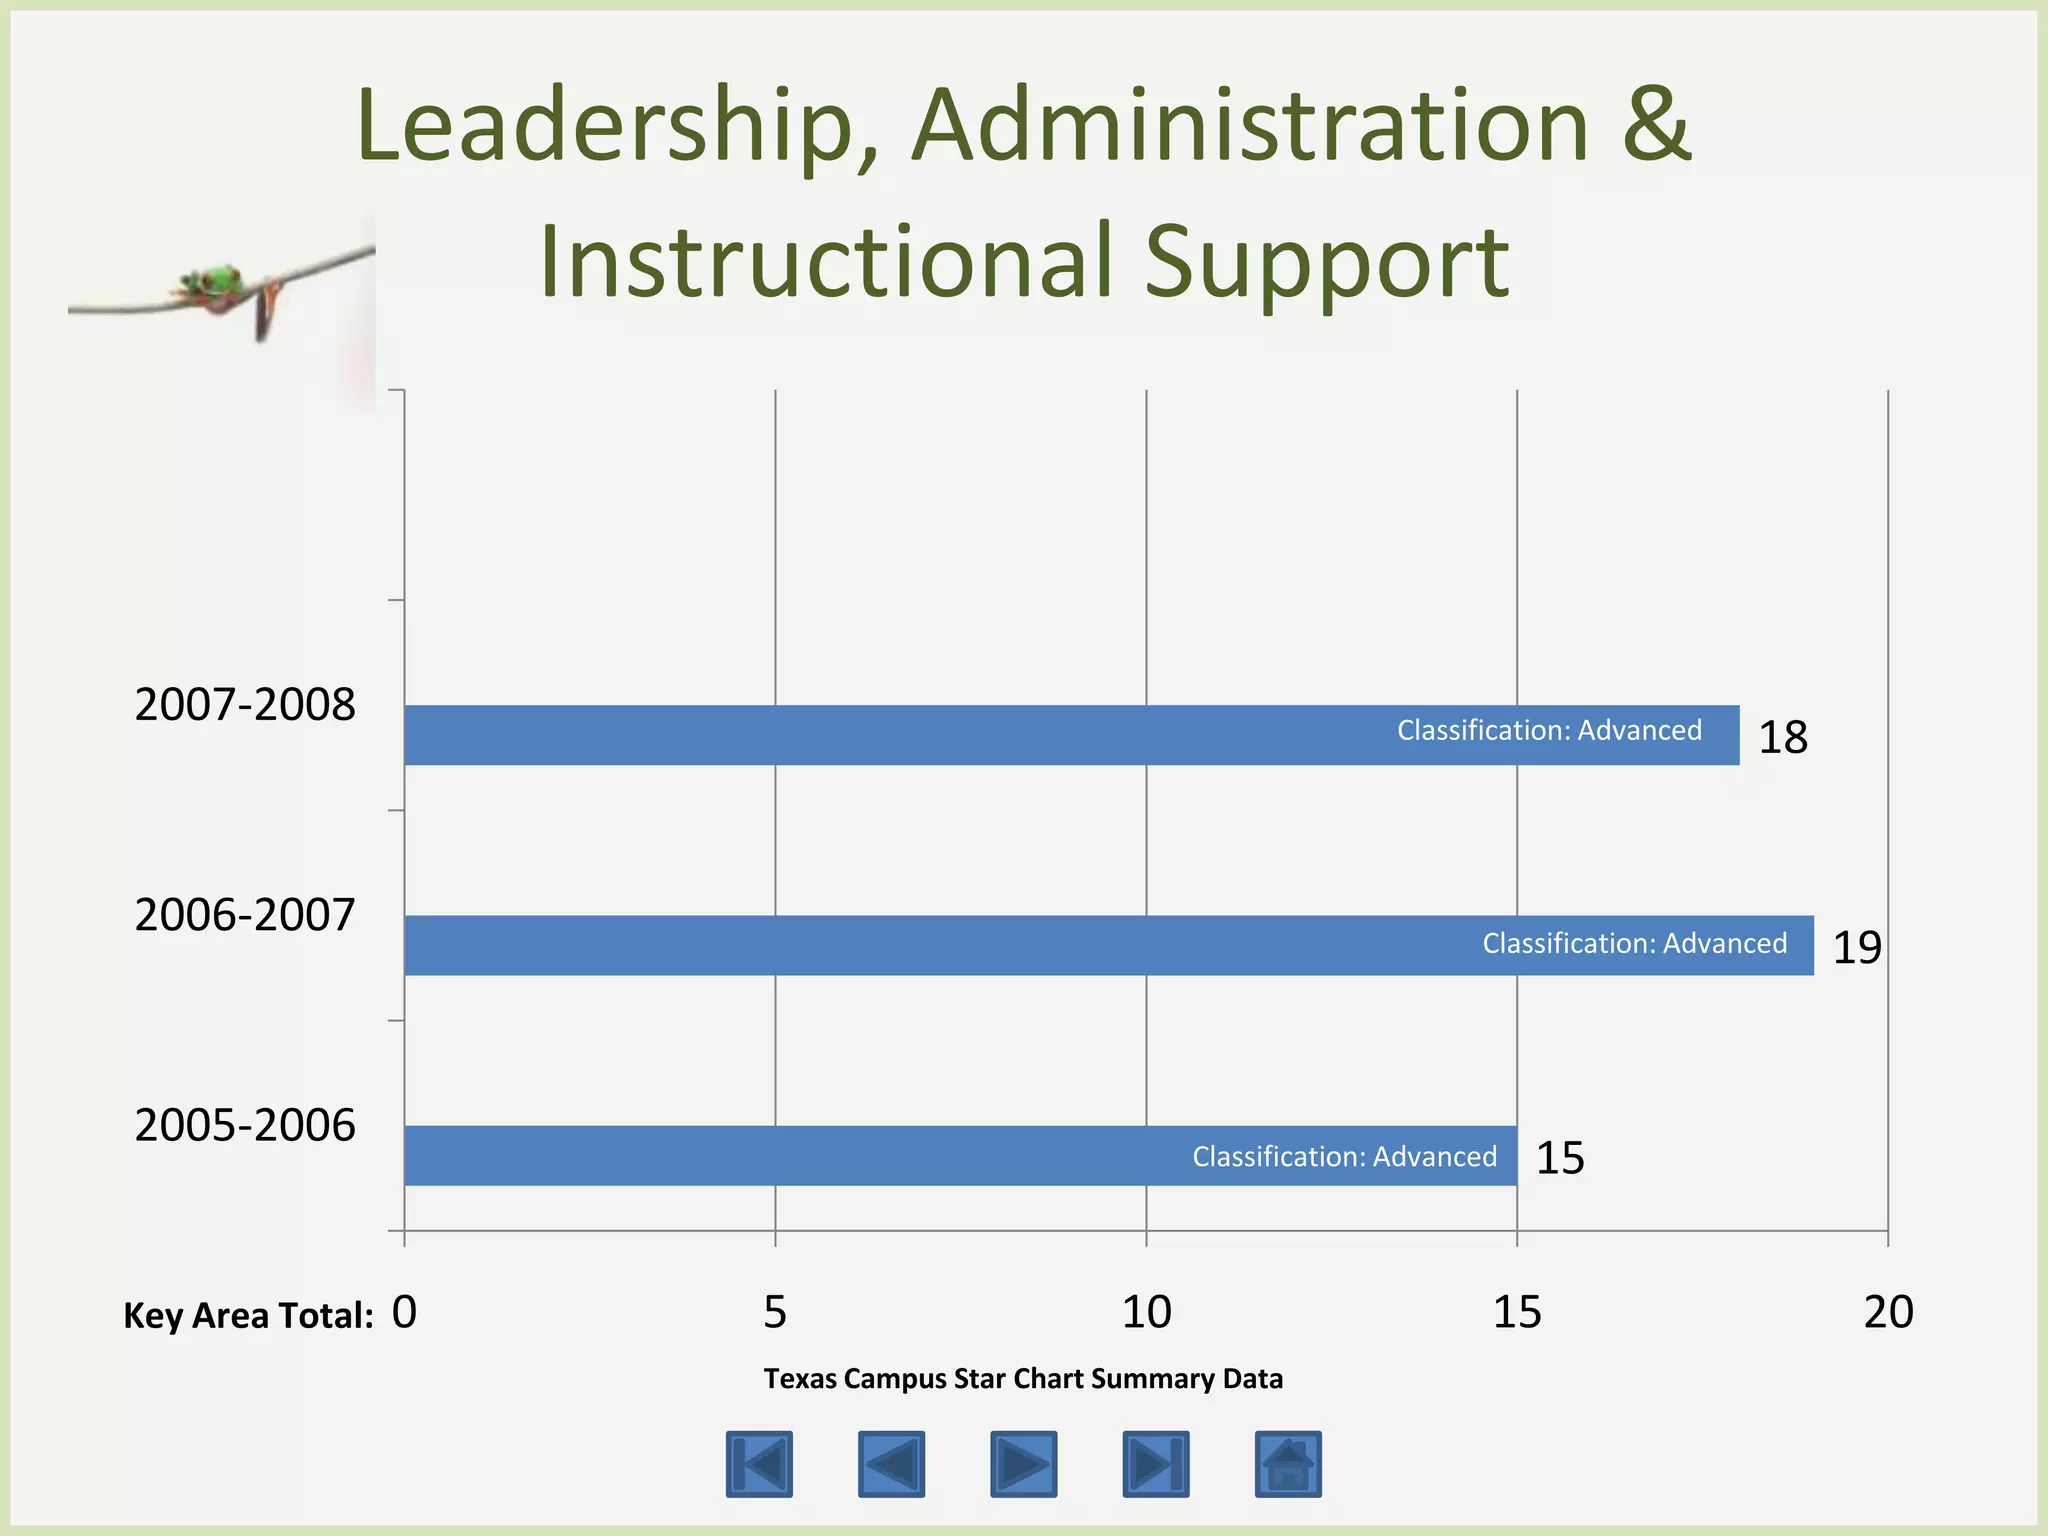
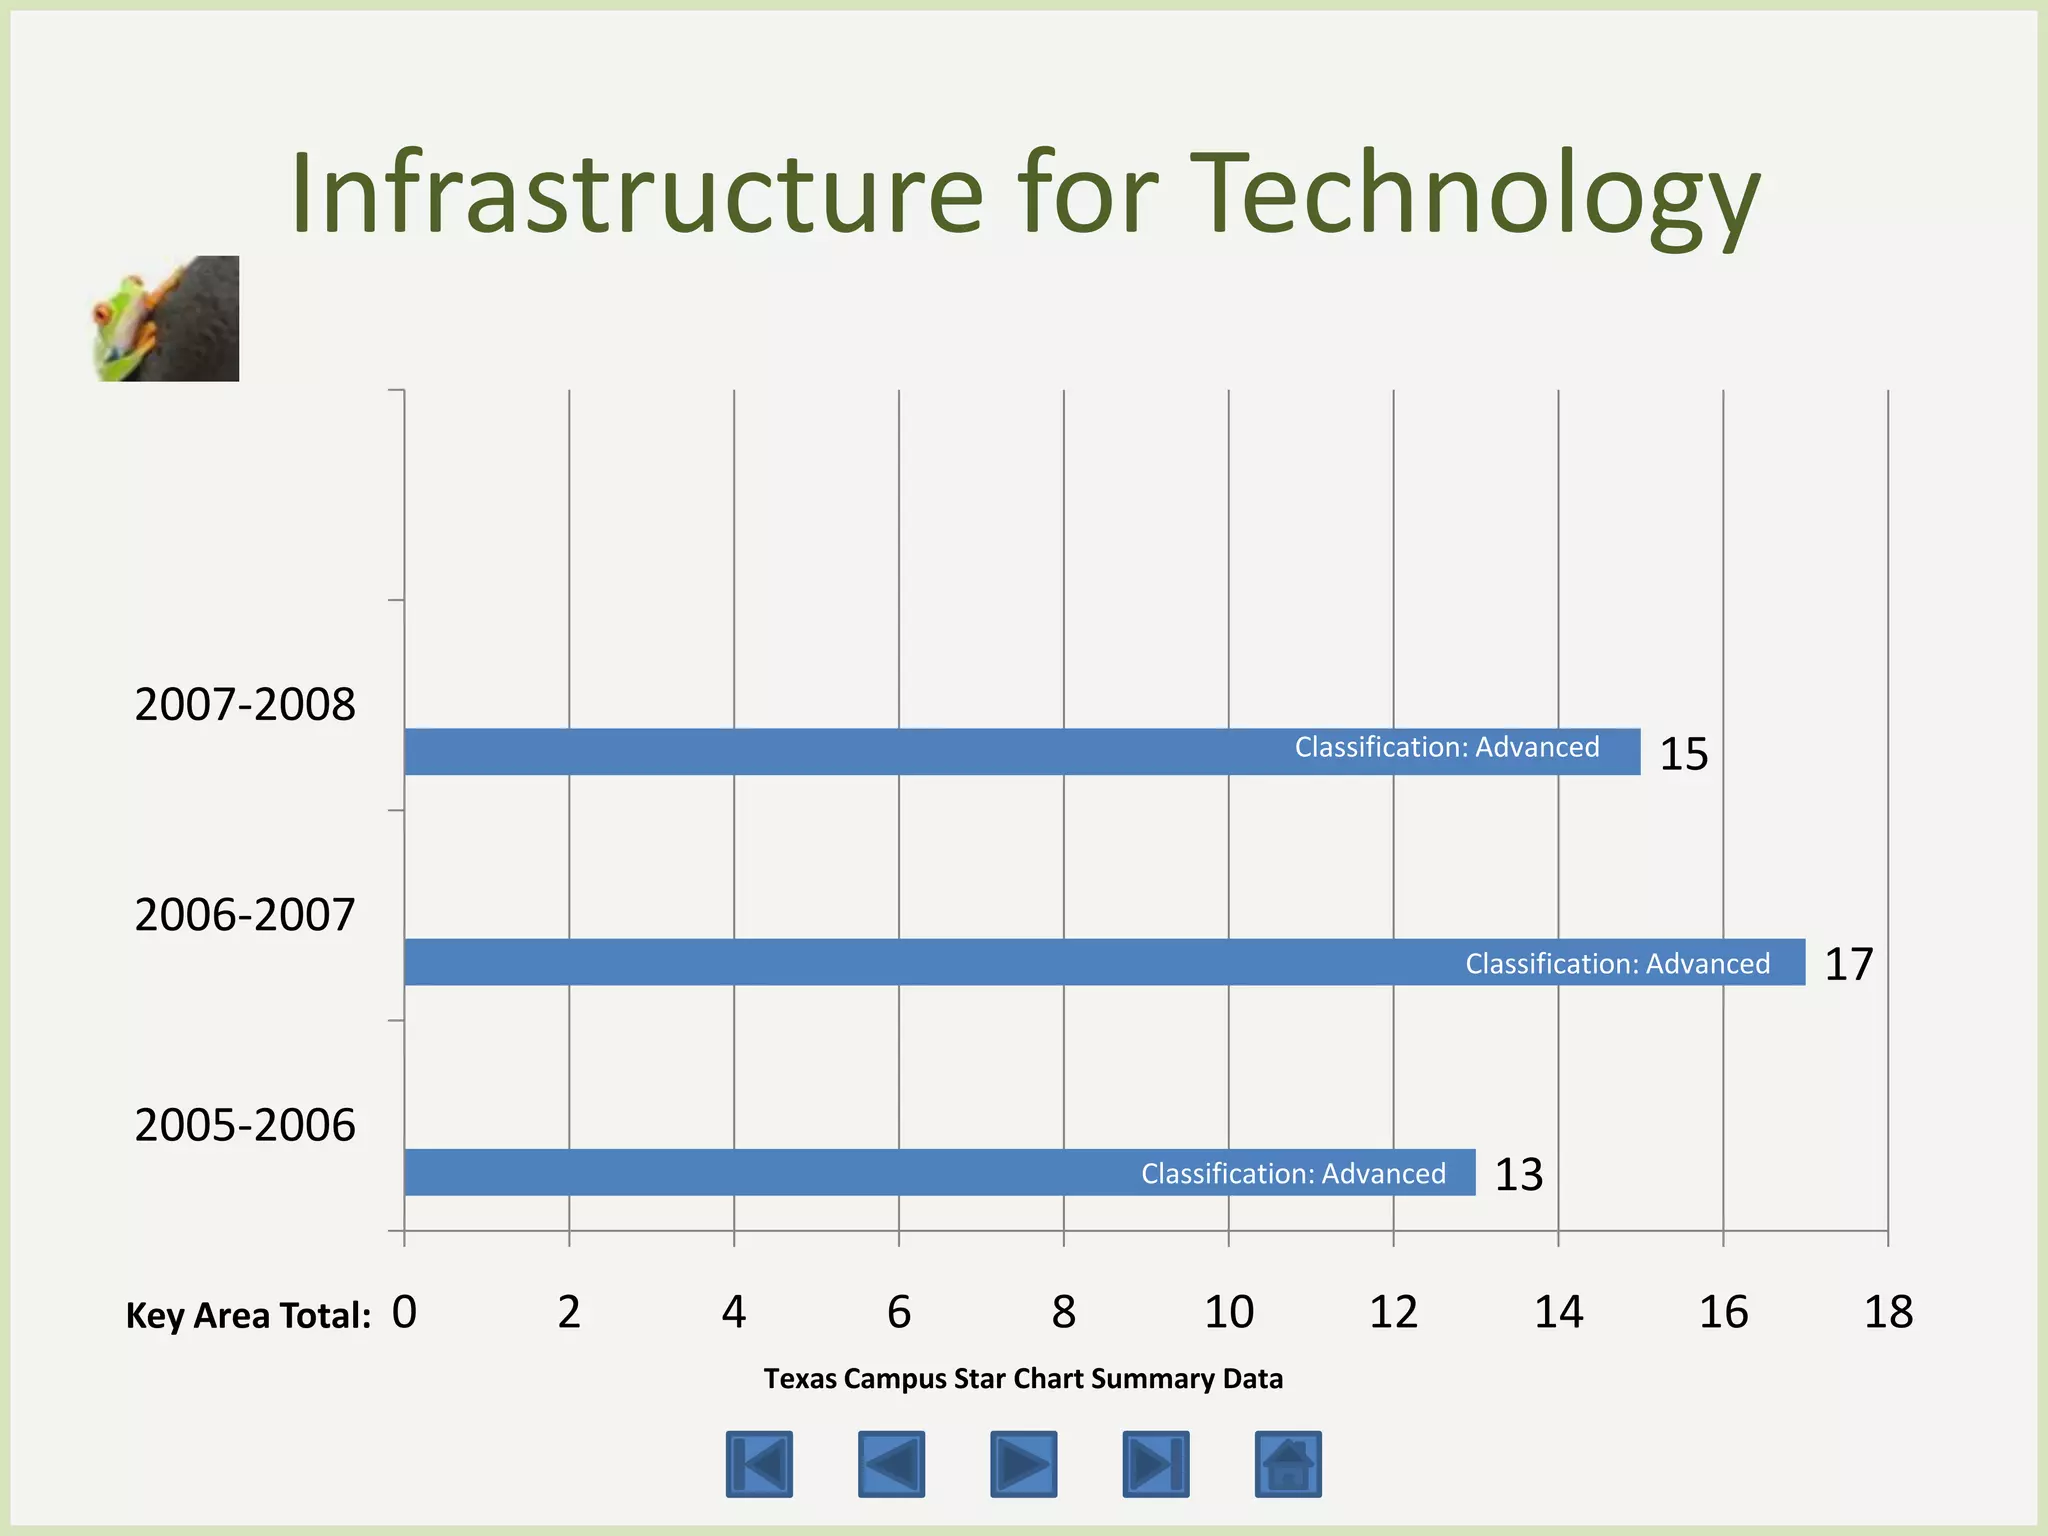
Pleasant Grove Elementary
Texas Campus STaR Chart Summary
      Leap into Learning
Table of Contents
•   Introduction
•   Purpose of School Technology
•   STaR Data Comparison Charts
•   Teaching & Learning Measures
•   Preparation & Development Measures
•   Administration & Support Measures
•   Technology Infrastructure Measures
•   Conclusion
Introduction
          STaR Chart Helps Teachers:
•   Determine professional development needs.
•   Determine funding based on teacher and classroom needs.
•   Provide data to support the need to apply for grants.
•   Pleasant Grove Elementary - STaR Data
Don’t Be Afraid Of Technology
Evolving Technology
• Technology is more than computers
• Overhead projectors were high tech in past years
• Now data projectors and smart boards are today’s overhead
  projectors
• Technology keeps evolving but is still just another tool that
  needs to be integrated into the classroom
Purpose of School Technology and
        Readiness Chart (STaR)
• Determine progress toward district long-range technology
  plan
• Determine progress toward campus improvement goals
• Determine progress toward campus vision
• Gauge yearly progress toward technology integration in the
  classrooms
Teaching and Learning


2007-2008
                                                       Classification: Advanced       15


2006-2007
                                                 Classification: Developing   14


2005-2006
                                                                                  Classification: Advanced   19

Key Area Total:   0        5                       10                             15                          20
                           Texas Campus Star Chart Summary Data
Educator Preparation & Development


2007-2008
                                          Classification: Advanced    15


2006-2007
                      Classification: Developing   11


2005-2006
                                                                          Classification: Target   21

Key Area Total:   0   5                     10                       15                      20         25
                           Texas Campus Star Chart Summary Data
Leadership, Administration &
                Instructional Support


2007-2008                                                          Classification: Advanced   18


2006-2007                                                                Classification: Advanced   19


2005-2006                                          Classification: Advanced   15


Key Area Total:   0   5                       10                          15                         20
                      Texas Campus Star Chart Summary Data
Infrastructure for Technology


2007-2008
                                                                     Classification: Advanced     15


2006-2007
                                                                                   Classification: Advanced   17


2005-2006
                                                        Classification: Advanced     13

Key Area Total:   0   2   4           6          8          10            12            14           16        18
                              Texas Campus Star Chart Summary Data
Teaching and Learning Measures
•   Teacher Role and Collaborative Learning
•   Patterns of Teacher Use
•   Frequency/Design of Instructional Setting
•   Curriculum Areas
•   Technology Applications (TEKS)
•   Patterns of Use
Educator Preparation and
             Development Measures
•   Contact of Training
•   Capability of Educators
•   Leadership and Capability of Administrators
•   Models of Professional Development
•   Levels of Understanding and Patterns of Use
•   Technology Budget Allocated to Technology Professional
    Development
Administration and Support Services
                 Measures
•   Vision and Planning
•   Technical Support
•   Instructional and Administrative Staffing
•   Budget
•   Funding
Infrastructure for Technology
                   Measures
•   Students Per Computers
•   Internet Access Connectivity Speed
•   Distance Learning
•   LAN/WAN
•   Other Technologies
To Grow in Technology
•   Connect with others who have developed skills
•   Collaborate
•   Take healthy technology risks
•   Attend professional development
•   “We are better together.”
•   Leap Into Learning
Never let technology scare you away!

Pleasant Grove STaR Progress PowerPoint

  • 1.
    Pleasant Grove Elementary TexasCampus STaR Chart Summary Leap into Learning
  • 2.
    Table of Contents • Introduction • Purpose of School Technology • STaR Data Comparison Charts • Teaching & Learning Measures • Preparation & Development Measures • Administration & Support Measures • Technology Infrastructure Measures • Conclusion
  • 3.
    Introduction STaR Chart Helps Teachers: • Determine professional development needs. • Determine funding based on teacher and classroom needs. • Provide data to support the need to apply for grants. • Pleasant Grove Elementary - STaR Data
  • 4.
    Don’t Be AfraidOf Technology
  • 5.
    Evolving Technology • Technologyis more than computers • Overhead projectors were high tech in past years • Now data projectors and smart boards are today’s overhead projectors • Technology keeps evolving but is still just another tool that needs to be integrated into the classroom
  • 6.
    Purpose of SchoolTechnology and Readiness Chart (STaR) • Determine progress toward district long-range technology plan • Determine progress toward campus improvement goals • Determine progress toward campus vision • Gauge yearly progress toward technology integration in the classrooms
  • 7.
    Teaching and Learning 2007-2008 Classification: Advanced 15 2006-2007 Classification: Developing 14 2005-2006 Classification: Advanced 19 Key Area Total: 0 5 10 15 20 Texas Campus Star Chart Summary Data
  • 8.
    Educator Preparation &Development 2007-2008 Classification: Advanced 15 2006-2007 Classification: Developing 11 2005-2006 Classification: Target 21 Key Area Total: 0 5 10 15 20 25 Texas Campus Star Chart Summary Data
  • 9.
    Leadership, Administration & Instructional Support 2007-2008 Classification: Advanced 18 2006-2007 Classification: Advanced 19 2005-2006 Classification: Advanced 15 Key Area Total: 0 5 10 15 20 Texas Campus Star Chart Summary Data
  • 10.
    Infrastructure for Technology 2007-2008 Classification: Advanced 15 2006-2007 Classification: Advanced 17 2005-2006 Classification: Advanced 13 Key Area Total: 0 2 4 6 8 10 12 14 16 18 Texas Campus Star Chart Summary Data
  • 11.
    Teaching and LearningMeasures • Teacher Role and Collaborative Learning • Patterns of Teacher Use • Frequency/Design of Instructional Setting • Curriculum Areas • Technology Applications (TEKS) • Patterns of Use
  • 12.
    Educator Preparation and Development Measures • Contact of Training • Capability of Educators • Leadership and Capability of Administrators • Models of Professional Development • Levels of Understanding and Patterns of Use • Technology Budget Allocated to Technology Professional Development
  • 13.
    Administration and SupportServices Measures • Vision and Planning • Technical Support • Instructional and Administrative Staffing • Budget • Funding
  • 14.
    Infrastructure for Technology Measures • Students Per Computers • Internet Access Connectivity Speed • Distance Learning • LAN/WAN • Other Technologies
  • 15.
    To Grow inTechnology • Connect with others who have developed skills • Collaborate • Take healthy technology risks • Attend professional development • “We are better together.” • Leap Into Learning
  • 16.
    Never let technologyscare you away!