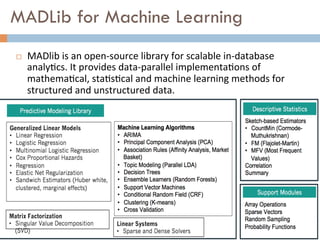
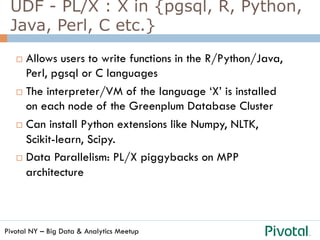
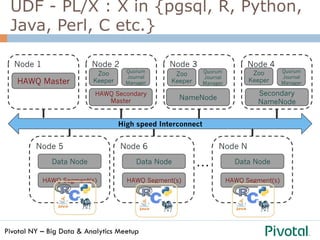
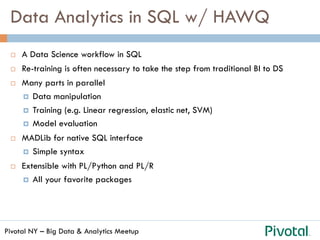
The document discusses the differences and functionalities of Hadoop-HDFS and MPP databases in handling big data. It highlights the architecture and features of Pivotal HAWQ, including its capabilities for in-database machine learning and SQL compliance. Additionally, it covers tools like Madlib for scalable analytics and the integration of SQL with machine learning workflows.
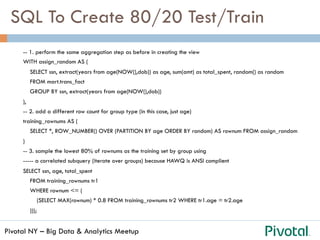
![Pivotal NY – Big Data & Analytics Meetup
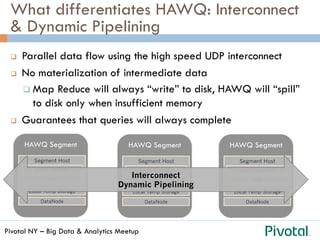
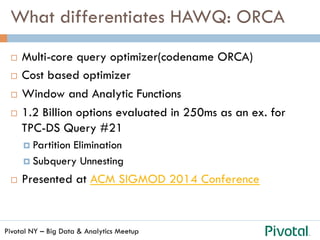
Hadoop – HDFS: 2 sides of the same coin
[……. Side Bar: This is the
first US Penny, 223 years
old. Sold for $1.2 mil……]
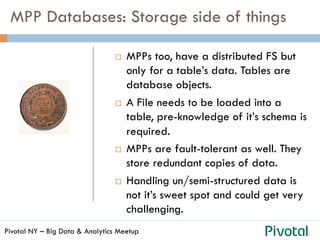
¨ How is Data stored in
HDFS?
¨ How is Data accessed, how does
the framework support
processing / computations?](https://image.slidesharecdn.com/pivotalhawqmeetup-150408163834-conversion-gate01/85/SQL-and-Machine-Learning-on-Hadoop-using-HAWQ-5-320.jpg)
![Pivotal NY – Big Data & Analytics Meetup
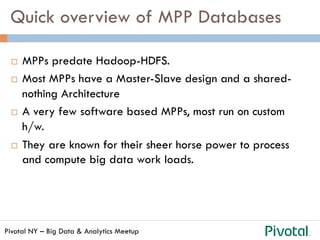
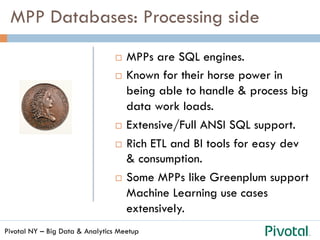
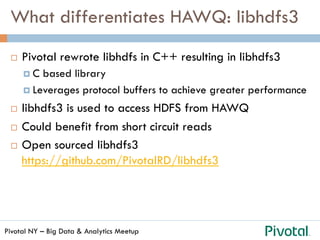
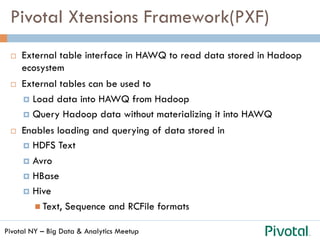
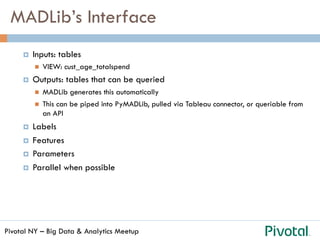
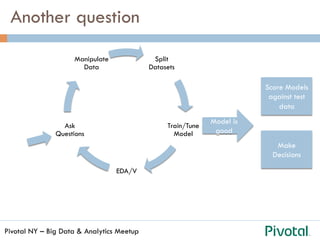
MADLib’s Interface
¤ Inputs: tables
n VIEW: cust_age_totalspend
¤ Outputs: tables that can be queried
n MADLib generates this automatically
n This can be piped into PyMADLib, pulled via Tableau connector, or queriable from
an API
¤ Labels
¤ Features
¤ Parameters
¤ Parallel when possible
SELECT madlib.linregr_train( 'cust_age_totalspend',
'linear_model',
'age',
'ARRAY[1, sum]’);](https://image.slidesharecdn.com/pivotalhawqmeetup-150408163834-conversion-gate01/85/SQL-and-Machine-Learning-on-Hadoop-using-HAWQ-45-320.jpg)
![Pivotal NY – Big Data & Analytics Meetup
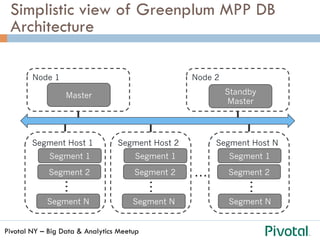
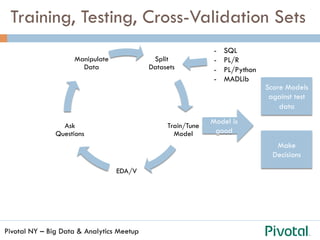
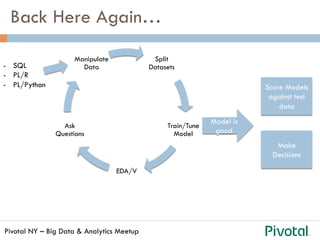
MADLib’s Interface
¤ Inputs: tables
n VIEW: cust_age_totalspend
¤ Outputs: tables that can be queried
n MADLib generates this automatically
n This can be piped into PyMADLib, pulled via Tableau connector, or queriable from
an API
¤ Labels
¤ Features
¤ Parameters
¤ Parallel when possible
SELECT madlib.linregr_train( 'cust_age_totalspend',
'linear_model',
'age',
'ARRAY[1, sum]’);](https://image.slidesharecdn.com/pivotalhawqmeetup-150408163834-conversion-gate01/85/SQL-and-Machine-Learning-on-Hadoop-using-HAWQ-46-320.jpg)
![Pivotal NY – Big Data & Analytics Meetup
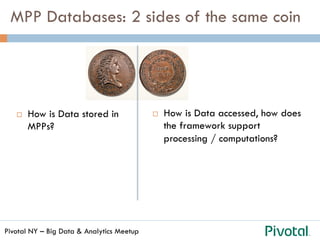
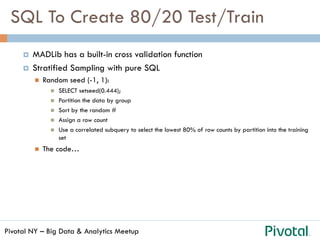
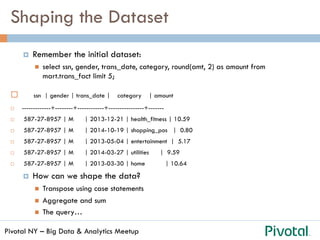
MADLib’s Interface
¤ Inputs: tables
n VIEW: cust_age_totalspend
¤ Outputs: tables that can be queried
n MADLib generates this automatically
n This can be piped into PyMADLib, pulled via Tableau connector, or queriable from
an API
¤ Labels
¤ Features
¤ Parameters
¤ Parallel when possible
SELECT madlib.linregr_train( 'cust_age_totalspend',
'linear_model',
'age',
'ARRAY[1, sum]’);](https://image.slidesharecdn.com/pivotalhawqmeetup-150408163834-conversion-gate01/85/SQL-and-Machine-Learning-on-Hadoop-using-HAWQ-47-320.jpg)
![Pivotal NY – Big Data & Analytics Meetup
MADLib’s Interface
¤ Inputs: tables
n VIEW: cust_age_totalspend
¤ Outputs: tables that can be queried
n MADLib generates this automatically
n This can be piped into PyMADLib, pulled via Tableau connector, or queriable from
an API
¤ Labels
¤ Features
¤ Parameters
¤ Parallel when possible
SELECT madlib.linregr_train( 'cust_age_totalspend',
'linear_model',
'age',
'ARRAY[1, sum]’);](https://image.slidesharecdn.com/pivotalhawqmeetup-150408163834-conversion-gate01/85/SQL-and-Machine-Learning-on-Hadoop-using-HAWQ-48-320.jpg)

![Pivotal NY – Big Data & Analytics Meetup
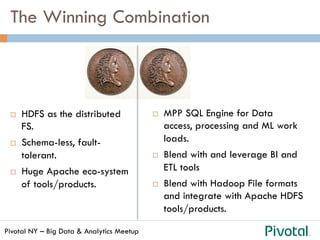
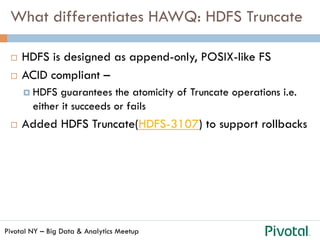
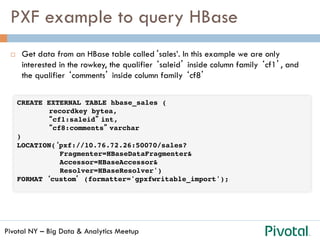
Viewing Coefficients
¤ As simple as querying a table:
SELECT * FROM linear_model;
¤ Unnest arrays:
SELECT unnest(ARRAY['intercept', 'sum']) as attribute,
unnest(coef) as coefficient,
unnest(std_err) as standard_error,
unnest(t_stats) as t_stat,
unnest(p_values) as pvalue
FROM linear_model;](https://image.slidesharecdn.com/pivotalhawqmeetup-150408163834-conversion-gate01/85/SQL-and-Machine-Learning-on-Hadoop-using-HAWQ-50-320.jpg)
![Pivotal NY – Big Data & Analytics Meetup
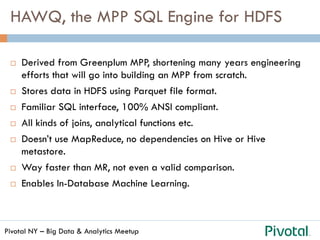
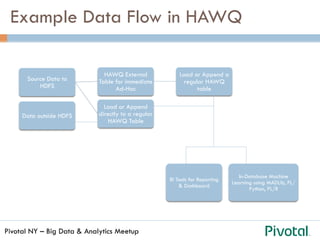
Making Predictions
SELECT ssn, sum, age,
-- calculate predictions: array and m.coef are vectors
madlib.linregr_predict( ARRAY[1, sum],
m.coef
) as predict,
-- calculate residuals: array and m.coef are vectors
age - madlib.linregr_predict( ARRAY[1, sum],
m.coef
) as residual
FROM cust_age_totalspend, linear_model m;](https://image.slidesharecdn.com/pivotalhawqmeetup-150408163834-conversion-gate01/85/SQL-and-Machine-Learning-on-Hadoop-using-HAWQ-51-320.jpg)
![Pivotal NY – Big Data & Analytics Meetup
Making Predictions
SELECT ssn, sum, age,
-- calculate predictions: array and m.coef are vectors
madlib.linregr_predict( ARRAY[1, sum],
m.coef
) as predict,
-- calculate residuals: array and m.coef are vectors
age - madlib.linregr_predict( ARRAY[1, sum],
m.coef
) as residual
FROM cust_age_totalspend, linear_model m;](https://image.slidesharecdn.com/pivotalhawqmeetup-150408163834-conversion-gate01/85/SQL-and-Machine-Learning-on-Hadoop-using-HAWQ-52-320.jpg)
![Pivotal NY – Big Data & Analytics Meetup
Making/Evaluating Predictions
SELECT ssn, sum, age,
-- calculate predictions: array and m.coef are vectors
madlib.linregr_predict( ARRAY[1, sum],
m.coef
) as predict,
-- calculate residuals: array and m.coef are vectors
age - madlib.linregr_predict( ARRAY[1, sum],
m.coef
) as residual
FROM cust_age_totalspend, linear_model m;](https://image.slidesharecdn.com/pivotalhawqmeetup-150408163834-conversion-gate01/85/SQL-and-Machine-Learning-on-Hadoop-using-HAWQ-53-320.jpg)
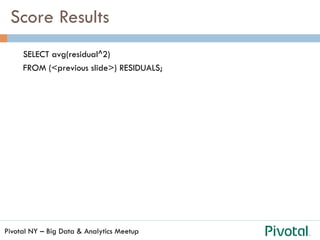
![Pivotal NY – Big Data & Analytics Meetup
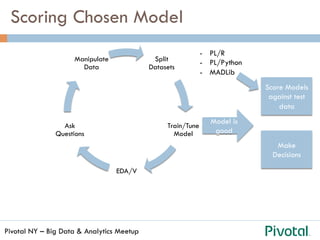
Scoring (Mean Squared Error)
SELECT avg(residual^2) AS mse
FROM (SELECT age - madlib.linregr_predict( ARRAY[1, sum],
m.coef
) as residual
FROM cust_age_totalspend, linear_model m) PREDICTIONS;](https://image.slidesharecdn.com/pivotalhawqmeetup-150408163834-conversion-gate01/85/SQL-and-Machine-Learning-on-Hadoop-using-HAWQ-54-320.jpg)


![Pivotal NY – Big Data & Analytics Meetup
Learn Age Using Category Spending
DROP TABLE IF EXISTS elastic_output;
SELECT madlib.elastic_net_train( 'training_set',
'elastic_output',
'age',
'array[food_dining, utilities, grocery_net, home,
pharmacy, shopping_pos, kids_pets, personal_care, misc_pos, gas_transport,
misc_net, health_fitness, shopping_net, travel]',
<other parameters>);](https://image.slidesharecdn.com/pivotalhawqmeetup-150408163834-conversion-gate01/85/SQL-and-Machine-Learning-on-Hadoop-using-HAWQ-64-320.jpg)
![Pivotal NY – Big Data & Analytics Meetup
Predictions on Test Set
SELECT ssn, predict, age - predict AS residual
FROM (
SELECT
test_set.*,
madlib.elastic_net_gaussian_predict(
m.coef_all,
m.intercept,
ARRAY[food_dining, utilities, grocery_net, home, pharmacy,
shopping_pos, kids_pets, personal_care, misc_pos, gas_transport, misc_net,
health_fitness, shopping_net, travel]
) AS predict
FROM test_set, elastic_output m) s
ORDER BY ssn;](https://image.slidesharecdn.com/pivotalhawqmeetup-150408163834-conversion-gate01/85/SQL-and-Machine-Learning-on-Hadoop-using-HAWQ-66-320.jpg)
![Pivotal NY – Big Data & Analytics Meetup
Predictions on Test Set
SELECT ssn, predict, age - predict AS residual
FROM (
SELECT
test_set.*,
madlib.elastic_net_gaussian_predict(
m.coef_all,
m.intercept,
ARRAY[food_dining, utilities, grocery_net, home, pharmacy,
shopping_pos, kids_pets, personal_care, misc_pos, gas_transport, misc_net,
health_fitness, shopping_net, travel]
) AS predict
FROM test_set, elastic_output m) s
ORDER BY ssn;](https://image.slidesharecdn.com/pivotalhawqmeetup-150408163834-conversion-gate01/85/SQL-and-Machine-Learning-on-Hadoop-using-HAWQ-67-320.jpg)
![Pivotal NY – Big Data & Analytics Meetup
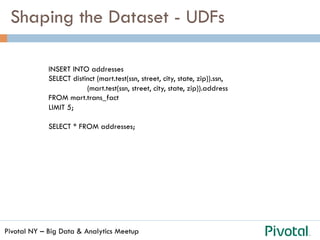
Shaping the Dataset - UDFs
DROP TYPE IF EXISTS cust_address CASCADE;
CREATE TYPE cust_address AS
(
ssn text,
address text
);
CREATE OR REPLACE FUNCTION
mart.test(ssn text, street text, city text, state text, zip
numeric)
RETURNS cust_address
AS $$
return [ssn, street + ', ' + city + ', ' + state + ' ' + str(zip)]
$$ LANGUAGE plpythonu;
----------------------------
SELECT mart.test(ssn, street, city, state, zip)
from mart.trans_fact limit 5;](https://image.slidesharecdn.com/pivotalhawqmeetup-150408163834-conversion-gate01/85/SQL-and-Machine-Learning-on-Hadoop-using-HAWQ-70-320.jpg)
![Pivotal NY – Big Data & Analytics Meetup
Shaping the Dataset - UDFs
CREATE TYPE cust_address AS
(
ssn text,
address text
);
CREATE OR REPLACE FUNCTION
mart.test(ssn text, street text, city text, state text, zip
numeric)
RETURNS cust_address
AS $$
return [ssn, street + ', ' + city + ', ' + state + ' ' + str(zip)]
$$ LANGUAGE plpythonu;
----------------------------
SELECT mart.test(ssn, street, city, state, zip)
from mart.trans_fact limit 5;](https://image.slidesharecdn.com/pivotalhawqmeetup-150408163834-conversion-gate01/85/SQL-and-Machine-Learning-on-Hadoop-using-HAWQ-71-320.jpg)
![Pivotal NY – Big Data & Analytics Meetup
Shaping the Dataset - UDFs
DROP TYPE IF EXISTS cust_address CASCADE;
CREATE TYPE cust_address AS
(
ssn text,
address text
);
CREATE OR REPLACE FUNCTION
mart.test(ssn text, street text, city text, state text, zip
numeric)
RETURNS cust_address
AS $$
return [ssn, street + ', ' + city + ', ' + state + ' ' + str(zip)]
$$ LANGUAGE plpythonu;
----------------------------
SELECT mart.test(ssn, street, city, state, zip)
from mart.trans_fact limit 5;](https://image.slidesharecdn.com/pivotalhawqmeetup-150408163834-conversion-gate01/85/SQL-and-Machine-Learning-on-Hadoop-using-HAWQ-72-320.jpg)
![Pivotal NY – Big Data & Analytics Meetup
Shaping the Dataset - UDFs
DROP TYPE IF EXISTS cust_address CASCADE;
CREATE TYPE cust_address AS
(
ssn text,
address text
);
CREATE OR REPLACE FUNCTION
mart.test(ssn text, street text, city text, state text, zip
numeric)
RETURNS cust_address
AS $$
return [ssn, street + ', ' + city + ', ' + state + ' ' + str(zip)]
$$ LANGUAGE plpythonu;
----------------------------
SELECT mart.test(ssn, street, city, state, zip)
from mart.trans_fact limit 5;](https://image.slidesharecdn.com/pivotalhawqmeetup-150408163834-conversion-gate01/85/SQL-and-Machine-Learning-on-Hadoop-using-HAWQ-73-320.jpg)
![Pivotal NY – Big Data & Analytics Meetup
Shaping the Dataset - UDFs
DROP TYPE IF EXISTS cust_address CASCADE;
CREATE TYPE cust_address AS
(
ssn text,
address text
);
CREATE OR REPLACE FUNCTION
mart.test(ssn text, street text, city text, state text, zip
numeric)
RETURNS cust_address
AS $$
return [ssn, street + ', ' + city + ', ' + state + ' ' + str(zip)]
$$ LANGUAGE plpythonu;
----------------------------
SELECT mart.test(ssn, street, city, state, zip)
from mart.trans_fact limit 5;](https://image.slidesharecdn.com/pivotalhawqmeetup-150408163834-conversion-gate01/85/SQL-and-Machine-Learning-on-Hadoop-using-HAWQ-74-320.jpg)