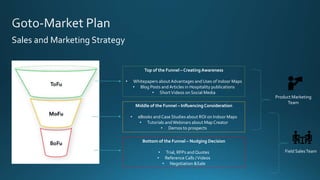
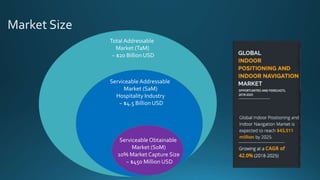
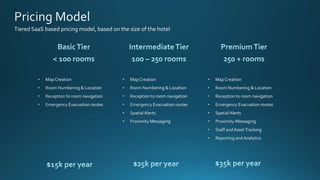
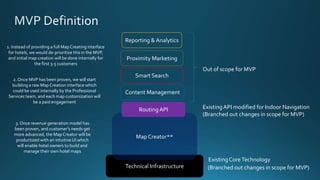
Turn byTurn navigation for hotel customers to easily navigate the
property and enable easier discovery of amenities
Proximity Messaging & Services
Real time notifications sent to user based on Hyperlocal content
to nudge them to a particular amenity or service
Group Location Sharing
Share your location in a group in real time inside the property to
stay connected with family, friends and peers
Intelligent Parking
Blend outdoor and indoor navigation seamlessly to help hotel
customers find parking in the most convenient spots
Adjacent Use Cases Continued..
AssetTracking and Status
Spatial Business Intelligence
Physical Security Information
Indoor Geofencing
Monitor and track locations of key assets including hotel staff and
valuable cleaning equipment, in real time
Gain visibility into operations using dashboards and reports and
traffic location data to make smarter business decisions
Create virtual boundaries and trigger actions when someone
enters, leaves, or stays within the specified area
Empower hotel security teams to be more aware of their spatial
environment, and optimize action response time
Existing Platform Capabilities
RoutingAPI
Terrain Road Elevation Satellite
New Platform Capabilities
Indoor
RoutingAPI
Content Management
Proximity Marketing
Smart Search
Reporting & Analytics
Technical InfrastructureTechnical Infrastructure
Map Creator**Mapping Data Provider*
+
Personas
Tom theTraveler
(User)
Dan the Developer
(User)
Olga Hotel Owner
(Influencer)
Diana Director of IT
(Buyer)
Chris the CIO
(Buyer)
Value Matrix and Messaging
Pain Points ProductValue Message
User
• Unable to book
preferred location
rooms
• Unable to find nearby
facilities
• View the most
convenient room
locations while booking
• Have the hotel map in
your phone when you
need it
• Know our hotel like
you know your
home
Influencer
• Unable to upsell
rooms
• Unable to showcase
hotel amenities
• Provide personalization
• Nudge to and Showcase
hotel amenities
• Lead your
customers to the
right places at the
right time
Buyer
• Unable to get data on
customer preferences
• Provide Customer
convenience and
• Enhance customer
experience
• Deeply engage
with your customer
like never before
and improve brand
value
Understanding the Buyer
Target Market – Big Hotel
Chains who have hundreds of
hotels and thousands of hotel
rooms spread across countries
CIO
Director - Systems Director - Experience Director – Integrations
VP - IT
Indoor Mapping will need to be directly
sold to the Enterprise IT systems
Organization since it will be integrated
with org-wide systems and applications.
It will need to be a multi-pronged
approach to sell into different channels,
and the value proposition will need to be
taken up the value chain to the CIO.
The Sales and Marketing team will need
to use both top down and bottom up
approaches depending on their
outreach.
Sales and Marketing Strategy
Top of the Funnel – Creating Awareness
• Whitepapers aboutAdvantages and Uses of Indoor Maps
• Blog Posts andArticles in Hospitality publications
• ShortVideos on Social Media
Middle of the Funnel – InfluencingConsideration
• eBooks and Case Studies about ROI on Indoor Maps
• Tutorials andWebinars about Map Creator
• Demos to prospects
Bottom of the Funnel – Nudging Decision
• Trial, RFPs and Quotes
• Reference Calls /Videos
• Negotiation &Sale
Product Marketing
Team
Field SalesTeam
Total Addressable
Market (TaM)
~ $20 Billion USD
Serviceable Addressable
Market (SaM)
Hospitality Industry
~ $4.5 Billion USD
Serviceable Obtainable
Market (SoM)
10% Market Capture Size
~ $450 Million USD
Indoor Focused
Outdoor Focused
Generalized
Hospitality
Focused
Tiered SaaS based pricing model, based on the size of the hotel
Product
• Product
Manager
• Product
Owner
• UX
Designer
Engineering
• Engineering
Manager
• Tech Architect
• 6 Back end
Developers
• 3 Front end
Developers
• 3 SDETs
Marketing
• Product Marketer • Executive
Sponsor
Leadership
• Hospitality Industry
Sales Director
Sales
Cross
Functional
Tiger team
Y1Q1 Y1Q2 Y1Q3 Y1Q4 Y2Q1 Y2Q2 Y2Q3 Y2Q4 Y3Q1 Y3Q2 Y3Q3 Y3Q4
Subsriber Base 0 0 100 200 400 600 900 1350 2025 2500 3200 4000
Quarterly growth 0% 0% 0% 100% 100% 50% 50% 50% 50% 25% 25% 25%
New Subscribers Acquired 0 0 100 100 200 200 300 450 675 475 700 800
Average Quarterly Revenue Per
Subscriber 0 0 5000 5000 5000 5000 5000 5000 5000 5000 5000 5000
Quarterly Revenue 0 0 500,000 1,000,000 2,000,000 3,000,000 4,500,000 6,750,000 10,125,000 12,500,000 16,000,000 20,000,000
Yearly Total Revenue Y1 1,500,000 Y2 16,250,000 Y3 58,625,000
Product Development Cost 500,000 500,000 500,000 500,000 250,000 250,000 250,000 250,000 100,00 100,000 100,000 100,000
AWS / Azure Cost 20,000 23,000 26,450 30,418 34,980 40,227 46,261 53,200 61,180 70,358 80,911 93,048
Average CAC* 5,000
Cost of New Subscribers Acquisition 0 0 500,000 500,000 1,000,000 1,000,000 1,500,000 2,250,000 3,375,000 2,375,000 3,500,000 4,000,000
Marketing Expenses 50,000 50,000 50,000 50,000 100,000 100,000 100,000 100,000 250,000 250,000 250,000 250,000
Customer Support Expenses 0 0 100,000 115,000 132,250 152,088 174,901 201,136 231,306 266,002 305,902 351,788
Quarterly Expenses 570,000 573,000 1,176,450 1,195,418 1,517,230 1,542,315 2,071,162 2,854,336 3,917,487 3,061,360 4,236,813 4,794,835
Yearly Total Expenses Y1 3,514,868 Y2 7,985,043 Y3 16,010,495
Quarterly Profit / Loss -570,000 -573,000 -676,450 -195,418 482,770 1,457,685 2,428,838 3,895,664 6,207,513 9,438,640 11,763,187 15,205,165
Yearly Profit / Loss Y1 -2,014,868 Y2 8,264,957 Y3 42,614,505
Technical Infrastructure
Map Creator**
RoutingAPI
Content Management
Proximity Messaging
Smart Search
Reporting & Analytics
Map Creator for Hotels, to create and manage
their own hotel maps floor wise with spatial
details, either by consuming an existing 3D model,
or by building a model from scratch
Intutive search functionality, to search for rooms or
amenities in the same hotel, or across properties
ExistingCoreTechnology
modifications might be required
Content Management System for Hotels to
manage, organize and reuse map components
across properties along with metadata (e.g.
convenient location score etc)
Notification system for customer to push
notifications to users to nudge them with offers to
attractions or amenities
ExistingAPIs used by developers
Will be used for room to room navigation
Analytics engine and Dashboard and reports for hotel
owners to analyze contextual traffic information across
their properties
Technical Infrastructure
Map Creator**
RoutingAPI
Content Management
Proximity Marketing
Smart Search
Reporting & Analytics
Out of scope for MVP
ExistingCoreTechnology
(Branched out changes in scope for MVP)
ExistingAPI modified for Indoor Navigation
(Branched out changes in scope for MVP)
1. Instead of providing a full Map Creating interface
for hotels, we would de-prioritize this in the MVP,
and initial map creation will be done internally for
the first 3-5 customers
2. Once MVP has been proven, we will start
building a raw Map Creation interface which
could be used internally by the Professional
Services team, and each map customization will
be a paid engagement
3. Once revenue generation model has
been proven, and customer’s needs get
more advanced, the Map Creator will be
productized with an intuitive UI which
will enable hotel owners to build and
manage their own hotel maps
Pitch deck
Pitch deck

Pitch deck

  • 6.
    Turn byTurn navigationfor hotel customers to easily navigate the property and enable easier discovery of amenities Proximity Messaging & Services Real time notifications sent to user based on Hyperlocal content to nudge them to a particular amenity or service Group Location Sharing Share your location in a group in real time inside the property to stay connected with family, friends and peers Intelligent Parking Blend outdoor and indoor navigation seamlessly to help hotel customers find parking in the most convenient spots
  • 7.
    Adjacent Use CasesContinued.. AssetTracking and Status Spatial Business Intelligence Physical Security Information Indoor Geofencing Monitor and track locations of key assets including hotel staff and valuable cleaning equipment, in real time Gain visibility into operations using dashboards and reports and traffic location data to make smarter business decisions Create virtual boundaries and trigger actions when someone enters, leaves, or stays within the specified area Empower hotel security teams to be more aware of their spatial environment, and optimize action response time
  • 9.
    Existing Platform Capabilities RoutingAPI TerrainRoad Elevation Satellite New Platform Capabilities Indoor RoutingAPI Content Management Proximity Marketing Smart Search Reporting & Analytics Technical InfrastructureTechnical Infrastructure Map Creator**Mapping Data Provider* +
  • 10.
    Personas Tom theTraveler (User) Dan theDeveloper (User) Olga Hotel Owner (Influencer) Diana Director of IT (Buyer) Chris the CIO (Buyer)
  • 11.
    Value Matrix andMessaging Pain Points ProductValue Message User • Unable to book preferred location rooms • Unable to find nearby facilities • View the most convenient room locations while booking • Have the hotel map in your phone when you need it • Know our hotel like you know your home Influencer • Unable to upsell rooms • Unable to showcase hotel amenities • Provide personalization • Nudge to and Showcase hotel amenities • Lead your customers to the right places at the right time Buyer • Unable to get data on customer preferences • Provide Customer convenience and • Enhance customer experience • Deeply engage with your customer like never before and improve brand value
  • 12.
    Understanding the Buyer TargetMarket – Big Hotel Chains who have hundreds of hotels and thousands of hotel rooms spread across countries CIO Director - Systems Director - Experience Director – Integrations VP - IT Indoor Mapping will need to be directly sold to the Enterprise IT systems Organization since it will be integrated with org-wide systems and applications. It will need to be a multi-pronged approach to sell into different channels, and the value proposition will need to be taken up the value chain to the CIO. The Sales and Marketing team will need to use both top down and bottom up approaches depending on their outreach.
  • 13.
    Sales and MarketingStrategy Top of the Funnel – Creating Awareness • Whitepapers aboutAdvantages and Uses of Indoor Maps • Blog Posts andArticles in Hospitality publications • ShortVideos on Social Media Middle of the Funnel – InfluencingConsideration • eBooks and Case Studies about ROI on Indoor Maps • Tutorials andWebinars about Map Creator • Demos to prospects Bottom of the Funnel – Nudging Decision • Trial, RFPs and Quotes • Reference Calls /Videos • Negotiation &Sale Product Marketing Team Field SalesTeam
  • 14.
    Total Addressable Market (TaM) ~$20 Billion USD Serviceable Addressable Market (SaM) Hospitality Industry ~ $4.5 Billion USD Serviceable Obtainable Market (SoM) 10% Market Capture Size ~ $450 Million USD
  • 15.
  • 16.
    Tiered SaaS basedpricing model, based on the size of the hotel
  • 17.
    Product • Product Manager • Product Owner •UX Designer Engineering • Engineering Manager • Tech Architect • 6 Back end Developers • 3 Front end Developers • 3 SDETs Marketing • Product Marketer • Executive Sponsor Leadership • Hospitality Industry Sales Director Sales Cross Functional Tiger team
  • 18.
    Y1Q1 Y1Q2 Y1Q3Y1Q4 Y2Q1 Y2Q2 Y2Q3 Y2Q4 Y3Q1 Y3Q2 Y3Q3 Y3Q4 Subsriber Base 0 0 100 200 400 600 900 1350 2025 2500 3200 4000 Quarterly growth 0% 0% 0% 100% 100% 50% 50% 50% 50% 25% 25% 25% New Subscribers Acquired 0 0 100 100 200 200 300 450 675 475 700 800 Average Quarterly Revenue Per Subscriber 0 0 5000 5000 5000 5000 5000 5000 5000 5000 5000 5000 Quarterly Revenue 0 0 500,000 1,000,000 2,000,000 3,000,000 4,500,000 6,750,000 10,125,000 12,500,000 16,000,000 20,000,000 Yearly Total Revenue Y1 1,500,000 Y2 16,250,000 Y3 58,625,000 Product Development Cost 500,000 500,000 500,000 500,000 250,000 250,000 250,000 250,000 100,00 100,000 100,000 100,000 AWS / Azure Cost 20,000 23,000 26,450 30,418 34,980 40,227 46,261 53,200 61,180 70,358 80,911 93,048 Average CAC* 5,000 Cost of New Subscribers Acquisition 0 0 500,000 500,000 1,000,000 1,000,000 1,500,000 2,250,000 3,375,000 2,375,000 3,500,000 4,000,000 Marketing Expenses 50,000 50,000 50,000 50,000 100,000 100,000 100,000 100,000 250,000 250,000 250,000 250,000 Customer Support Expenses 0 0 100,000 115,000 132,250 152,088 174,901 201,136 231,306 266,002 305,902 351,788 Quarterly Expenses 570,000 573,000 1,176,450 1,195,418 1,517,230 1,542,315 2,071,162 2,854,336 3,917,487 3,061,360 4,236,813 4,794,835 Yearly Total Expenses Y1 3,514,868 Y2 7,985,043 Y3 16,010,495 Quarterly Profit / Loss -570,000 -573,000 -676,450 -195,418 482,770 1,457,685 2,428,838 3,895,664 6,207,513 9,438,640 11,763,187 15,205,165 Yearly Profit / Loss Y1 -2,014,868 Y2 8,264,957 Y3 42,614,505
  • 19.
    Technical Infrastructure Map Creator** RoutingAPI ContentManagement Proximity Messaging Smart Search Reporting & Analytics Map Creator for Hotels, to create and manage their own hotel maps floor wise with spatial details, either by consuming an existing 3D model, or by building a model from scratch Intutive search functionality, to search for rooms or amenities in the same hotel, or across properties ExistingCoreTechnology modifications might be required Content Management System for Hotels to manage, organize and reuse map components across properties along with metadata (e.g. convenient location score etc) Notification system for customer to push notifications to users to nudge them with offers to attractions or amenities ExistingAPIs used by developers Will be used for room to room navigation Analytics engine and Dashboard and reports for hotel owners to analyze contextual traffic information across their properties
  • 20.
    Technical Infrastructure Map Creator** RoutingAPI ContentManagement Proximity Marketing Smart Search Reporting & Analytics Out of scope for MVP ExistingCoreTechnology (Branched out changes in scope for MVP) ExistingAPI modified for Indoor Navigation (Branched out changes in scope for MVP) 1. Instead of providing a full Map Creating interface for hotels, we would de-prioritize this in the MVP, and initial map creation will be done internally for the first 3-5 customers 2. Once MVP has been proven, we will start building a raw Map Creation interface which could be used internally by the Professional Services team, and each map customization will be a paid engagement 3. Once revenue generation model has been proven, and customer’s needs get more advanced, the Map Creator will be productized with an intuitive UI which will enable hotel owners to build and manage their own hotel maps

Editor's Notes

  • #4 References: https://businessblog.trivago.com/hospitality-trends-2020/ https://cmo.adobe.com/articles/2017/4/ar-vr-wearables-travel-industry-trends-adi.html#gs.wxdrg4 https://hoteltechreport.com/news/100-hotel-trends https://www.siteminder.com/r/trends-advice/hotel-insights/hotel-industry-2020-predicting-future-difficult/ https://www.revfine.com/hospitality-trends/ https://insights.ehotelier.com/insights/2018/01/23/5-ways-technology-changing-consumer-expectations-hospitality/
  • #6 Industry dominants like Google and Bing maps do not support indoor mapping for Hotels today.
  • #10 *Assuming MapGenius is sourcing data from a 3rd party mapping data provider **Using a Professional Services (initially) or a Self Serve model (to scale)
  • #12 Buyer’s journey Marketing Strategy Sales Strategy
  • #13 Buyer’s journey Marketing Strategy Sales Strategy
  • #14 Buyer’s journey Marketing Strategy Sales Strategy
  • #15 https://www.alliedmarketresearch.com/in https://www.grandviewresearch.com/industry-analysis/indoor-lbs-marketdoor-positioning-and-indoor-navigation-ipin-market
  • #17 *These prices are just wild estimates of what the actual pricing would be. Actual pricing can only be determined iteratively by nailing down what the willingness to buy is from the customer, which can be achieved by qualitative customer interviews