Downloaded 33 times


![2. OVERCOMING SOCIAL BACKGROUND
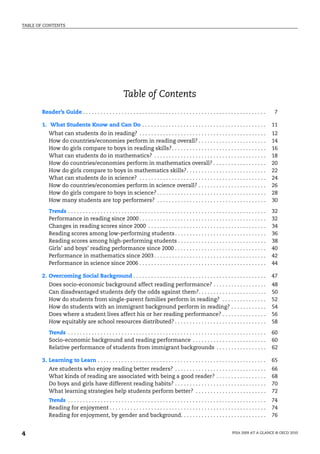
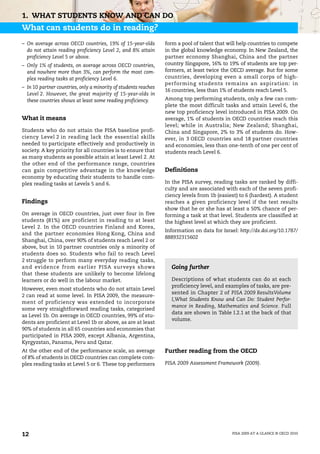
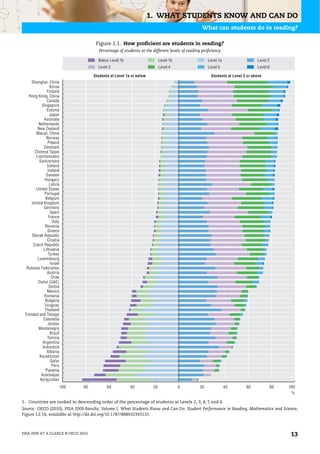
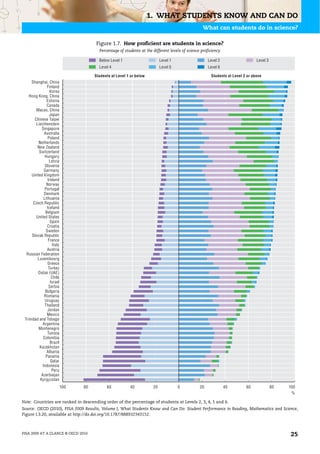
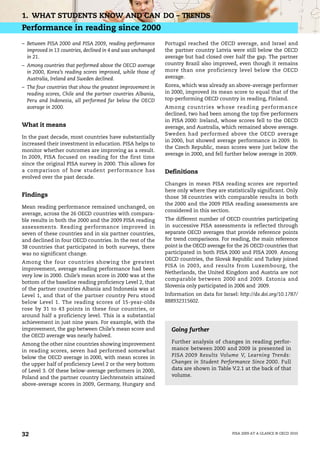
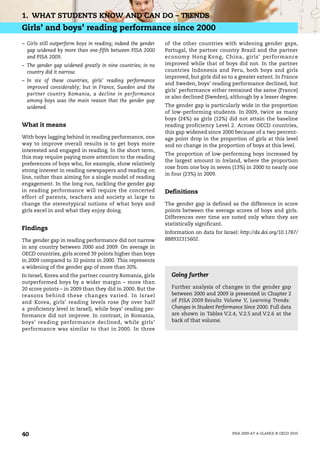
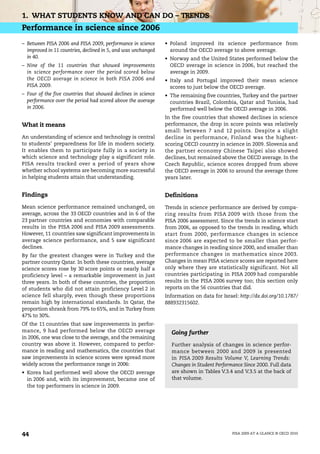
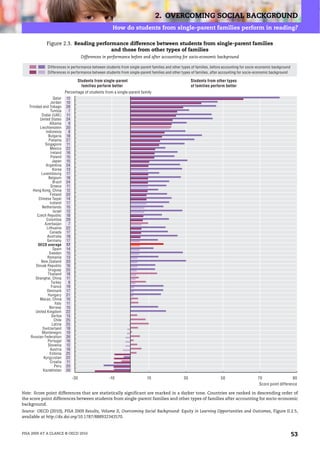
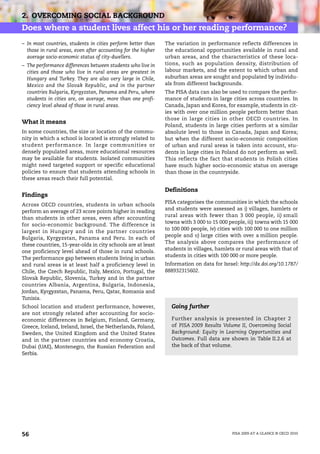
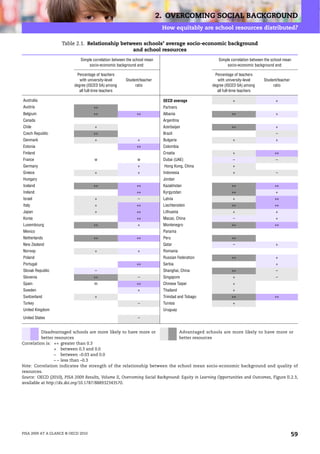
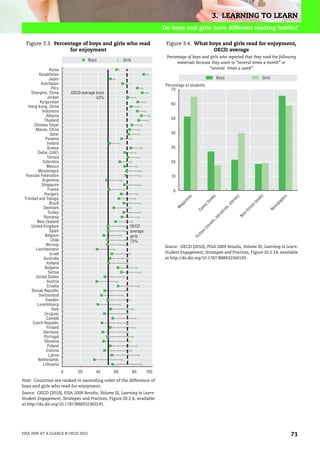
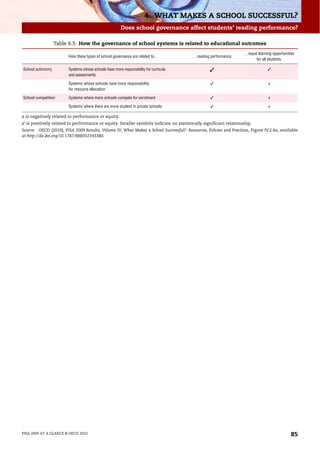
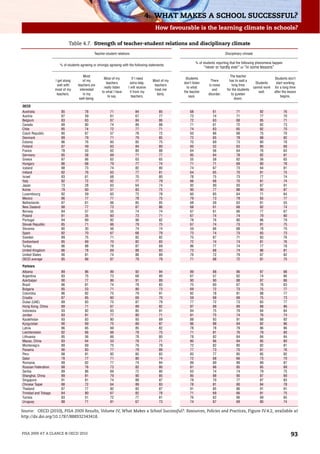
Does where a student lives affect his or her reading performance?
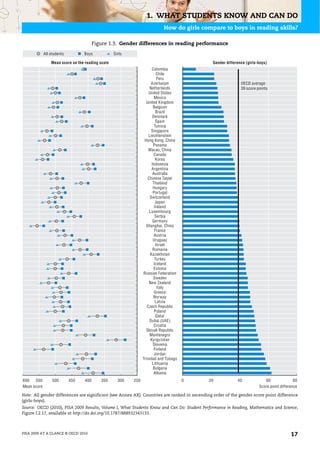
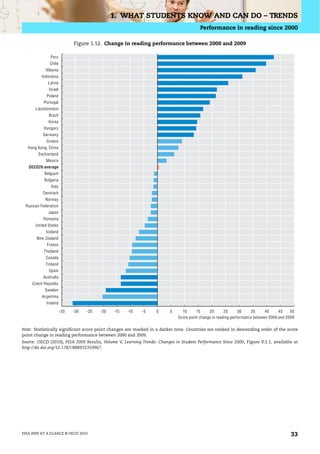
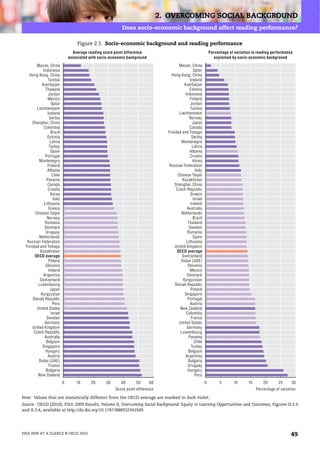
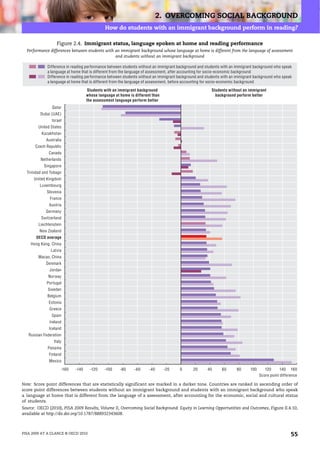
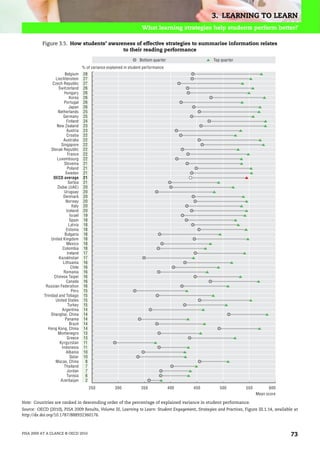
Figure 2.5. Reading performance, by school location
Mean scores after accounting for socio-economic background
Village, hamlet or rural area (fewer than 3 000 people)
City (100 000 to about 1 000 000 people) Large city (with over 1 000 000 people)
Shanghai, China
Korea
Finland
Hong Kong, China
Canada
New Zealand
Japan
Singapore
Australia
Luxembourg
Netherlands
Switzerland
Norway
Estonia
Poland
Portugal
Israel
Chinese Taipei
Hungary
Iceland
Ireland
Sweden
OECD average
Denmark
United States
Germany
Spain
Belgium
Czech Republic
Latvia
United Kingdom
Liechtenstein
Slovak Republic
Italy
Macao, China
Greece
Slovenia
Croatia
Russian Federation
Lithuania
Austria
Turkey
Dubai (UAE)
Bulgaria
Chile
Serbia
Tunisia
Mexico
Thailand
Romania
Qatar
Uruguay
Colombia
Panama
Indonesia
Trinidad and Tobago
Argentina
Brazil
Kazakhstan
Jordan
Montenegro
Albania
Peru
Kyrgyzstan
Azerbaijan
250 300 350 400 450 500 550 600
Mean score
Note: Countries are ranked in descending order of the average performance of students in cities (cities and large cities). For
Liechtenstein and Trinidad and Tobago, where this is not possible, the average of remaining categories were used, including village,
hamlet and rural area (shown), and two other categories which are not shown in this Figure (small town [3 000 to about 15 000 people]
and town [15 000 to about 100 000 people]).
Source: OECD (2010), PISA 2009 Results, Volume II, Overcoming Social Background: Equity in Learning Opportunities and Outcomes, Figure II.2.6,
available at http://dx.doi.org/10.1787/888932343570.
PISA 2009 AT A GLANCE © OECD 2010 57](https://image.slidesharecdn.com/pisa2009ataglance-101223051743-phpapp01/85/Pisa-2009-at-a-glance-58-320.jpg)


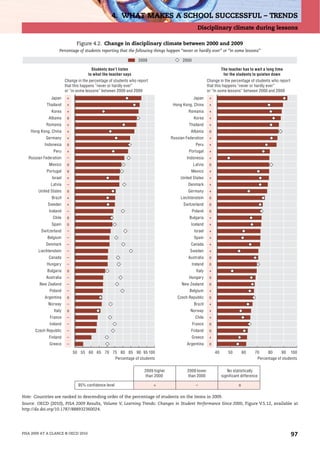


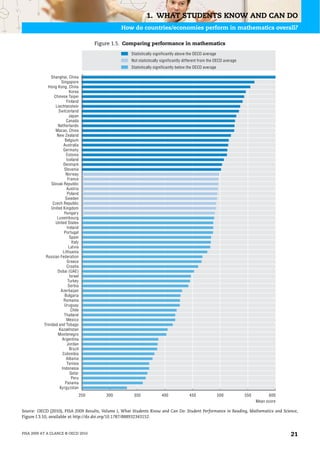
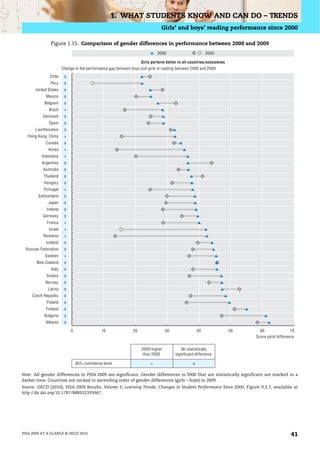
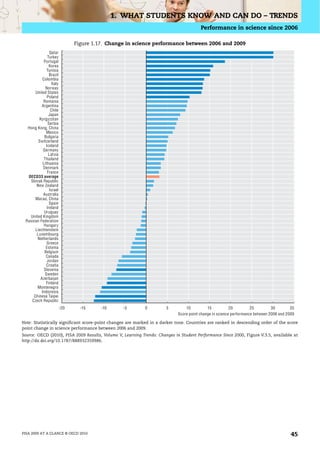
PISA 2009 at a glance presents an overview of the international student assessment conducted by the OECD, focusing on the educational performance of about 470,000 students across 65 countries. The primary emphasis of this assessment is on reading, while also providing updates on mathematics and science, with new evaluations for digital text comprehension. The document explores factors affecting student performance, such as socio-economic backgrounds and school effectiveness, and encourages international collaboration in education to enhance learning outcomes.


