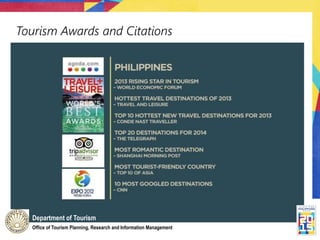
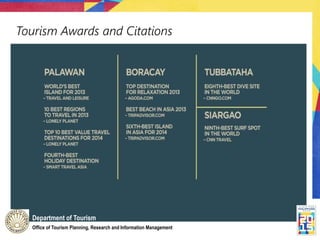
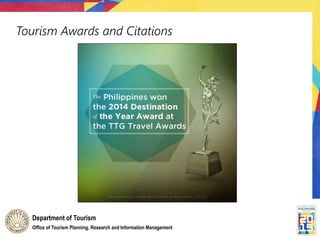
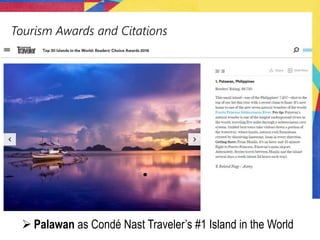
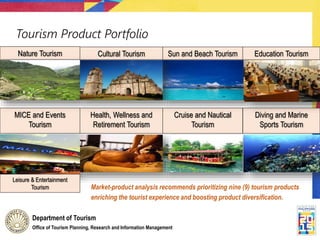
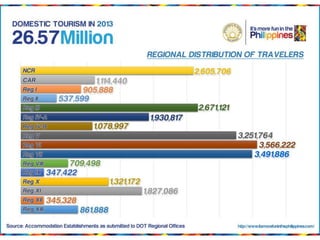
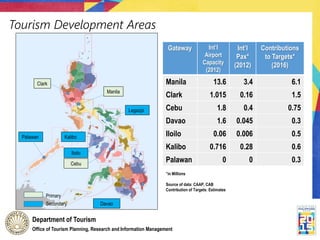
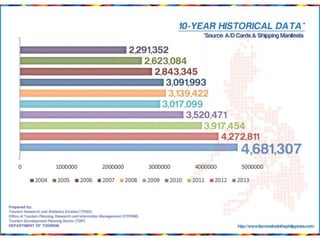
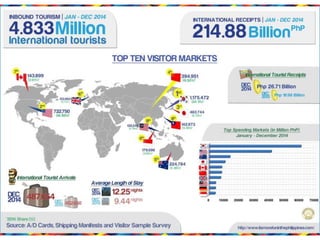
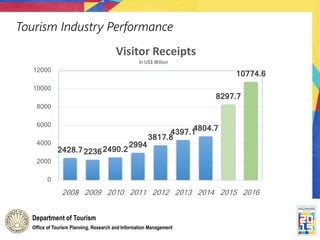
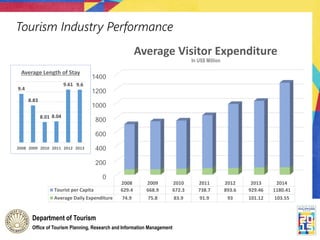
Prepared By: DOT - OTPRIM
Office of Tourism Planning, Research and Information
Management
Department of Tourism
Ramon A. Tiongco Jr.
DOT Research and Statistics Division
Office of Tourism Planning, Research and Information Management
Department of Tourism
Tourism Awards and Citations
Department of Tourism
Office of Tourism Planning, Research and Information Management
Tourism Awards and Citations
Department of Tourism
Office of Tourism Planning, Research and Information Management
Tourism Awards and Citations
Department of Tourism
Office of Tourism Planning, Research and Information Management
Tourism Awards and Citations
 Palawan as Condé Nast Traveler’s #1 Island in the World
Office of Tourism Planning, Research and Information Management
Department of Tourism
Tourism Product Portfolio
Department of Tourism
Office of Tourism Planning, Research and Information Management
Nature Tourism Cultural Tourism Sun and Beach Tourism
Cruise and Nautical
Tourism
MICE and Events
Tourism
Health, Wellness and
Retirement Tourism
Diving and Marine
Sports Tourism
Education Tourism
Market-product analysis recommends prioritizing nine (9) tourism products
enriching the tourist experience and boosting product diversification.
Leisure & Entertainment
Tourism
International Visitor
Receipts
Department of Tourism
Office of Tourism Planning, Research and Information Management
Tourism Development Areas
Gateway Int’l
Airport
Capacity
(2012)
Int’l
Pax*
(2012)
Contributions
to Targets*
(2016)
Manila 13.6 3.4 6.1
Clark 1.015 0.16 1.5
Cebu 1.8 0.4 0.75
Davao 1.6 0.045 0.3
Iloilo 0.06 0.006 0.5
Kalibo 0.716 0.28 0.6
Palawan 0 0 0.3
Clark
Manila
Kalibo
Iloilo
Palawan
Cebu
Davao
Primary
Secondary
*in Millions
Source of data: CAAP, CAB
Contribution of Targets: Estimates
Legazpi
Office of Tourism Planning, Research and Information Management
Department of Tourism
International Visitor
Receipts
International Visitor
Receipts
Tourism Industry Performance
Department of Tourism
Office of Tourism Planning, Research and Information Management
2428.722362490.2
2994
3817.8
4397.14804.7
8297.7
10774.6
0
2000
4000
6000
8000
10000
12000
2008 2009 2010 2011 2012 2013 2014 2015 2016
Visitor Receipts
In US$ Million
Tourism Industry Performance
Department of Tourism
Office of Tourism Planning, Research and Information Management
0
200
400
600
800
1000
1200
1400
2008 2009 2010 2011 2012 2013 2014
Tourist per Capita 629.4 668.9 672.3 738.7 893.6 929.46 1180.41
Average Daily Expenditure 74.9 75.8 83.9 91.9 93 101.12 103.55
Average Visitor Expenditure
In US$ Million
9.4
8.83
8.01 8.04
9.61 9.6
2008 2009 2010 2011 2012 2013
Average Length of Stay
Office of Tourism Planning, Research and Information Management
Department of Tourism

PHL Tourism Industry Performance

  • 1.
    Prepared By: DOT- OTPRIM Office of Tourism Planning, Research and Information Management Department of Tourism Ramon A. Tiongco Jr. DOT Research and Statistics Division
  • 2.
    Office of TourismPlanning, Research and Information Management Department of Tourism
  • 3.
    Tourism Awards andCitations Department of Tourism Office of Tourism Planning, Research and Information Management
  • 4.
    Tourism Awards andCitations Department of Tourism Office of Tourism Planning, Research and Information Management
  • 5.
    Tourism Awards andCitations Department of Tourism Office of Tourism Planning, Research and Information Management
  • 6.
    Tourism Awards andCitations  Palawan as Condé Nast Traveler’s #1 Island in the World
  • 7.
    Office of TourismPlanning, Research and Information Management Department of Tourism
  • 8.
    Tourism Product Portfolio Departmentof Tourism Office of Tourism Planning, Research and Information Management Nature Tourism Cultural Tourism Sun and Beach Tourism Cruise and Nautical Tourism MICE and Events Tourism Health, Wellness and Retirement Tourism Diving and Marine Sports Tourism Education Tourism Market-product analysis recommends prioritizing nine (9) tourism products enriching the tourist experience and boosting product diversification. Leisure & Entertainment Tourism
  • 10.
  • 11.
    Department of Tourism Officeof Tourism Planning, Research and Information Management Tourism Development Areas Gateway Int’l Airport Capacity (2012) Int’l Pax* (2012) Contributions to Targets* (2016) Manila 13.6 3.4 6.1 Clark 1.015 0.16 1.5 Cebu 1.8 0.4 0.75 Davao 1.6 0.045 0.3 Iloilo 0.06 0.006 0.5 Kalibo 0.716 0.28 0.6 Palawan 0 0 0.3 Clark Manila Kalibo Iloilo Palawan Cebu Davao Primary Secondary *in Millions Source of data: CAAP, CAB Contribution of Targets: Estimates Legazpi
  • 12.
    Office of TourismPlanning, Research and Information Management Department of Tourism
  • 13.
  • 14.
  • 15.
    Tourism Industry Performance Departmentof Tourism Office of Tourism Planning, Research and Information Management 2428.722362490.2 2994 3817.8 4397.14804.7 8297.7 10774.6 0 2000 4000 6000 8000 10000 12000 2008 2009 2010 2011 2012 2013 2014 2015 2016 Visitor Receipts In US$ Million
  • 16.
    Tourism Industry Performance Departmentof Tourism Office of Tourism Planning, Research and Information Management 0 200 400 600 800 1000 1200 1400 2008 2009 2010 2011 2012 2013 2014 Tourist per Capita 629.4 668.9 672.3 738.7 893.6 929.46 1180.41 Average Daily Expenditure 74.9 75.8 83.9 91.9 93 101.12 103.55 Average Visitor Expenditure In US$ Million 9.4 8.83 8.01 8.04 9.61 9.6 2008 2009 2010 2011 2012 2013 Average Length of Stay
  • 17.
    Office of TourismPlanning, Research and Information Management Department of Tourism