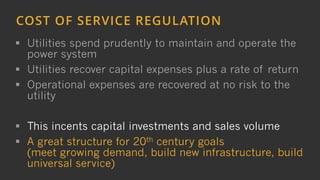
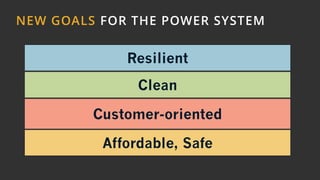
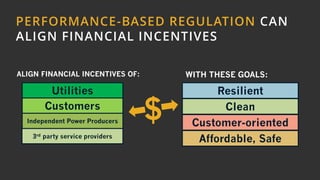
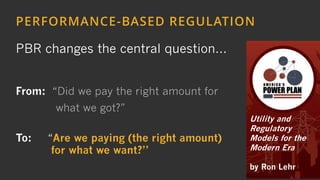
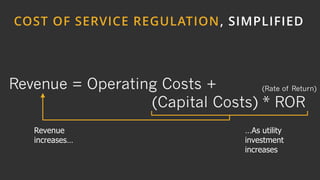
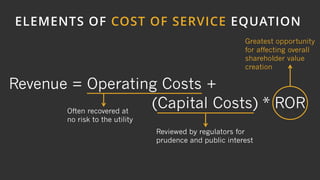
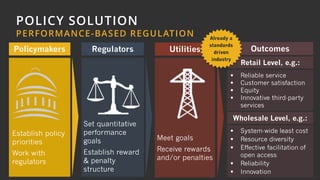
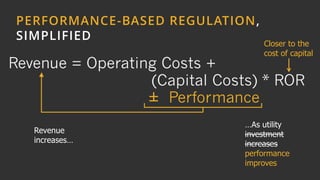
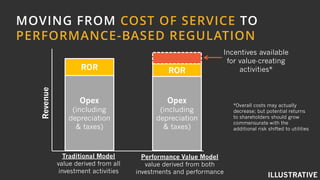
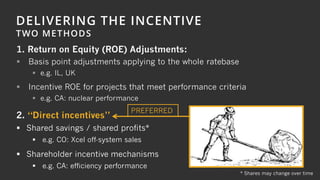
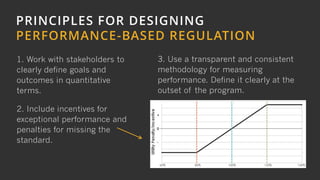
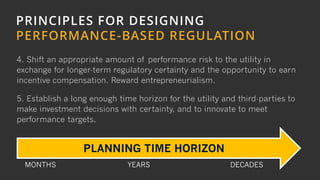
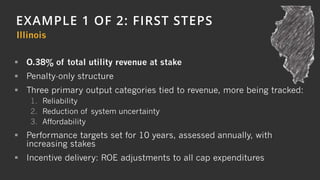
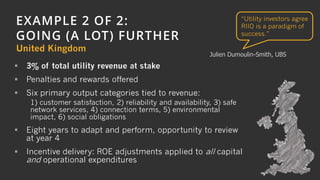
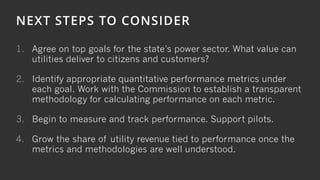
1
PERFORMANCE-
BASED
REGULATION
SONIA AGGARWAL
NATIONAL GOVERNORS’ ASSOCIATION
JULY 28, 2015
2WWW.AMERICASPOWERPLAN.COM
3
1.WHY
2.HOW
3.EXAMPLES
4.NEXT STEPS
4
THE POWER SECTOR HAS EVOLVED
Old Goals:
 Meet growing demand
 Build new infrastructure
 Build to deliver universal service
 Affordability, reliability, safety
Old Options:
 Centralized power plants
 Transmission lines
 Distribution system
COST OF SERVICE REGULATION
5
THE POWER SECTOR HAS EVOLVED
Old Goals:
 Meet growing demand
 Build new infrastructure
 Build to deliver universal service
 Affordability, reliability, safety
Old Options:
 Centralized power plants
 Transmission lines
 Distribution system
New Goals:
 Build  Maintain
 Reliability  Resilience
 Clean power
 Customer satisfaction
 Affordability, safety
New Options:
 All the old stuff, plus:
 Innovative distributed energy
resources (EE, DR, PV, EVs, etc.)
 Advanced IT
COST OF SERVICE REGULATION PERFORMANCE-BASED REGULATION
6
COST OF SERVICE REGULATION
 Utilities spend prudently to maintain and operate the
power system
 Utilities recover capital expenses plus a rate of return
 Operational expenses are recovered at no risk to the
utility
 This incents capital investments and sales volume
 A great structure for 20th century goals
(meet growing demand, build new infrastructure, build
universal service)
7
NEW GOALS FOR THE POWER SYSTEM
Resilient
Affordable, Safe
Clean
Customer-oriented
8
ALIGN FINANCIAL INCENTIVES OF:
Utilities
Customers
Independent Power Producers
3rd party service providers
$
Resilient
Affordable, Safe
Clean
WITH THESE GOALS:
PERFORMANCE-BASED REGULATION CAN
ALIGN FINANCIAL INCENTIVES
Customer-oriented
9
PERFORMANCE-BASED REGULATION
Works (for the residual
monopoly) in both
vertically-integrated &
restructured markets!
10
From: “Did we pay the right amount for
what we got?”
To: “Are we paying (the right amount)
for what we want?”
Utility and
Regulatory
Models for the
Modern Era
by Ron Lehr
PBR changes the central question…
PERFORMANCE-BASED REGULATION
11
1.WHY
2.HOW
3.EXAMPLES
4.NEXT STEPS
12
COST OF SERVICE REGULATION, SIMPLIFIED
Revenue = Operating Costs +
(Capital Costs) * ROR
…As utility
investment
increases
Revenue
increases…
(Rate of Return)
13
Revenue = Operating Costs +
(Capital Costs) * ROR
ELEMENTS OF COST OF SERVICE EQUATION
Often recovered at
no risk to the utility
Reviewed by regulators for
prudence and public interest
Greatest opportunity
for affecting overall
shareholder value
creation
14
Regulators
Set quantitative
performance
goals
Establish reward
& penalty
structure
Utilities
Meet goals
Receive rewards
and/or penalties
 Reliable service
 Customer satisfaction
 Equity
 Innovative third-party
services
 System-wide least cost
 Resource diversity
 Effective facilitation of
open access
 Reliability
 Innovation
Retail Level, e.g.:
Wholesale Level, e.g.:
OutcomesPolicymakers
Establish policy
priorities
Work with
regulators
POLICY SOLUTION
PERFORMANCE-BASED REGULATION Already a
standards
driven
industry
15
Revenue = Operating Costs +
(Capital Costs) * ROR
PERFORMANCE-BASED REGULATION,
SIMPLIFIED
± Performance
…As utility
investment
increases
performance
improves
Closer to the
cost of capital
Revenue
increases…
16
MOVING FROM COST OF SERVICE TO
PERFORMANCE-BASED REGULATION
Opex
(including
depreciation
& taxes)
Opex
(including
depreciation
& taxes)
ROR ROR
Revenue
Incentives available
for value-creating
activities*
ILLUSTRATIVE
Traditional Model
value derived from all
investment activities
Performance Value Model
value derived from both
investments and performance
*Overall costs may actually
decrease; but potential returns
to shareholders should grow
commensurate with the
additional risk shifted to utilities
17
1. Return on Equity (ROE) Adjustments:
 Basis point adjustments applying to the whole ratebase
 e.g. IL, UK
 Incentive ROE for projects that meet performance criteria
 e.g. CA: nuclear performance
DELIVERING THE INCENTIVE
TWO METHODS
* Shares may change over time
2. “Direct incentives”
 Shared savings / shared profits*
 e.g. CO: Xcel off-system sales
 Shareholder incentive mechanisms
 e.g. CA: efficiency performance
PREFERRED
18
1. Work with stakeholders to
clearly define goals and
outcomes in quantitative
terms.
2. Include incentives for
exceptional performance and
penalties for missing the
standard.
PRINCIPLES FOR DESIGNING
PERFORMANCE-BASED REGULATION
3. Use a transparent and consistent
methodology for measuring
performance. Define it clearly at the
outset of the program.
19
PRINCIPLES FOR DESIGNING
PERFORMANCE-BASED REGULATION
4. Shift an appropriate amount of performance risk to the utility in
exchange for longer-term regulatory certainty and the opportunity to earn
incentive compensation. Reward entrepreneurialism.
5. Establish a long enough time horizon for the utility and third-parties to
make investment decisions with certainty, and to innovate to meet
performance targets.
PLANNING TIME HORIZON
MONTHS YEARS DECADES
20
PRINCIPLES FOR DESIGNING
PERFORMANCE-BASED REGULATION
6. Consider revenue sharing to align utility performance with customer
benefits.
7. Build on the existing framework, but look for holistic solutions that go
far enough to truly align incentives and simplify the regulatory process.
8. Consider provisions for mid-course correction—any changes should be
announced well in advance of implementation to minimize uncertainty.
21
1.WHY
2.HOW
3.EXAMPLES
4.NEXT STEPS
22
EXAMPLE 1 OF 2: FIRST STEPS
 O.38% of total utility revenue at stake
 Penalty-only structure
 Three primary output categories tied to revenue, more being tracked:
1. Reliability
2. Reduction of system uncertainty
3. Affordability
 Performance targets set for 10 years, assessed annually, with
increasing stakes
 Incentive delivery: ROE adjustments to all cap expenditures
Illinois
23
EXAMPLE 2 OF 2:
GOING (A LOT) FURTHER
 3% of total utility revenue at stake
 Penalties and rewards offered
 Six primary output categories tied to revenue:
1) customer satisfaction, 2) reliability and availability, 3) safe
network services, 4) connection terms, 5) environmental
impact, 6) social obligations
 Eight years to adapt and perform, opportunity to review
at year 4
 Incentive delivery: ROE adjustments applied to all capital
and operational expenditures
United Kingdom
“Utility investors agree
RIIO is a paradigm of
success.”
Julien Dumoulin-Smith, UBS
24
1.WHY
2.HOW
3.EXAMPLES
4.NEXT STEPS
25
NEXT STEPS TO CONSIDER
1. Agree on top goals for the state’s power sector. What value can
utilities deliver to citizens and customers?
2. Identify appropriate quantitative performance metrics under
each goal. Work with the Commission to establish a transparent
methodology for calculating performance on each metric.
3. Begin to measure and track performance. Support pilots.
4. Grow the share of utility revenue tied to performance once the
metrics and methodologies are well understood.
26
THANK YOU
@USPOWERPLAN
@ENERGYINNOVLLC
WWW.AMERICASPOWERPLAN.COM
WWW.ENERGYINNOVATION.ORG

Performance-Based Regulation

  • 1.
  • 2.
  • 3.
  • 4.
    4 THE POWER SECTORHAS EVOLVED Old Goals:  Meet growing demand  Build new infrastructure  Build to deliver universal service  Affordability, reliability, safety Old Options:  Centralized power plants  Transmission lines  Distribution system COST OF SERVICE REGULATION
  • 5.
    5 THE POWER SECTORHAS EVOLVED Old Goals:  Meet growing demand  Build new infrastructure  Build to deliver universal service  Affordability, reliability, safety Old Options:  Centralized power plants  Transmission lines  Distribution system New Goals:  Build  Maintain  Reliability  Resilience  Clean power  Customer satisfaction  Affordability, safety New Options:  All the old stuff, plus:  Innovative distributed energy resources (EE, DR, PV, EVs, etc.)  Advanced IT COST OF SERVICE REGULATION PERFORMANCE-BASED REGULATION
  • 6.
    6 COST OF SERVICEREGULATION  Utilities spend prudently to maintain and operate the power system  Utilities recover capital expenses plus a rate of return  Operational expenses are recovered at no risk to the utility  This incents capital investments and sales volume  A great structure for 20th century goals (meet growing demand, build new infrastructure, build universal service)
  • 7.
    7 NEW GOALS FORTHE POWER SYSTEM Resilient Affordable, Safe Clean Customer-oriented
  • 8.
    8 ALIGN FINANCIAL INCENTIVESOF: Utilities Customers Independent Power Producers 3rd party service providers $ Resilient Affordable, Safe Clean WITH THESE GOALS: PERFORMANCE-BASED REGULATION CAN ALIGN FINANCIAL INCENTIVES Customer-oriented
  • 9.
    9 PERFORMANCE-BASED REGULATION Works (forthe residual monopoly) in both vertically-integrated & restructured markets!
  • 10.
    10 From: “Did wepay the right amount for what we got?” To: “Are we paying (the right amount) for what we want?” Utility and Regulatory Models for the Modern Era by Ron Lehr PBR changes the central question… PERFORMANCE-BASED REGULATION
  • 11.
  • 12.
    12 COST OF SERVICEREGULATION, SIMPLIFIED Revenue = Operating Costs + (Capital Costs) * ROR …As utility investment increases Revenue increases… (Rate of Return)
  • 13.
    13 Revenue = OperatingCosts + (Capital Costs) * ROR ELEMENTS OF COST OF SERVICE EQUATION Often recovered at no risk to the utility Reviewed by regulators for prudence and public interest Greatest opportunity for affecting overall shareholder value creation
  • 14.
    14 Regulators Set quantitative performance goals Establish reward &penalty structure Utilities Meet goals Receive rewards and/or penalties  Reliable service  Customer satisfaction  Equity  Innovative third-party services  System-wide least cost  Resource diversity  Effective facilitation of open access  Reliability  Innovation Retail Level, e.g.: Wholesale Level, e.g.: OutcomesPolicymakers Establish policy priorities Work with regulators POLICY SOLUTION PERFORMANCE-BASED REGULATION Already a standards driven industry
  • 15.
    15 Revenue = OperatingCosts + (Capital Costs) * ROR PERFORMANCE-BASED REGULATION, SIMPLIFIED ± Performance …As utility investment increases performance improves Closer to the cost of capital Revenue increases…
  • 16.
    16 MOVING FROM COSTOF SERVICE TO PERFORMANCE-BASED REGULATION Opex (including depreciation & taxes) Opex (including depreciation & taxes) ROR ROR Revenue Incentives available for value-creating activities* ILLUSTRATIVE Traditional Model value derived from all investment activities Performance Value Model value derived from both investments and performance *Overall costs may actually decrease; but potential returns to shareholders should grow commensurate with the additional risk shifted to utilities
  • 17.
    17 1. Return onEquity (ROE) Adjustments:  Basis point adjustments applying to the whole ratebase  e.g. IL, UK  Incentive ROE for projects that meet performance criteria  e.g. CA: nuclear performance DELIVERING THE INCENTIVE TWO METHODS * Shares may change over time 2. “Direct incentives”  Shared savings / shared profits*  e.g. CO: Xcel off-system sales  Shareholder incentive mechanisms  e.g. CA: efficiency performance PREFERRED
  • 18.
    18 1. Work withstakeholders to clearly define goals and outcomes in quantitative terms. 2. Include incentives for exceptional performance and penalties for missing the standard. PRINCIPLES FOR DESIGNING PERFORMANCE-BASED REGULATION 3. Use a transparent and consistent methodology for measuring performance. Define it clearly at the outset of the program.
  • 19.
    19 PRINCIPLES FOR DESIGNING PERFORMANCE-BASEDREGULATION 4. Shift an appropriate amount of performance risk to the utility in exchange for longer-term regulatory certainty and the opportunity to earn incentive compensation. Reward entrepreneurialism. 5. Establish a long enough time horizon for the utility and third-parties to make investment decisions with certainty, and to innovate to meet performance targets. PLANNING TIME HORIZON MONTHS YEARS DECADES
  • 20.
    20 PRINCIPLES FOR DESIGNING PERFORMANCE-BASEDREGULATION 6. Consider revenue sharing to align utility performance with customer benefits. 7. Build on the existing framework, but look for holistic solutions that go far enough to truly align incentives and simplify the regulatory process. 8. Consider provisions for mid-course correction—any changes should be announced well in advance of implementation to minimize uncertainty.
  • 21.
  • 22.
    22 EXAMPLE 1 OF2: FIRST STEPS  O.38% of total utility revenue at stake  Penalty-only structure  Three primary output categories tied to revenue, more being tracked: 1. Reliability 2. Reduction of system uncertainty 3. Affordability  Performance targets set for 10 years, assessed annually, with increasing stakes  Incentive delivery: ROE adjustments to all cap expenditures Illinois
  • 23.
    23 EXAMPLE 2 OF2: GOING (A LOT) FURTHER  3% of total utility revenue at stake  Penalties and rewards offered  Six primary output categories tied to revenue: 1) customer satisfaction, 2) reliability and availability, 3) safe network services, 4) connection terms, 5) environmental impact, 6) social obligations  Eight years to adapt and perform, opportunity to review at year 4  Incentive delivery: ROE adjustments applied to all capital and operational expenditures United Kingdom “Utility investors agree RIIO is a paradigm of success.” Julien Dumoulin-Smith, UBS
  • 24.
  • 25.
    25 NEXT STEPS TOCONSIDER 1. Agree on top goals for the state’s power sector. What value can utilities deliver to citizens and customers? 2. Identify appropriate quantitative performance metrics under each goal. Work with the Commission to establish a transparent methodology for calculating performance on each metric. 3. Begin to measure and track performance. Support pilots. 4. Grow the share of utility revenue tied to performance once the metrics and methodologies are well understood.
  • 26.

Editor's Notes

  • #7 Note here: every regulatory structure has embedded incentives. Why don’t we directly incent what we want?
  • #10 Here we focus on the part of the system owned and operated by IOUs though
  • #13 Revisiting the previous slide…
  • #19 Define goals and outcomes. Then, set a quantitative standard for performance; include incentives for exceptional performance and penalties for missing the standard. A clear methodology for measuring performance and a counterfactual should be defined at the outset of the program. Simply beginning to measure performance can reveal substantial opportunities for savings. Shift an appropriate amount of performance risk to the utility, in exchange for longer-term regulatory certainty and perhaps incentive compensation. Reward entrepreneurialism. Establish a long enough time horizon for the utility and third-parties to make investment decisions with certainty and innovate to meet performance targets.
  • #20 Define goals and outcomes. Then, set a quantitative standard for performance; include incentives for exceptional performance and penalties for missing the standard. A clear methodology for measuring performance and a counterfactual should be defined at the outset of the program. Simply beginning to measure performance can reveal substantial opportunities for savings. Shift an appropriate amount of performance risk to the utility, in exchange for longer-term regulatory certainty and perhaps incentive compensation. Reward entrepreneurialism. Establish a long enough time horizon for the utility and third-parties to make investment decisions with certainty and innovate to meet performance targets.
  • #21 Define goals and outcomes. Then, set a quantitative standard for performance; include incentives for exceptional performance and penalties for missing the standard. A clear methodology for measuring performance and a counterfactual should be defined at the outset of the program. Simply beginning to measure performance can reveal substantial opportunities for savings. Shift an appropriate amount of performance risk to the utility, in exchange for longer-term regulatory certainty and perhaps incentive compensation. Reward entrepreneurialism. Establish a long enough time horizon for the utility and third-parties to make investment decisions with certainty and innovate to meet performance targets.