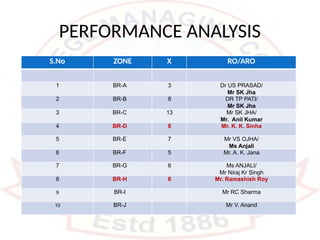
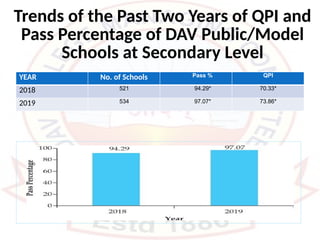
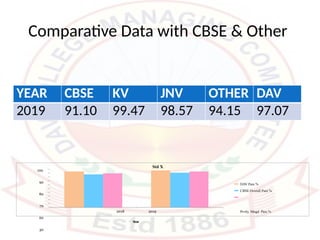
TWO DAYS WORKSHOP FOR MIDDLE & SECONDARY LEVEL
(Social Science)
RTC BIHAR ZONE – E, Gaya Cluster
ANNUAL TRAINING PROGRAMME 2022-23
(Under the aegis of DAVCAE, DAV CMC, New Delhi)
Theme – “Capacity Building Programme for the Teachers of
Social Science (Secondary Level)”
Venue: D.A.V. Public School,Sherghati, Gaya(Bihar)
Date:29/12/22 – 30/12/22
The Vision
The DAV has a clear-cut vision:
• To continue expanding and exploring, locally and
globally, and be a knowledge leader and content
provider.
• To muster strategies to become a global epicenter
of knowledge, culture, skills, technology, research
and service.
• To empower women through education.
PERFORMANCE ANALYSIS
S.No ZONE X RO/ARO
1 BR-A 3 Dr US PRASAD/
Mr SK Jha
2 BR-B 8 DR TP PATI/
Mr SK Jha
3 BR-C 13 Mr SK JHA/
Mr. Anil Kumar
4 BR-D 8 Mr. K. K. Sinha
5 BR-E 7 Mr VS OJHA/
Ms Anjali
6 BR-F 5 Mr. A. K. Jana
7 BR-G 6 Ms ANJALI/
Mr Niraj Kr Singh
8 BR-H 6 Mr. Ramashish Roy
9 BR-I Mr RC Sharma
10 BR-J Mr V. Anand
Trends of the Past Two Years of QPI and
Pass Percentage of DAV Public/Model
Schools at Secondary Level
YEAR No. of Schools Pass % QPI
2018 521 94.29* 70.33*
2019 534 97.07* 73.86*
Comparative Data with CBSE & Other
YEAR CBSE KV JNV OTHER DAV
2019 91.10 99.47 98.57 94.15 97.07
Std X
100
90
80
70
60
50
DAV Pass %
CBSE Overall Pass %
Prvtly. Mngd. Pass %
2018 2019
Year
percentage advantage of DAV over CBSE
Overall and Privately Managed Schools.
Year DAV
A
CBSE
Overal
l
B
Percentage
advantage over
CBSE Overall
(A-B)
Privately
Managed
C
Percentage
Advantage
over Privately
Managed (A-C)
2018 94.29 86.70 7.59 89.49 4.80
2019 97.07 91.10 5.97 94.15 2.92
The Bihar Zone DAV Quantitative Performance Index of Std X
(DAV National Index = 97.07%)
Zone Appr Pass Fail Comp
Pass
%
Variation from
Overall DAV
Pass %
RO/ARO
BR-A 909 899 0 10 98.90 1.83
BR-B 1873 1845 0 28 98.51 1.44
BR-C 2751 2699 0 52 98.11 1.04
BR-D 1142 1122 1 19 98.25 1.18
BR-E 2074 1910 11 153 92.09 -4.98
BR-F 998 947 2 49 94.89 -2.18
BR-G 975 953 0 22 97.74 0.67
BR-H 1616 1592 1 23 98.51 1.44
The Bihar Zone DAV Quantitative Performance Index of Std X
(DAV National Index = 97.07%)
Sr.
No.
Zone Total
Schools
QUALITATIVE PERFORMANCE INDEX OF SCHOOLS
QPI
of the
Zone
Regional
Officer/
Assistant
Regional
Officer
<60
60 to
<70
70 to
<75
75 to
<80
80 to
<85 >85
Needs
Improve-
ment
Satis-
factory Good
Very
Good
Out-
stan-
ding
Star
Perfor-
mer
11 BR-A 3 0 0 1 2 0 0 76.42 Mr SK Jha
12 BR-G 6 0 0 3 2 1 0 76.26 Ms. Anjali
24 BR-H 6 0 0 5 1 0 0 73.14 Mr.
R.Ro
y
25 BR-D 8 0 1 5 2 0 0 73.03 Mr. K. K.
Sinha
28 BR-B
8
0 3 3 2 0 0 72.74 Dr. T. P.
Pati
29 BR-C 13 0 4 8 1 0 0 72.25 Mr. S. K.
Jha
45 BR-E 6 0 4 1 1 0 0 69.36 Dr. V. S.
Ojha
48 BR-F 5 0 5 0 0 0 0 68.01 Mr. A. K.
Jana
1 OR-B 0 0 0 2 2 4 86.90 Dr. K.
Subject-wise Analysis at Secondary (Std X)
Level (Social Science)
Eng. Lit.
& Lang.
Hindi
A
Hindi
B
Comm.
Sanskrit Maths Science
Social
Science
Info.
Tech.
DAV
QPI
74.92 77.88 82.08 84.17 67.88 67.63 75.54 57.82
BR-A 78.85 -- -- 88.98 84.41 67.47 71.76 76.81
BR-B 73.15 79.09 -- 80.63 66.03 67.57 77.36 61.96
BR-C 72.04 83.10 69.00 83.64 65.12 66.37 74.23 62.03
BR-D 73.09 84.18 74.00 83.86 64.68 66.65 76.85 52.60
BR-E 71.55 77.27 83.47 81.61 59.41 63.11 72.36 55.86
BR-F 70.80 77.43 46.00 77.47 59.61 61.99 70.36 54.62
BR-G 79.74 81.28 -- 83.45 70.05 70.51 78.50 --
BR-H 73.90 83.40 90.44 82.66 67.25 66.21 75.21 66.00
‘Pride of DAV’
Rank
School Code
Name of the
School
QPI Zone Principal
I 6863
DAV Pune
Maharashtra 86.78 MH-B Mrs. C.V.
Madhavi
II 6821
DAV Thane
Maharashtra 86.56 MH-B Mrs. Simmi
Juneja
III 8380
DAV Cuttack
Odisha 81.91 OR-C Mrs. Namita
Mohanty
Qualitative Analysis at Secondary Level (Std
X)
year Total
No. of
Schoo
ls
Number of Schools in Each Category
Needs
Improvement
<55
Satisfactory 55
to <60
Good 60 to
<70
Very Good 70
to <80
Outstanding
³80
2018 521 14 37 211 161 28
2.69% 7.10% 40.50% 30.90% 5.37%
Growth Trend of Students in Std X in DAV
Public Schools
A Pie Diagram Representing the Percentage of
Schools Falling in Different Categories
LUNCH BREAK
CAUSES OF TRAILING BEHIND
IDENTIFICATION OF COMMON ERRORS
– Answers lack appropriate grammatical structure.
Tendency to exceed word limit.
– The content presentations are not up to the mark
by the students, being irrelevant or incomplete.
– In essay type questions, students are unable to
organise the content matter in a desired manner.
– Inability to comprehend application-based
questions especially, the ones in the form of
quotations.
– Poor expression due to lack of proper vocabulary.
– Wrong interpretation of questions.
IDENTIFICATION OF COMMON ERRORS
– When statistical data is given, students commit
mistakes in calculating and also forget to write the
unit of measurement.
– Incongruent in creative writing (lack of practice).
– Lack of continuity and frequent repetitions.
– Inability to deduce the meaning of unfamiliar lexical
items.
– Inefficiency in writing short answer questions precisely
due to lack of practice.
– Confusion between some (similar) behavioural verbs.
– Punctuation errors.
– Answers are not numbered in accordance with the
number of questions in the question paper.
Suggestions for improving Performance of
students(DAV CMC)
• Thorough practice to be given to study statistical
data.
• Correlation to be established with Current Affairs,
National Issues, International Issues.
• Timeline charts and handy charts should be used
while teaching History.
• Every aspect (different interpretations
/explanations) to be clarified while teaching.
• Selective study should strictly be discouraged.
Suggestions for improving Performance of
students(DAV CMC)
• Make frequent use of audio-visual aids (films,
etc.) to generate interest in Social Science.
• Model answers may be given to confusing
questions from difficult topics.
• Action words (explain, compare, trace, etc.)
should be clearly explained to students.
• Causes and consequences to be explained
with examples.
Suggestions for improving Performance of
students(DAV CMC)
• More practice to be provided for application-based
questions.
• Chapters having more weightage should be given more
time. While managing the content, the teachers should
be able to grade it.
• Practice should be given in graph reading and graph
making.
• Practice to be given to read and interpret the diagrams.
• Sufficient practice to be given in map work (using
outline maps). Map filling indicating symbols,
Suggestions for improving Performance of
students(DAV CMC)
• proper index and also studying different kinds of maps
to be practiced.
• Classrooms can become lively by involving the children
in interactive activities. Group Discussions and Project
Methods to be organised to teach difficult concepts.
• Visit to relevant places (Historical monuments,
Museums, Parliament, Planetarium, etc.) can facilitate
conceptual clarity in the students.
• Exposing the students to contemporary leaders of
repute (interview, etc.) can facilitate conceptual clarity
in the students.

PERFORMANCE ANALYSIS of DAV SCHOOLS .pptx

  • 1.
    TWO DAYS WORKSHOPFOR MIDDLE & SECONDARY LEVEL (Social Science) RTC BIHAR ZONE – E, Gaya Cluster ANNUAL TRAINING PROGRAMME 2022-23 (Under the aegis of DAVCAE, DAV CMC, New Delhi) Theme – “Capacity Building Programme for the Teachers of Social Science (Secondary Level)” Venue: D.A.V. Public School,Sherghati, Gaya(Bihar) Date:29/12/22 – 30/12/22
  • 2.
    The Vision The DAVhas a clear-cut vision: • To continue expanding and exploring, locally and globally, and be a knowledge leader and content provider. • To muster strategies to become a global epicenter of knowledge, culture, skills, technology, research and service. • To empower women through education.
  • 3.
    PERFORMANCE ANALYSIS S.No ZONEX RO/ARO 1 BR-A 3 Dr US PRASAD/ Mr SK Jha 2 BR-B 8 DR TP PATI/ Mr SK Jha 3 BR-C 13 Mr SK JHA/ Mr. Anil Kumar 4 BR-D 8 Mr. K. K. Sinha 5 BR-E 7 Mr VS OJHA/ Ms Anjali 6 BR-F 5 Mr. A. K. Jana 7 BR-G 6 Ms ANJALI/ Mr Niraj Kr Singh 8 BR-H 6 Mr. Ramashish Roy 9 BR-I Mr RC Sharma 10 BR-J Mr V. Anand
  • 4.
    Trends of thePast Two Years of QPI and Pass Percentage of DAV Public/Model Schools at Secondary Level YEAR No. of Schools Pass % QPI 2018 521 94.29* 70.33* 2019 534 97.07* 73.86*
  • 5.
    Comparative Data withCBSE & Other YEAR CBSE KV JNV OTHER DAV 2019 91.10 99.47 98.57 94.15 97.07 Std X 100 90 80 70 60 50 DAV Pass % CBSE Overall Pass % Prvtly. Mngd. Pass % 2018 2019 Year
  • 6.
    percentage advantage ofDAV over CBSE Overall and Privately Managed Schools. Year DAV A CBSE Overal l B Percentage advantage over CBSE Overall (A-B) Privately Managed C Percentage Advantage over Privately Managed (A-C) 2018 94.29 86.70 7.59 89.49 4.80 2019 97.07 91.10 5.97 94.15 2.92
  • 7.
    The Bihar ZoneDAV Quantitative Performance Index of Std X (DAV National Index = 97.07%) Zone Appr Pass Fail Comp Pass % Variation from Overall DAV Pass % RO/ARO BR-A 909 899 0 10 98.90 1.83 BR-B 1873 1845 0 28 98.51 1.44 BR-C 2751 2699 0 52 98.11 1.04 BR-D 1142 1122 1 19 98.25 1.18 BR-E 2074 1910 11 153 92.09 -4.98 BR-F 998 947 2 49 94.89 -2.18 BR-G 975 953 0 22 97.74 0.67 BR-H 1616 1592 1 23 98.51 1.44
  • 8.
    The Bihar ZoneDAV Quantitative Performance Index of Std X (DAV National Index = 97.07%) Sr. No. Zone Total Schools QUALITATIVE PERFORMANCE INDEX OF SCHOOLS QPI of the Zone Regional Officer/ Assistant Regional Officer <60 60 to <70 70 to <75 75 to <80 80 to <85 >85 Needs Improve- ment Satis- factory Good Very Good Out- stan- ding Star Perfor- mer 11 BR-A 3 0 0 1 2 0 0 76.42 Mr SK Jha 12 BR-G 6 0 0 3 2 1 0 76.26 Ms. Anjali 24 BR-H 6 0 0 5 1 0 0 73.14 Mr. R.Ro y 25 BR-D 8 0 1 5 2 0 0 73.03 Mr. K. K. Sinha 28 BR-B 8 0 3 3 2 0 0 72.74 Dr. T. P. Pati 29 BR-C 13 0 4 8 1 0 0 72.25 Mr. S. K. Jha 45 BR-E 6 0 4 1 1 0 0 69.36 Dr. V. S. Ojha 48 BR-F 5 0 5 0 0 0 0 68.01 Mr. A. K. Jana 1 OR-B 0 0 0 2 2 4 86.90 Dr. K.
  • 9.
    Subject-wise Analysis atSecondary (Std X) Level (Social Science) Eng. Lit. & Lang. Hindi A Hindi B Comm. Sanskrit Maths Science Social Science Info. Tech. DAV QPI 74.92 77.88 82.08 84.17 67.88 67.63 75.54 57.82 BR-A 78.85 -- -- 88.98 84.41 67.47 71.76 76.81 BR-B 73.15 79.09 -- 80.63 66.03 67.57 77.36 61.96 BR-C 72.04 83.10 69.00 83.64 65.12 66.37 74.23 62.03 BR-D 73.09 84.18 74.00 83.86 64.68 66.65 76.85 52.60 BR-E 71.55 77.27 83.47 81.61 59.41 63.11 72.36 55.86 BR-F 70.80 77.43 46.00 77.47 59.61 61.99 70.36 54.62 BR-G 79.74 81.28 -- 83.45 70.05 70.51 78.50 -- BR-H 73.90 83.40 90.44 82.66 67.25 66.21 75.21 66.00
  • 10.
    ‘Pride of DAV’ Rank SchoolCode Name of the School QPI Zone Principal I 6863 DAV Pune Maharashtra 86.78 MH-B Mrs. C.V. Madhavi II 6821 DAV Thane Maharashtra 86.56 MH-B Mrs. Simmi Juneja III 8380 DAV Cuttack Odisha 81.91 OR-C Mrs. Namita Mohanty
  • 11.
    Qualitative Analysis atSecondary Level (Std X) year Total No. of Schoo ls Number of Schools in Each Category Needs Improvement <55 Satisfactory 55 to <60 Good 60 to <70 Very Good 70 to <80 Outstanding ³80 2018 521 14 37 211 161 28 2.69% 7.10% 40.50% 30.90% 5.37%
  • 12.
    Growth Trend ofStudents in Std X in DAV Public Schools
  • 13.
    A Pie DiagramRepresenting the Percentage of Schools Falling in Different Categories
  • 14.
  • 15.
  • 16.
    IDENTIFICATION OF COMMONERRORS – Answers lack appropriate grammatical structure. Tendency to exceed word limit. – The content presentations are not up to the mark by the students, being irrelevant or incomplete. – In essay type questions, students are unable to organise the content matter in a desired manner. – Inability to comprehend application-based questions especially, the ones in the form of quotations. – Poor expression due to lack of proper vocabulary. – Wrong interpretation of questions.
  • 17.
    IDENTIFICATION OF COMMONERRORS – When statistical data is given, students commit mistakes in calculating and also forget to write the unit of measurement. – Incongruent in creative writing (lack of practice). – Lack of continuity and frequent repetitions. – Inability to deduce the meaning of unfamiliar lexical items. – Inefficiency in writing short answer questions precisely due to lack of practice. – Confusion between some (similar) behavioural verbs. – Punctuation errors. – Answers are not numbered in accordance with the number of questions in the question paper.
  • 18.
    Suggestions for improvingPerformance of students(DAV CMC) • Thorough practice to be given to study statistical data. • Correlation to be established with Current Affairs, National Issues, International Issues. • Timeline charts and handy charts should be used while teaching History. • Every aspect (different interpretations /explanations) to be clarified while teaching. • Selective study should strictly be discouraged.
  • 19.
    Suggestions for improvingPerformance of students(DAV CMC) • Make frequent use of audio-visual aids (films, etc.) to generate interest in Social Science. • Model answers may be given to confusing questions from difficult topics. • Action words (explain, compare, trace, etc.) should be clearly explained to students. • Causes and consequences to be explained with examples.
  • 20.
    Suggestions for improvingPerformance of students(DAV CMC) • More practice to be provided for application-based questions. • Chapters having more weightage should be given more time. While managing the content, the teachers should be able to grade it. • Practice should be given in graph reading and graph making. • Practice to be given to read and interpret the diagrams. • Sufficient practice to be given in map work (using outline maps). Map filling indicating symbols,
  • 21.
    Suggestions for improvingPerformance of students(DAV CMC) • proper index and also studying different kinds of maps to be practiced. • Classrooms can become lively by involving the children in interactive activities. Group Discussions and Project Methods to be organised to teach difficult concepts. • Visit to relevant places (Historical monuments, Museums, Parliament, Planetarium, etc.) can facilitate conceptual clarity in the students. • Exposing the students to contemporary leaders of repute (interview, etc.) can facilitate conceptual clarity in the students.

Editor's Notes

  • #8   This year, out of 534 Secondary schools, 18 schools are in Star Performer category, 52 schools are in Outstanding category, 87 schools are in Very Good category, 132 schools are in Good category, 146 schools are in Satisfactory category and 27 schools are in Needs Improvement category. In terms of percentage, 3.37% schools are in Star Performer category, 9.74% schools are in Outstanding category, 16.29% schools are in Very Good category, 24.72% schools are in Good category, 31.60% schools are in Satisfactory category and 5.84% schools come under the Needs Improvement category.