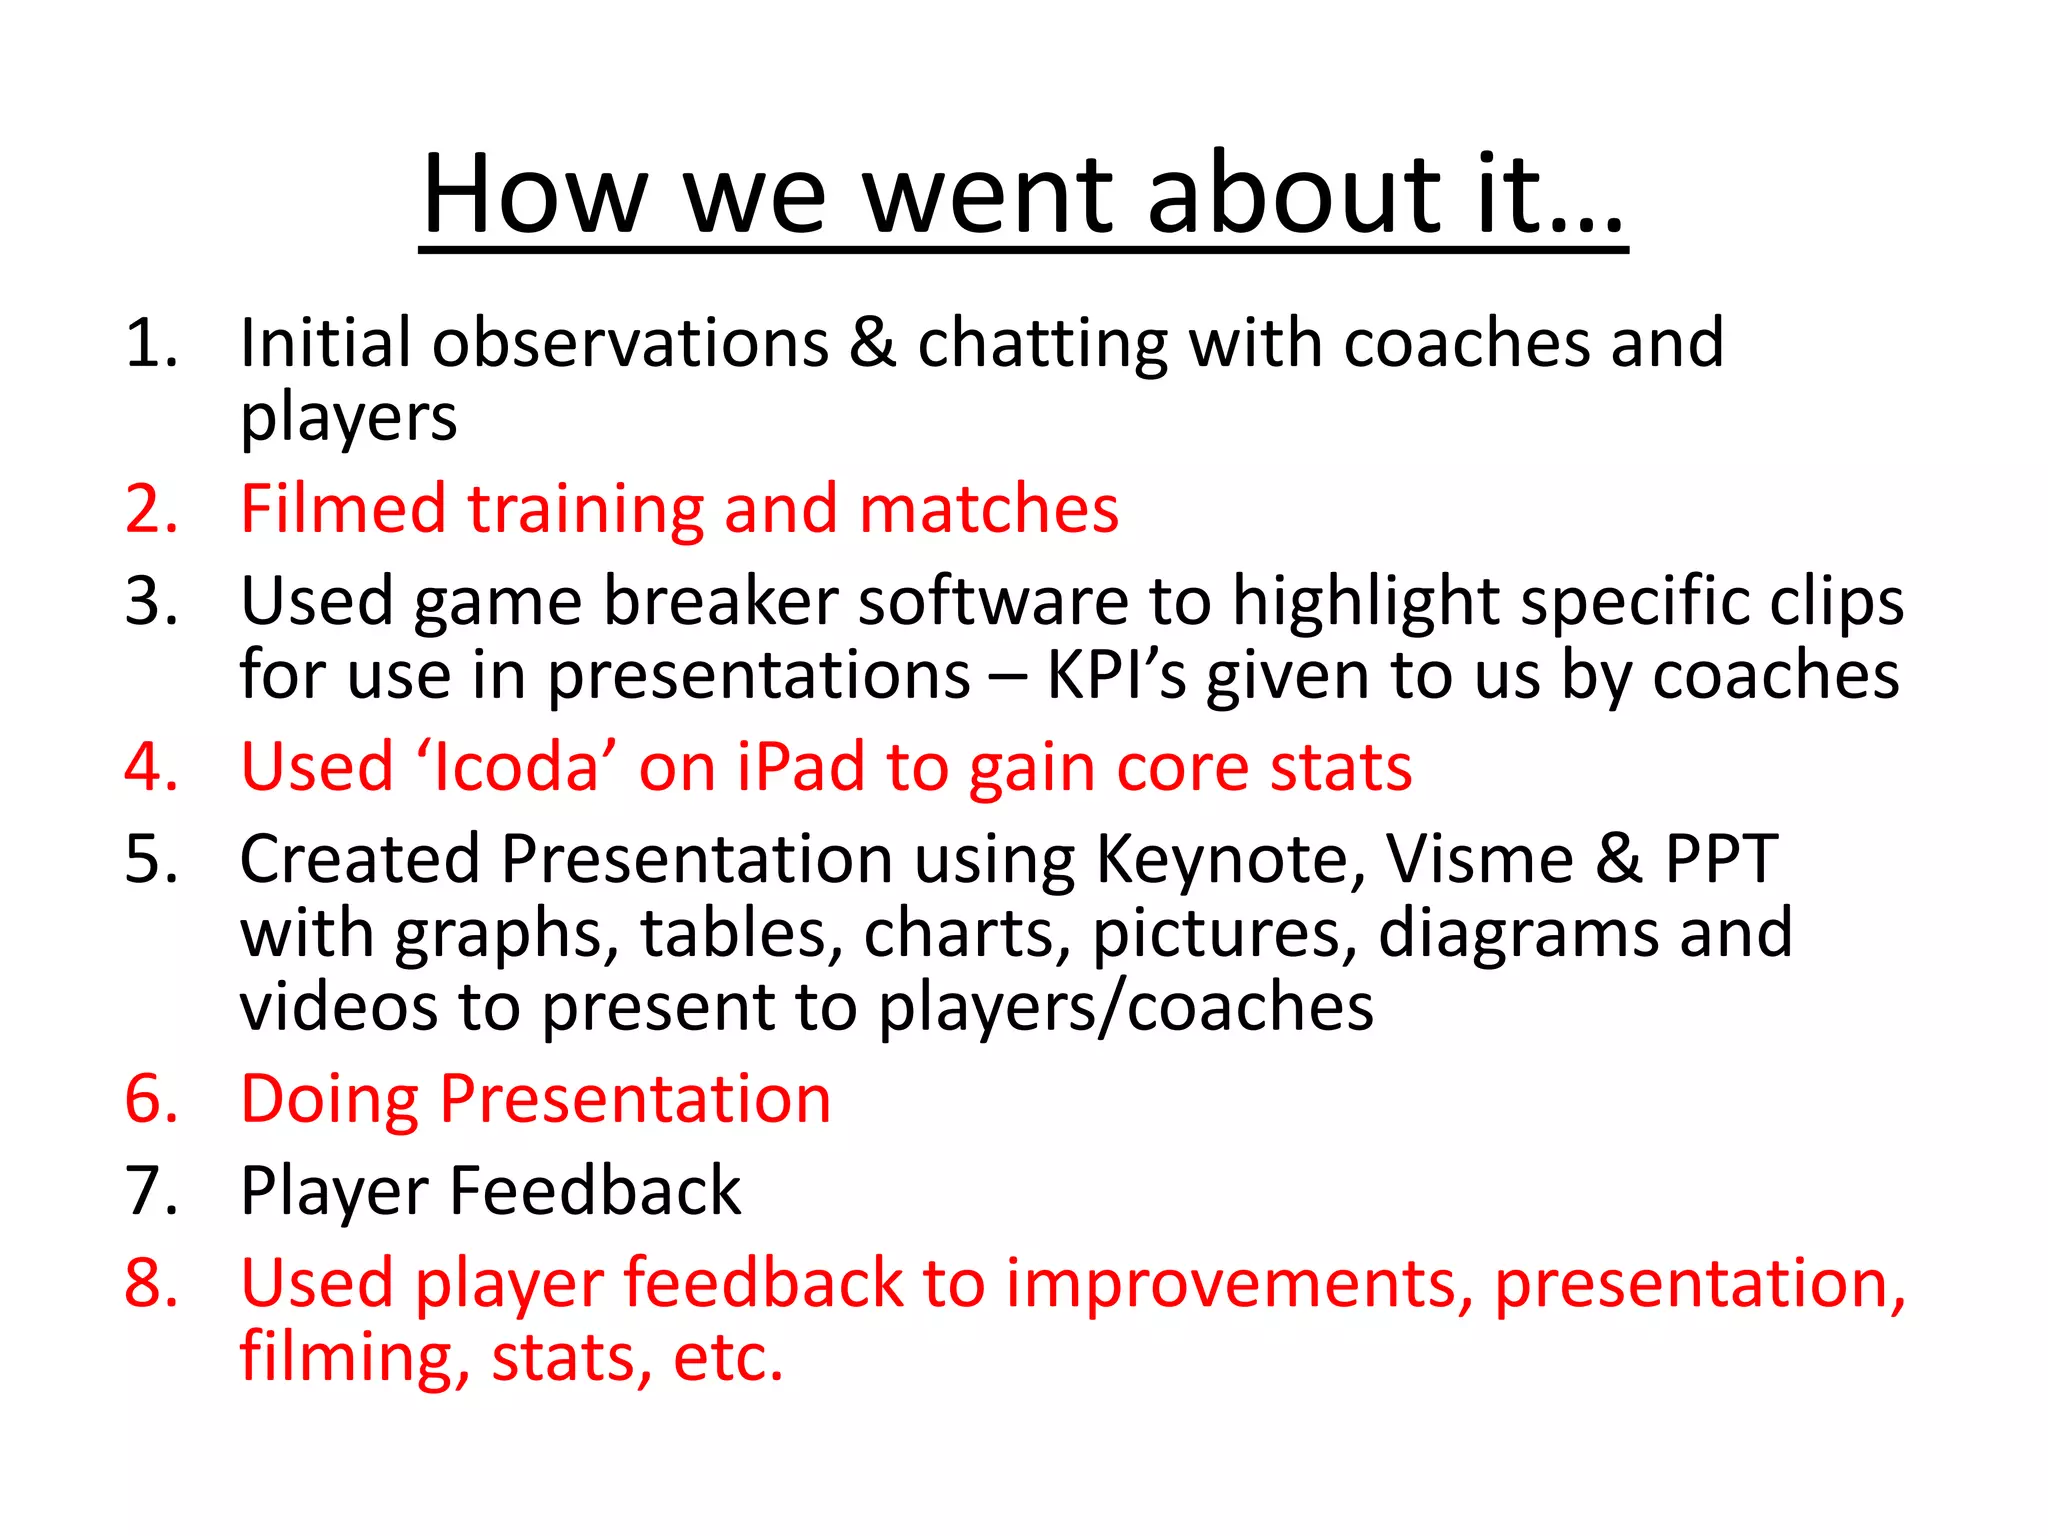
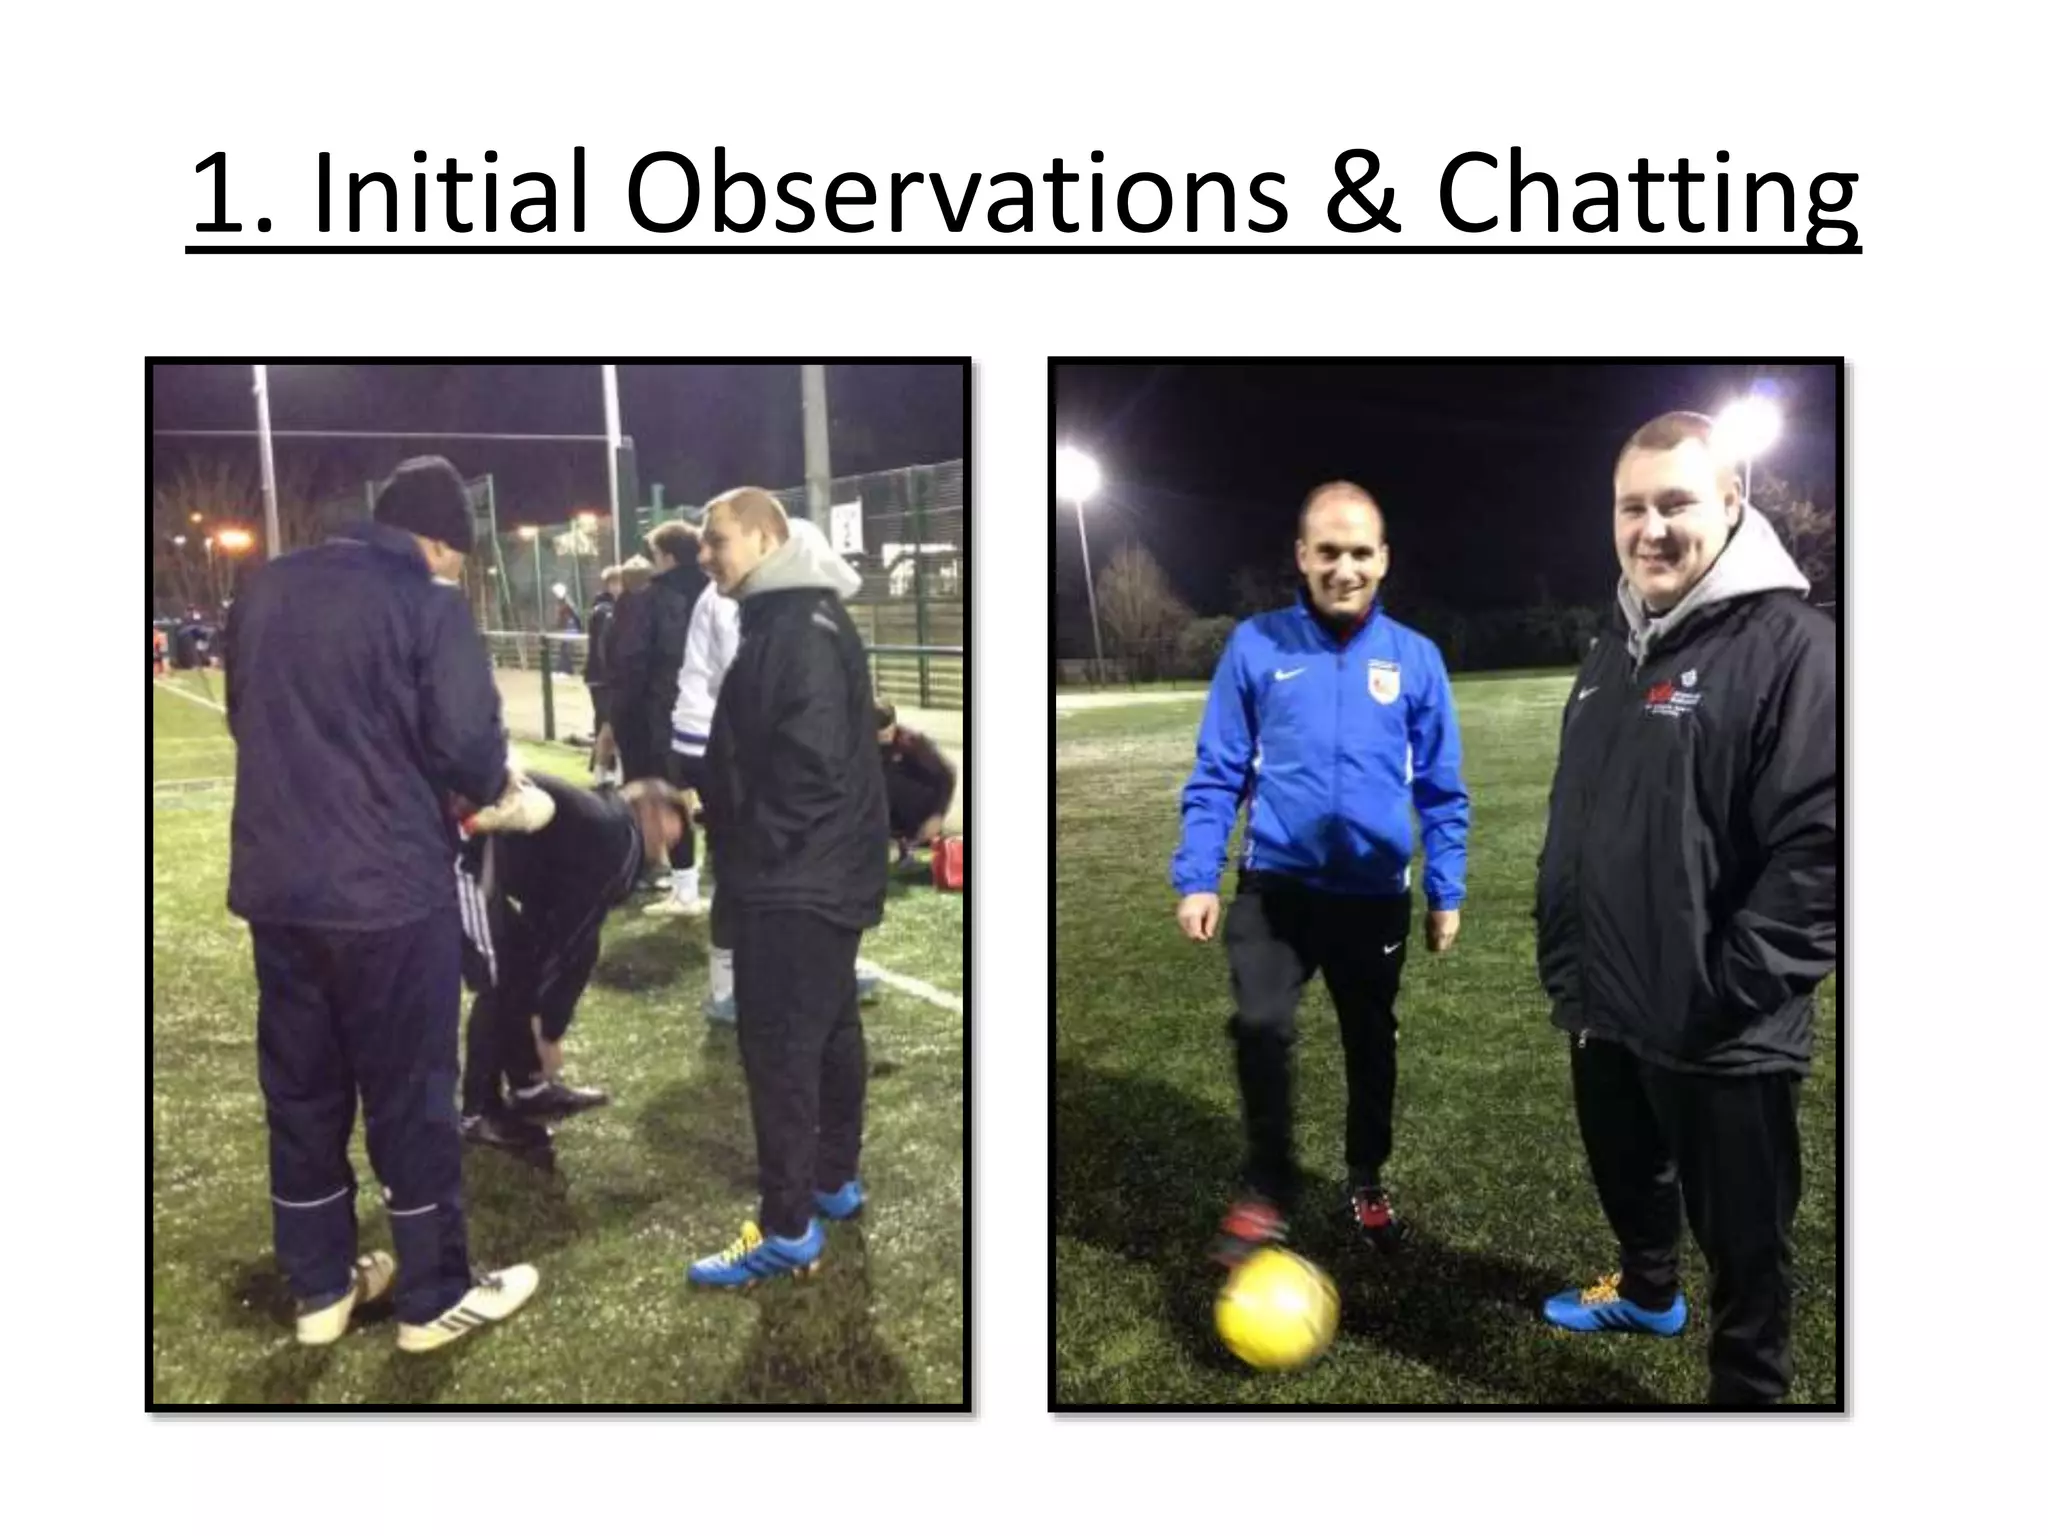
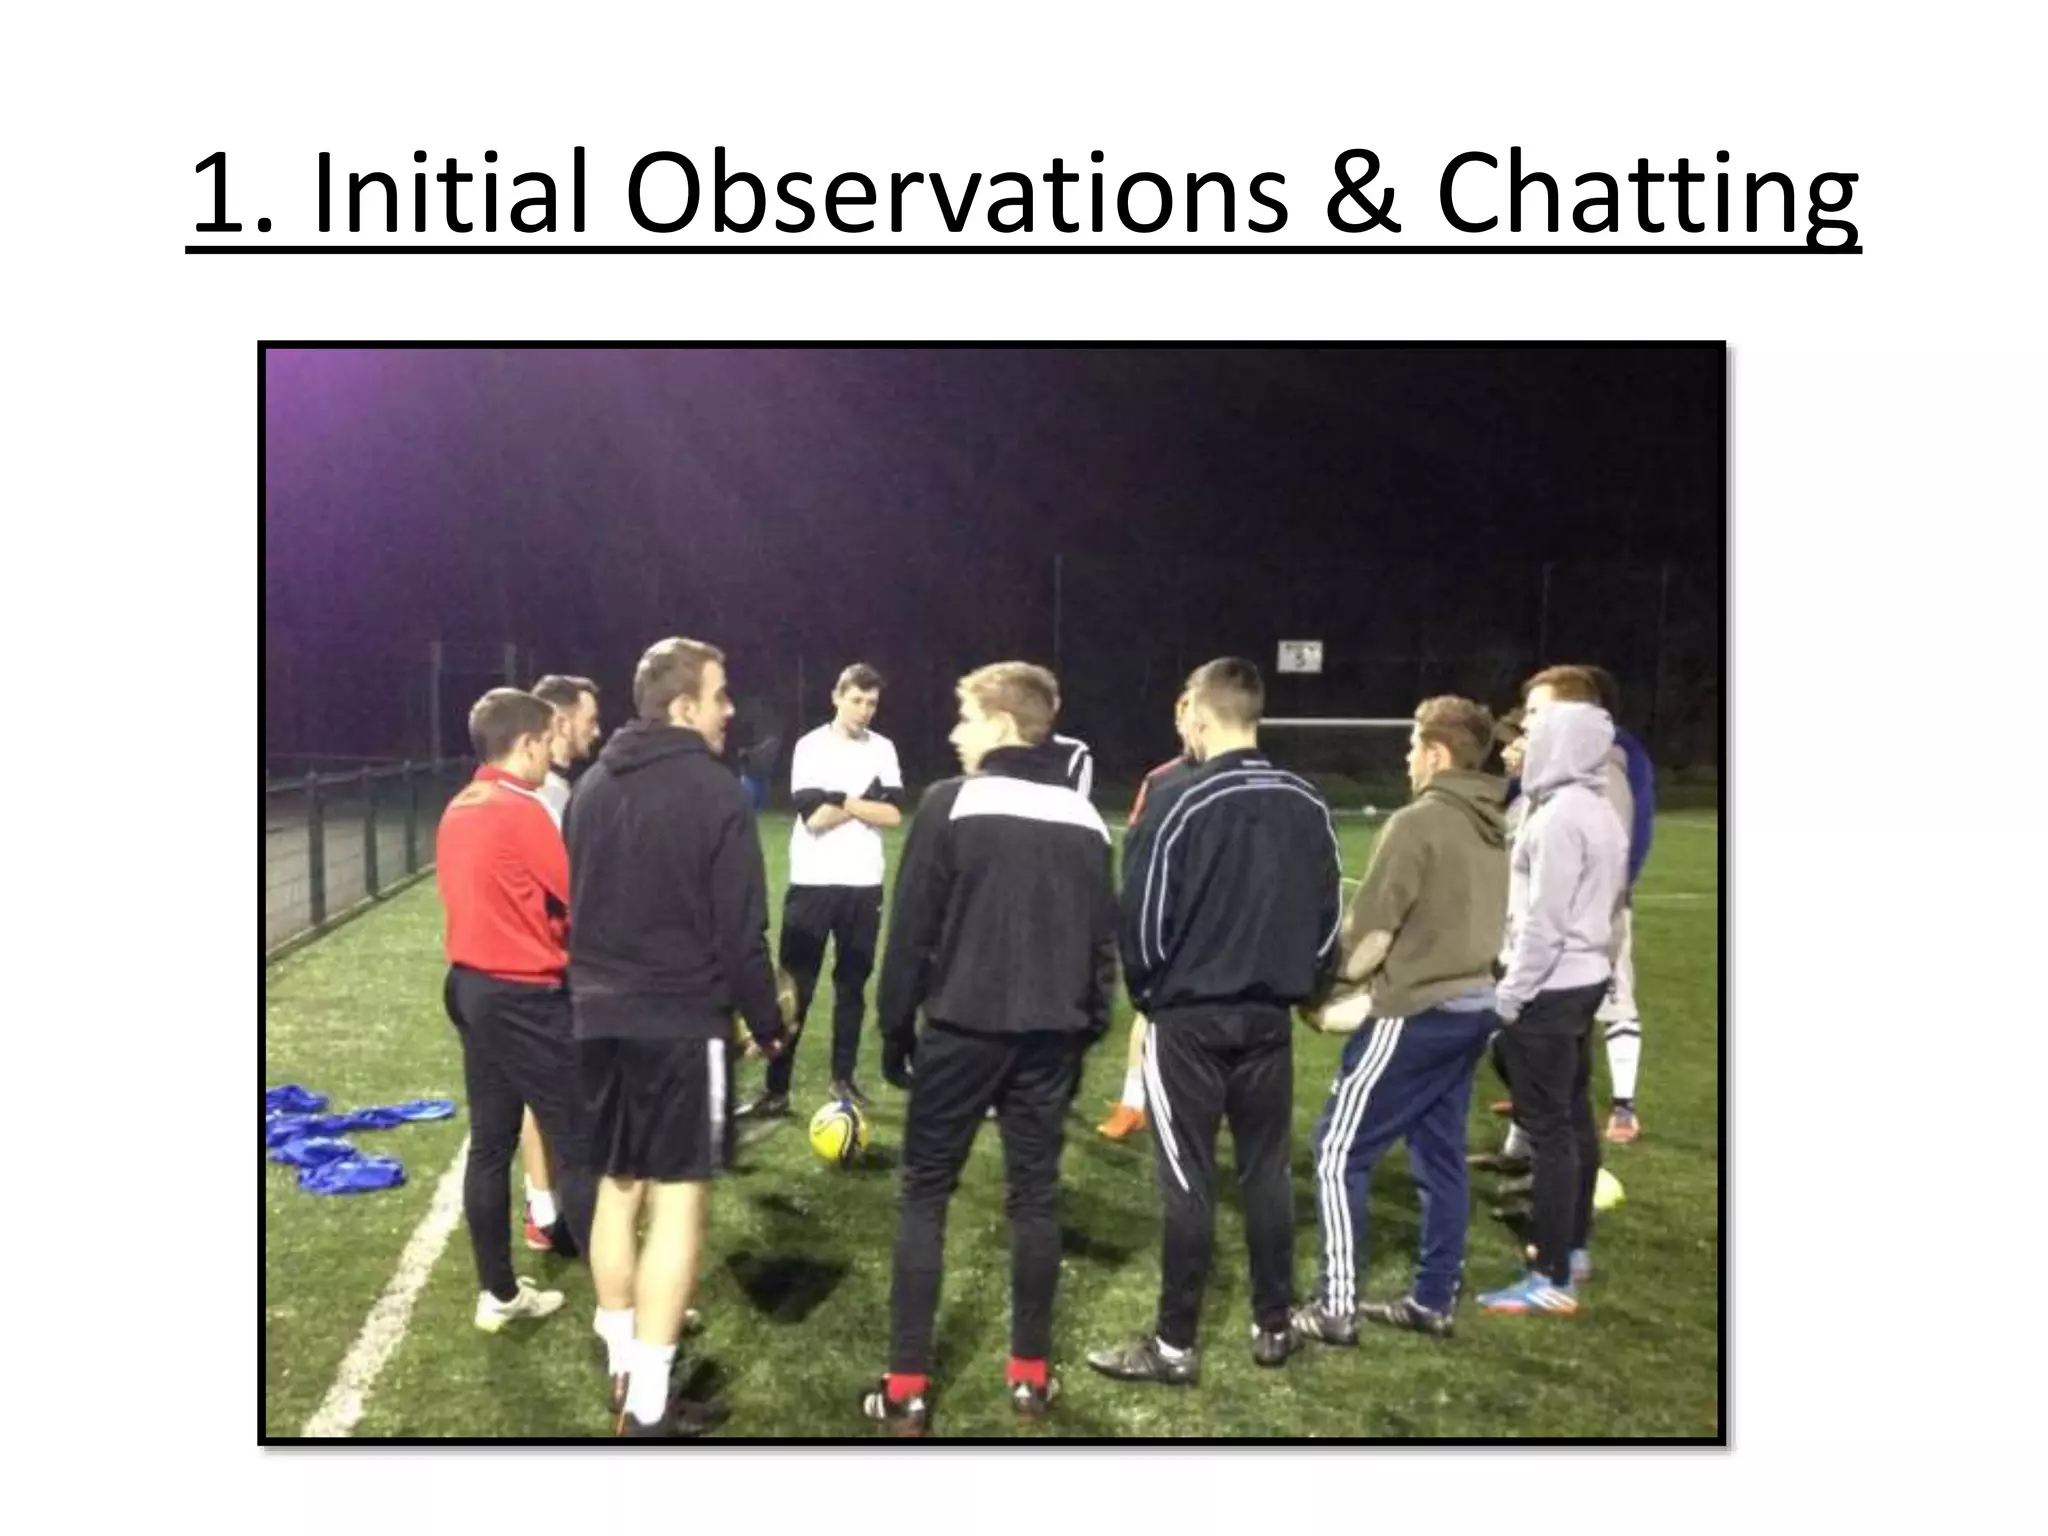
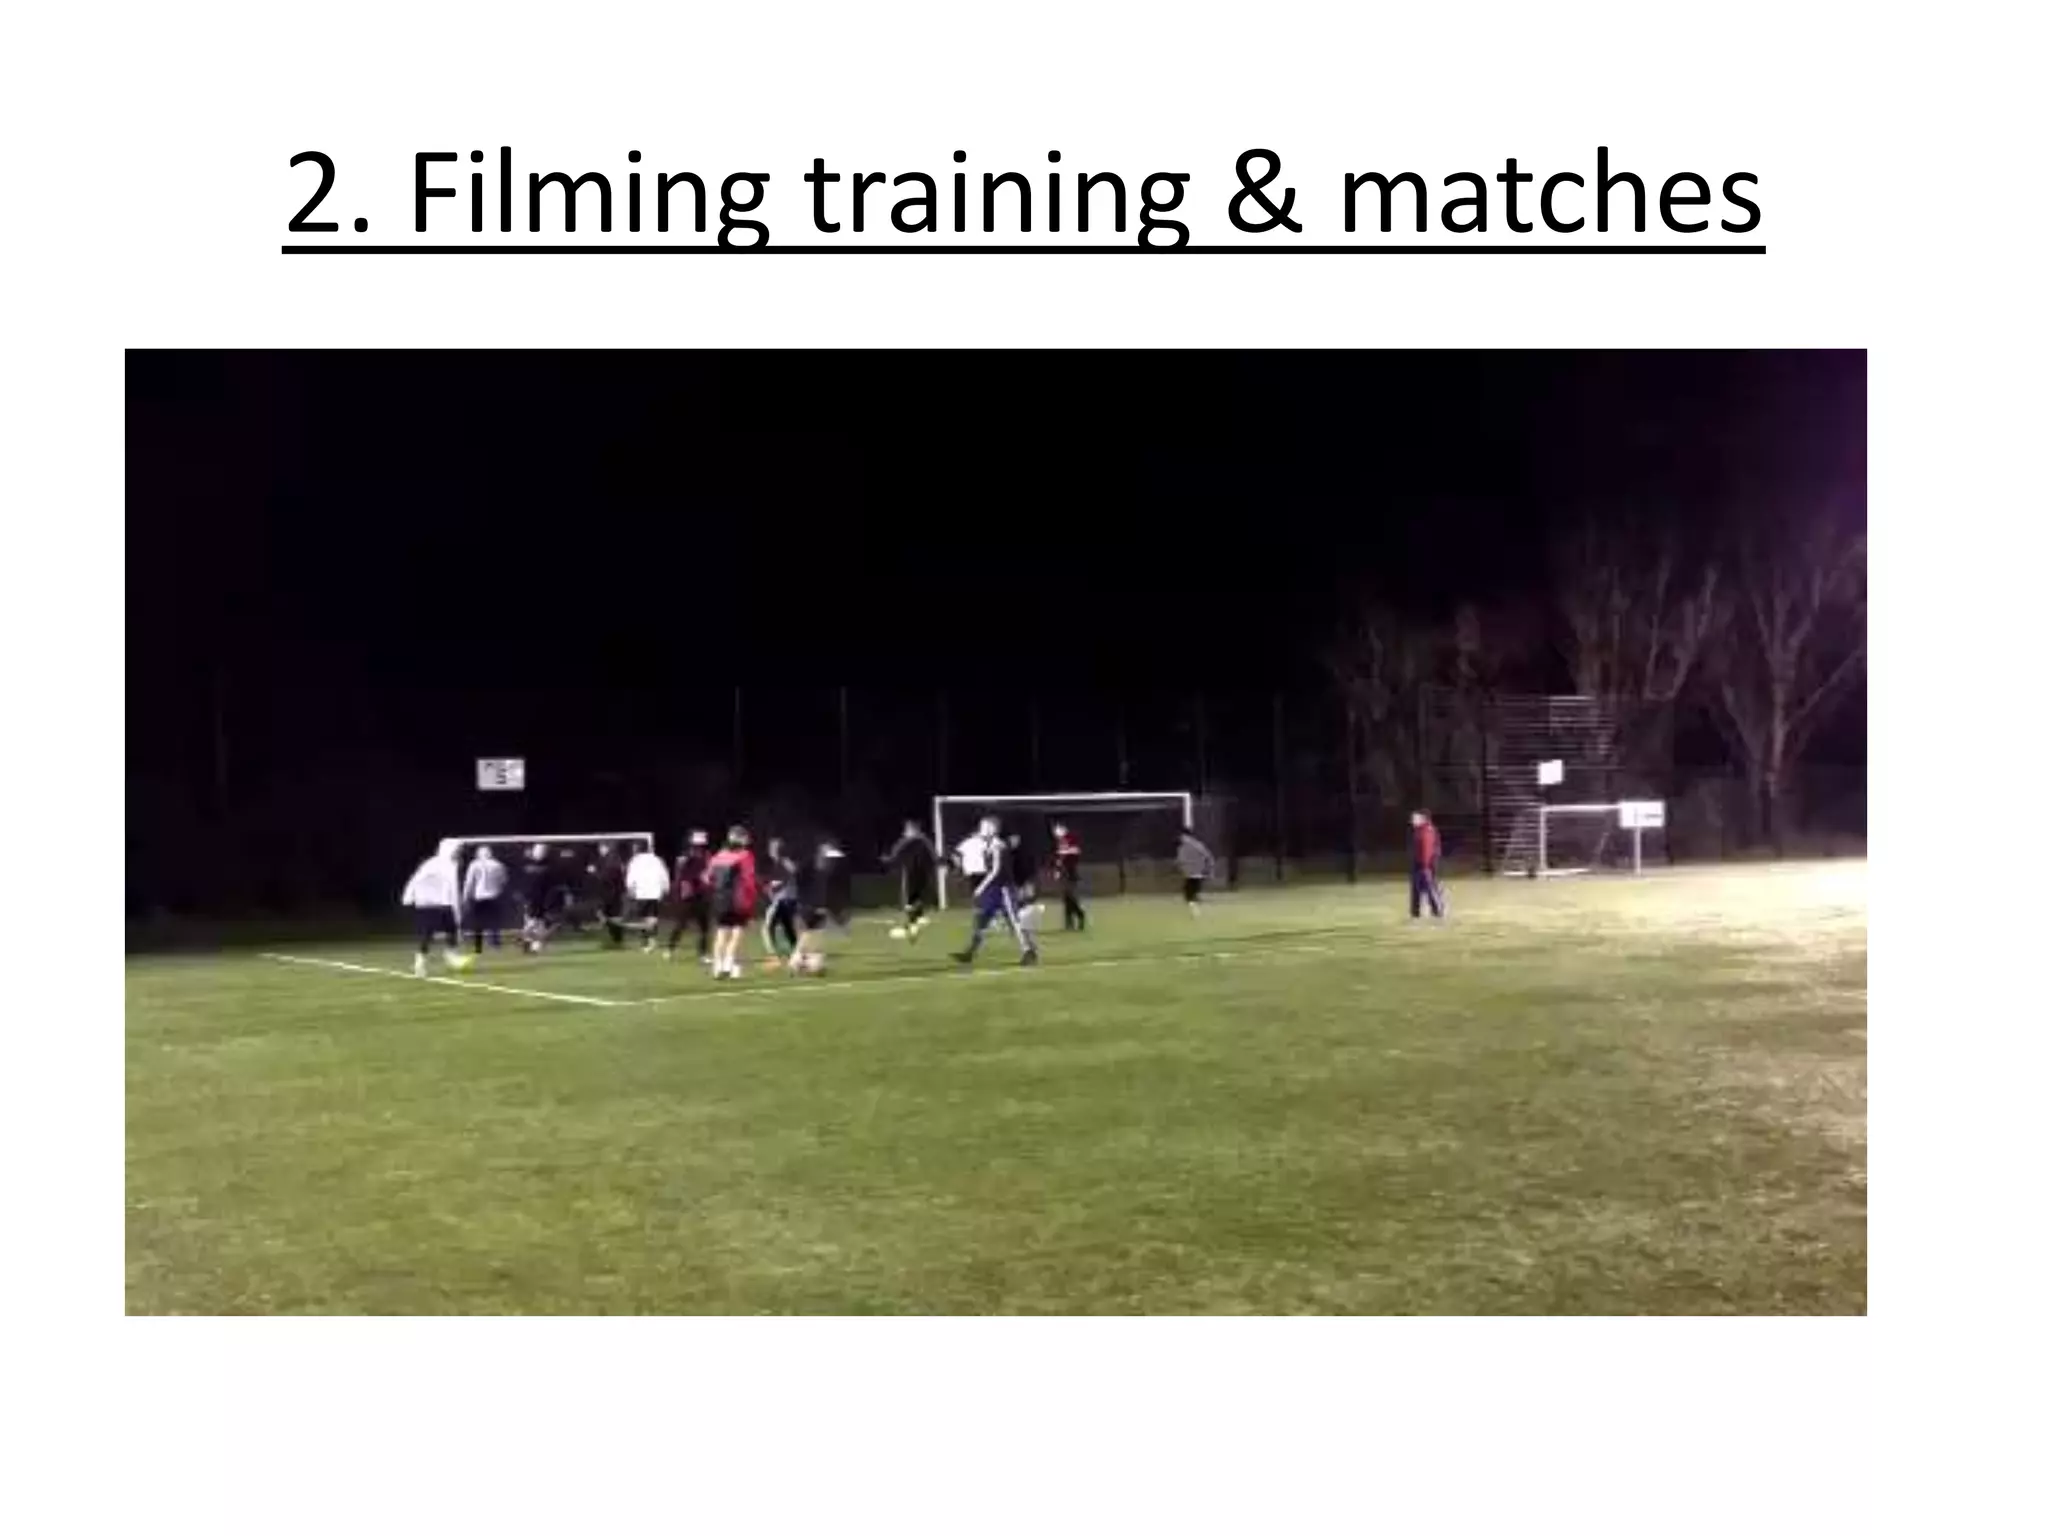
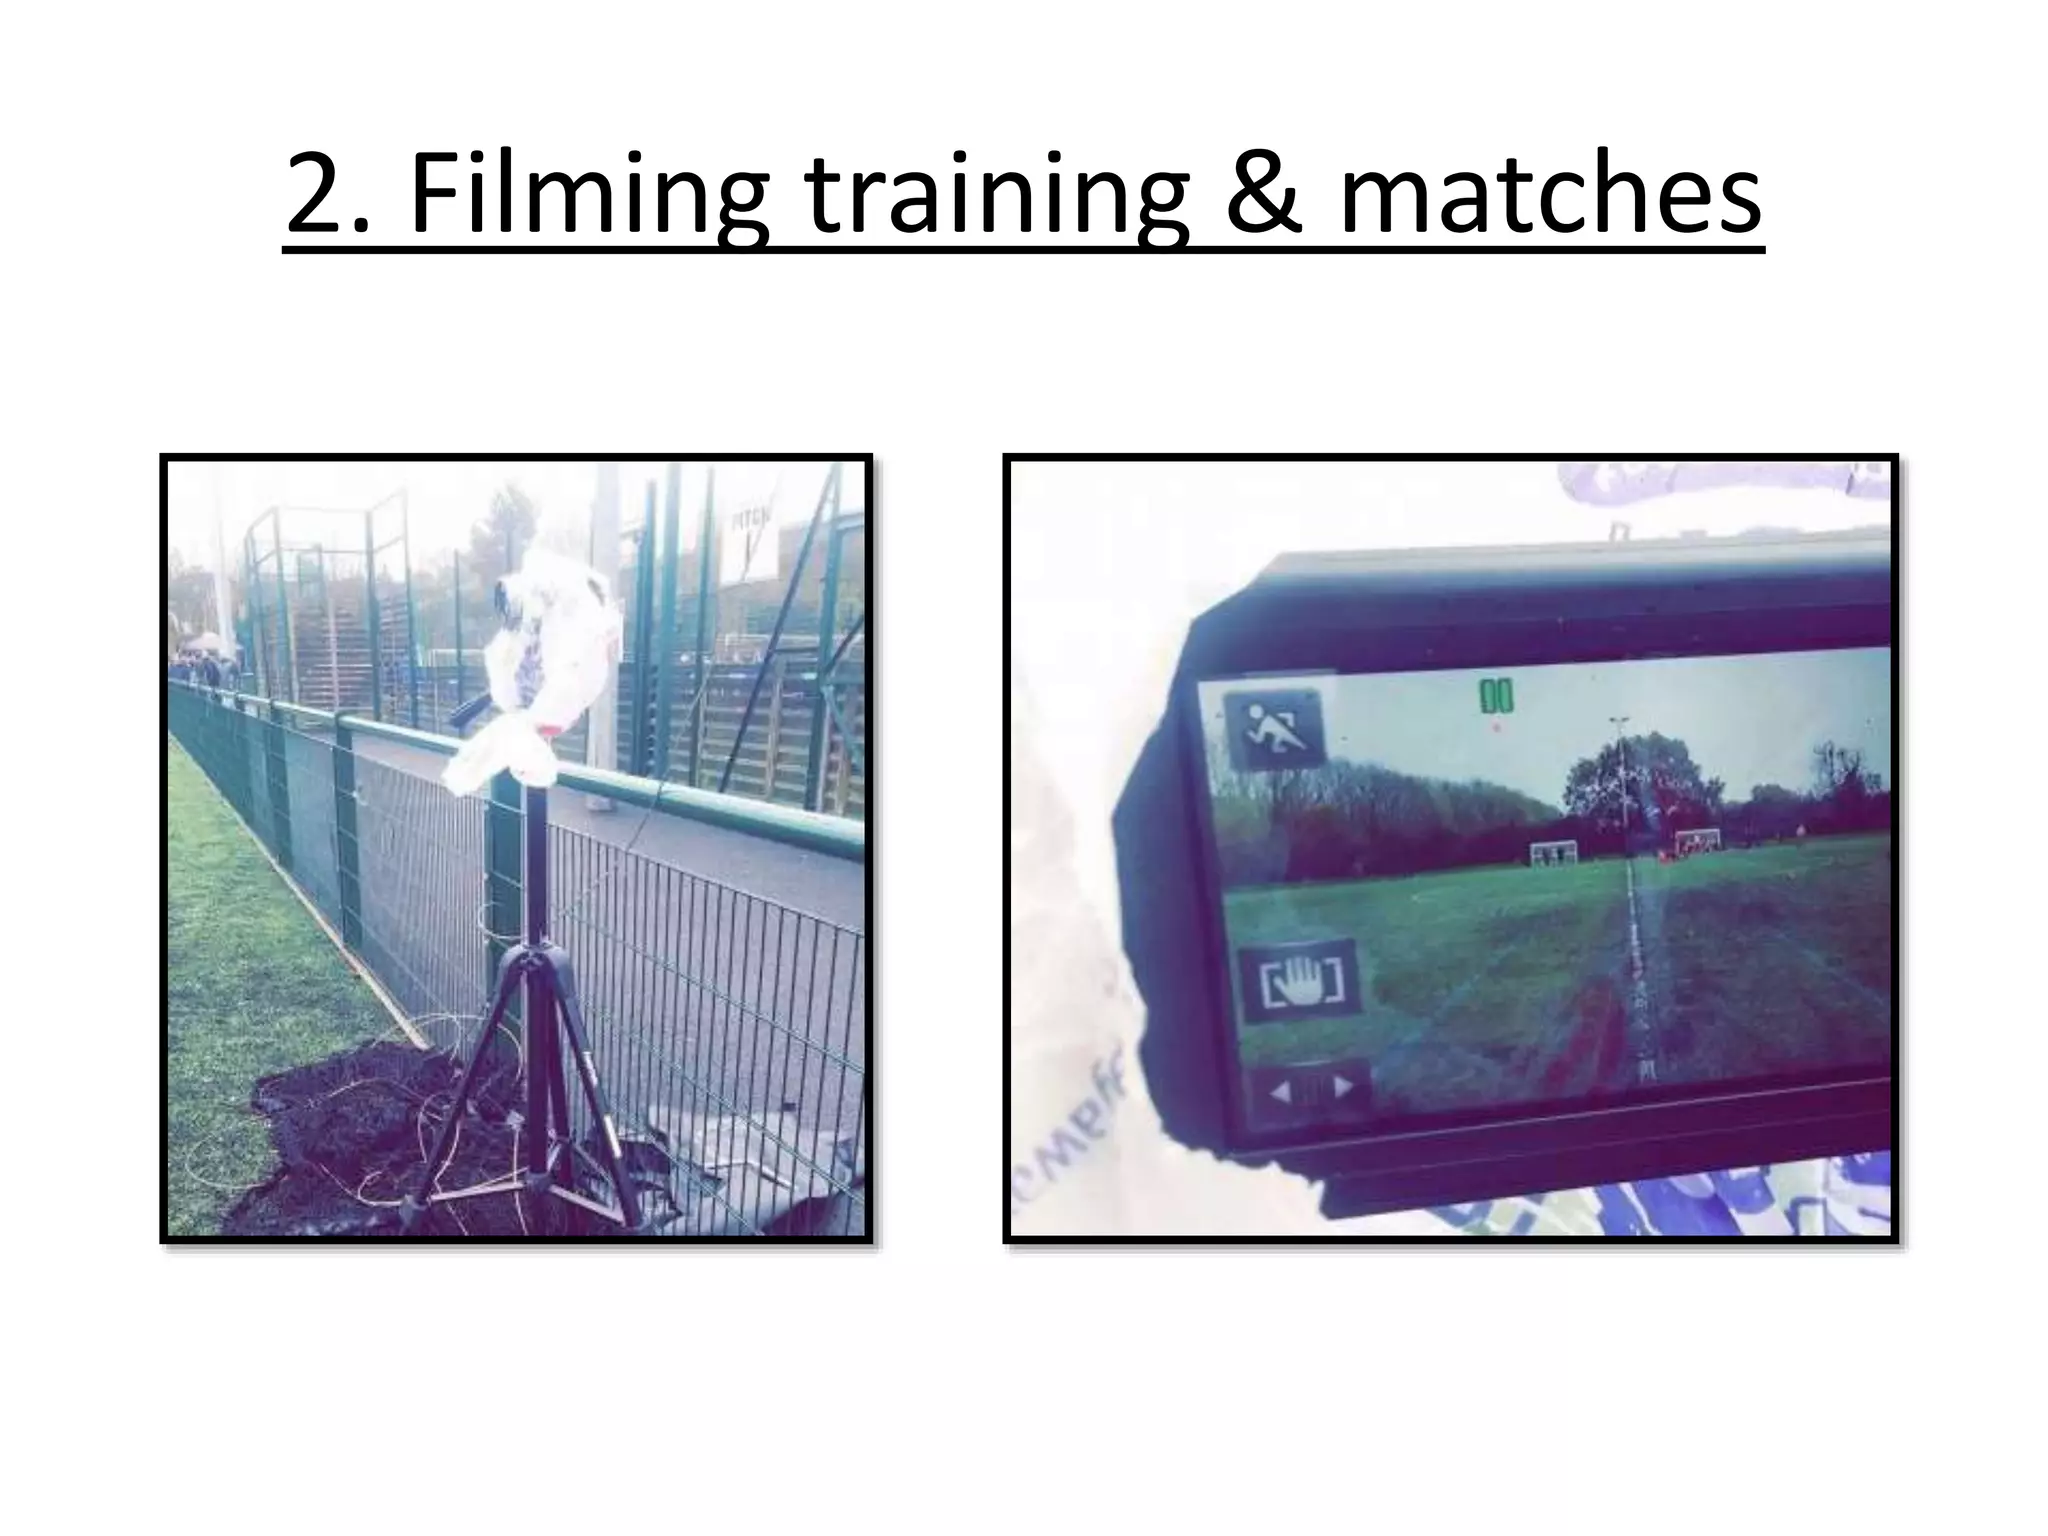
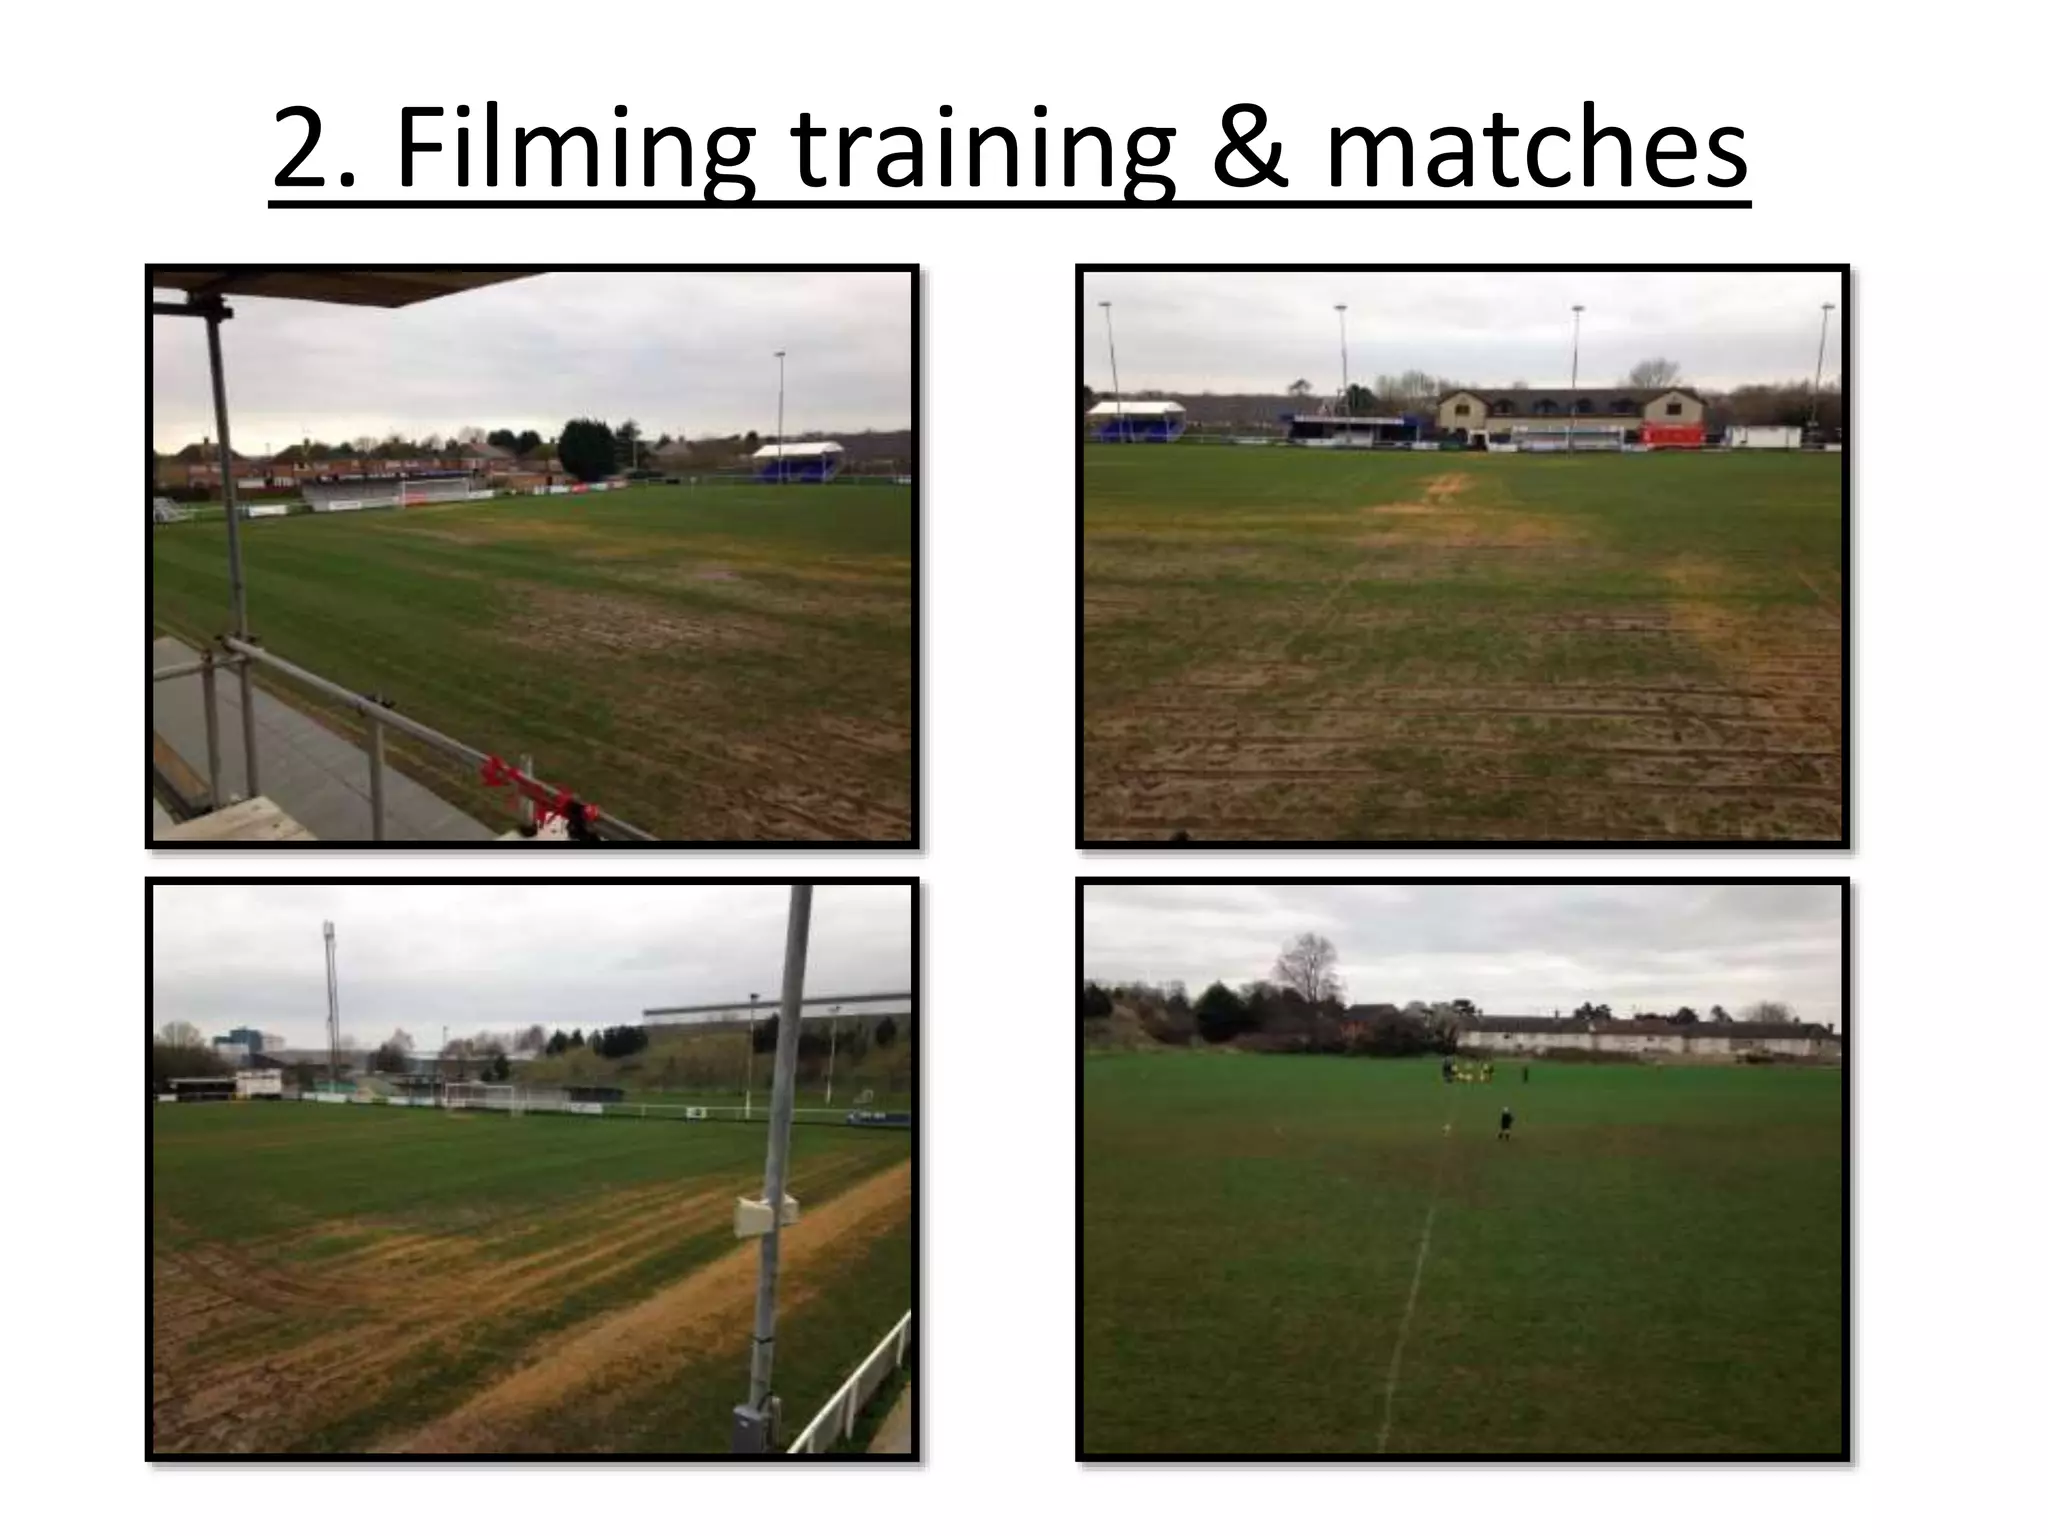
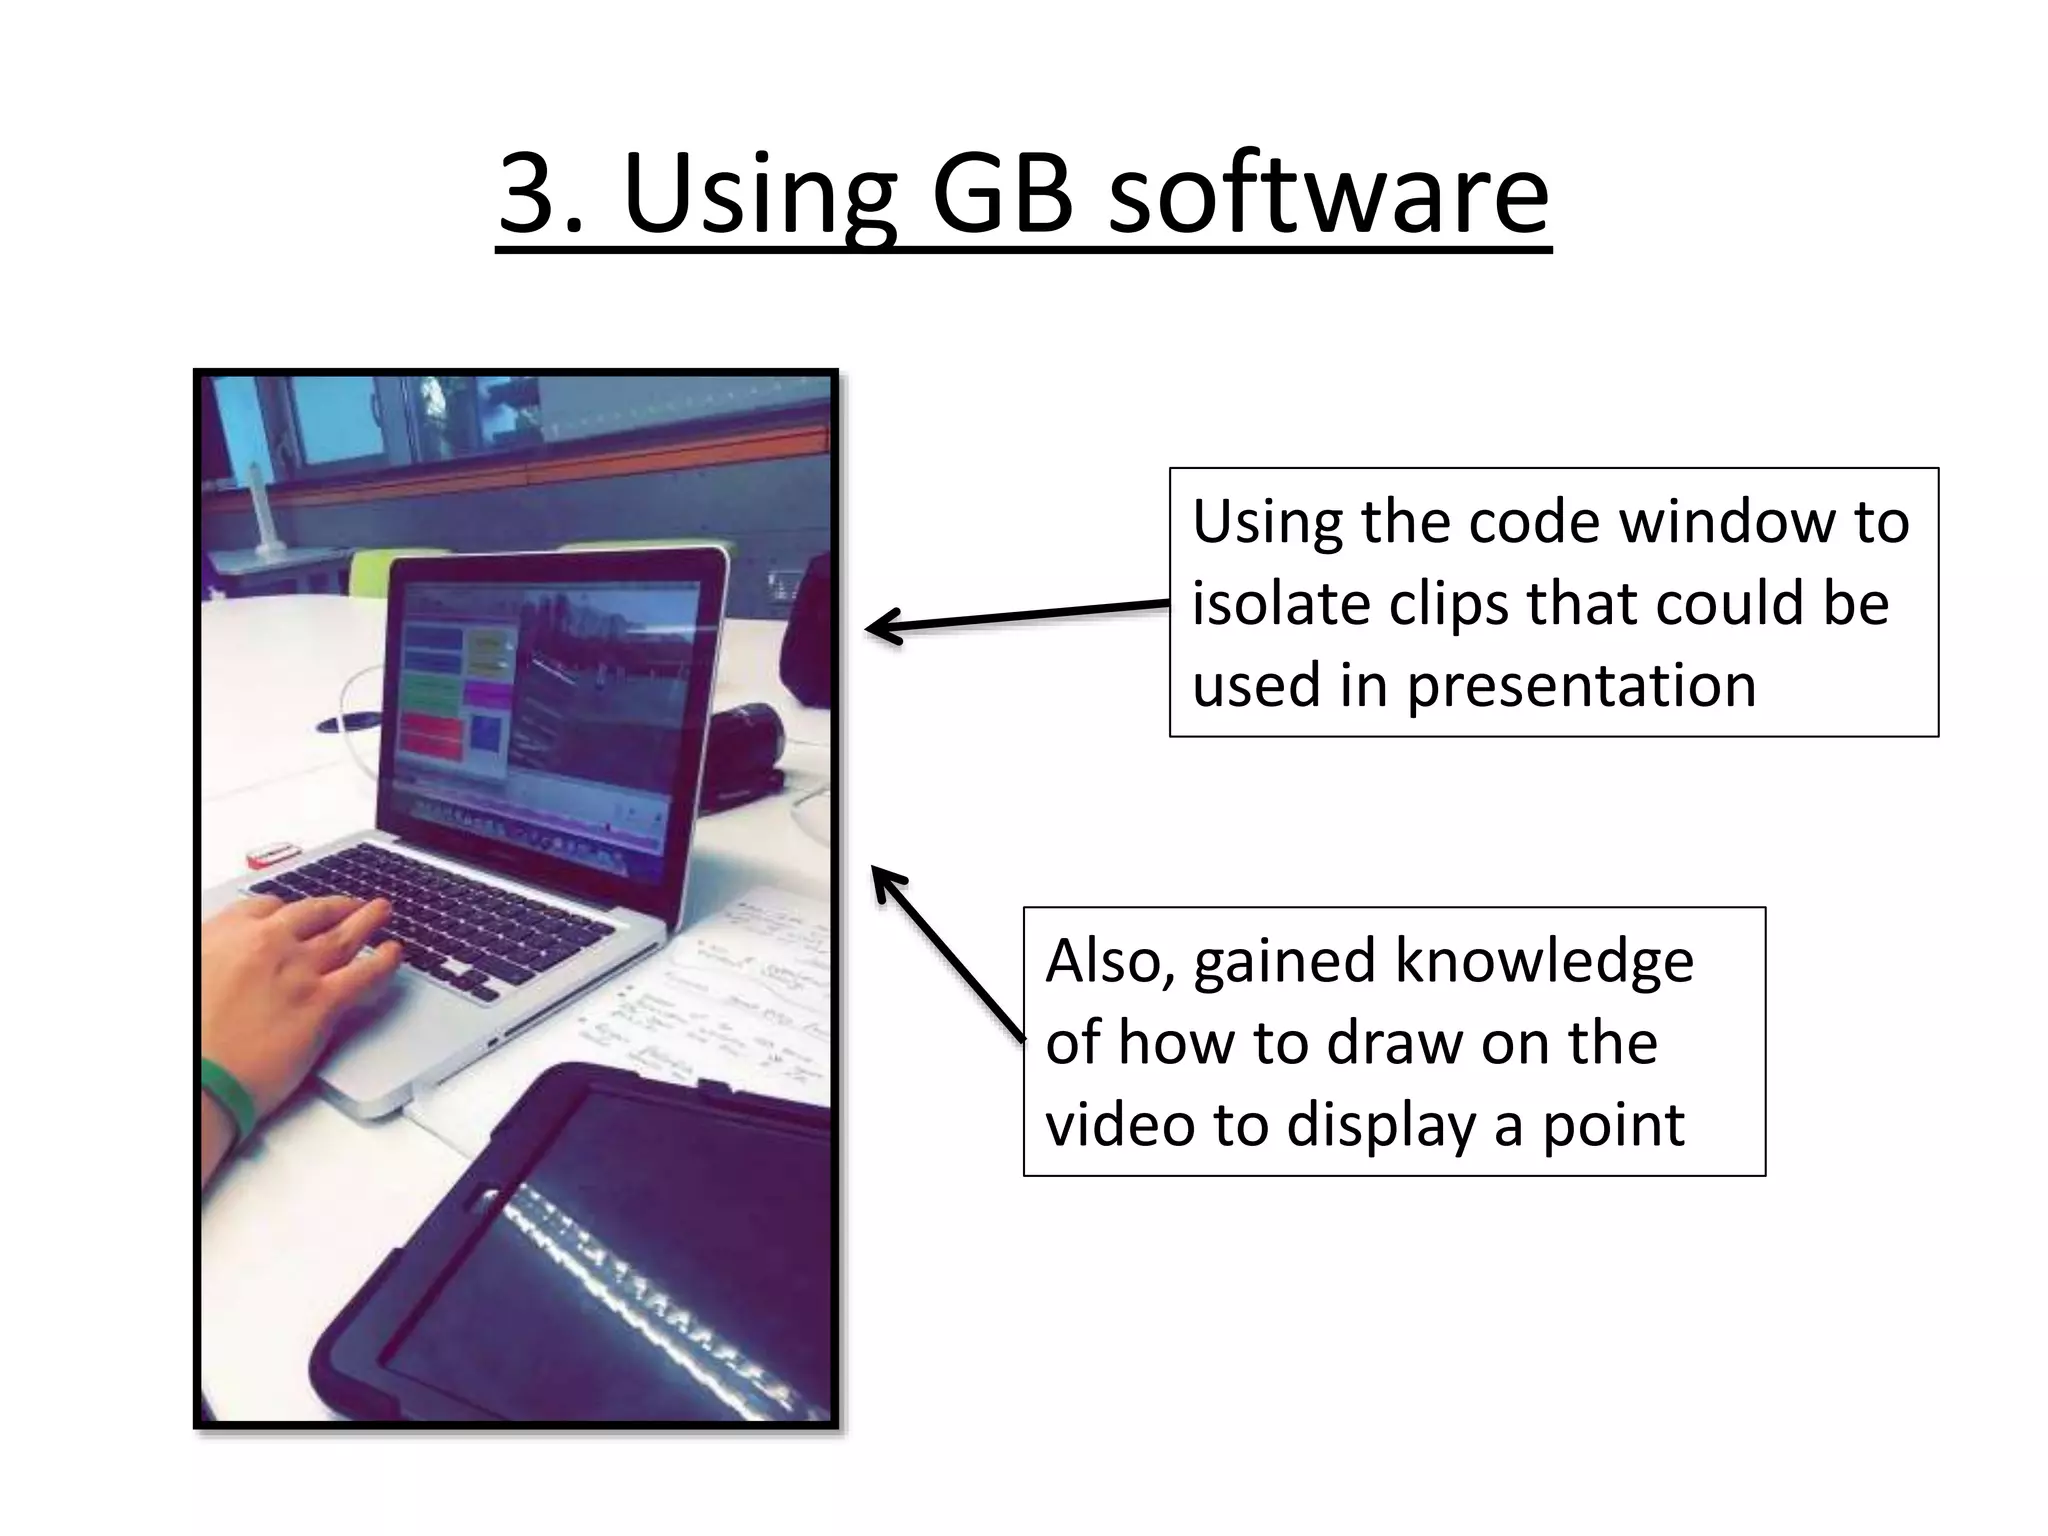
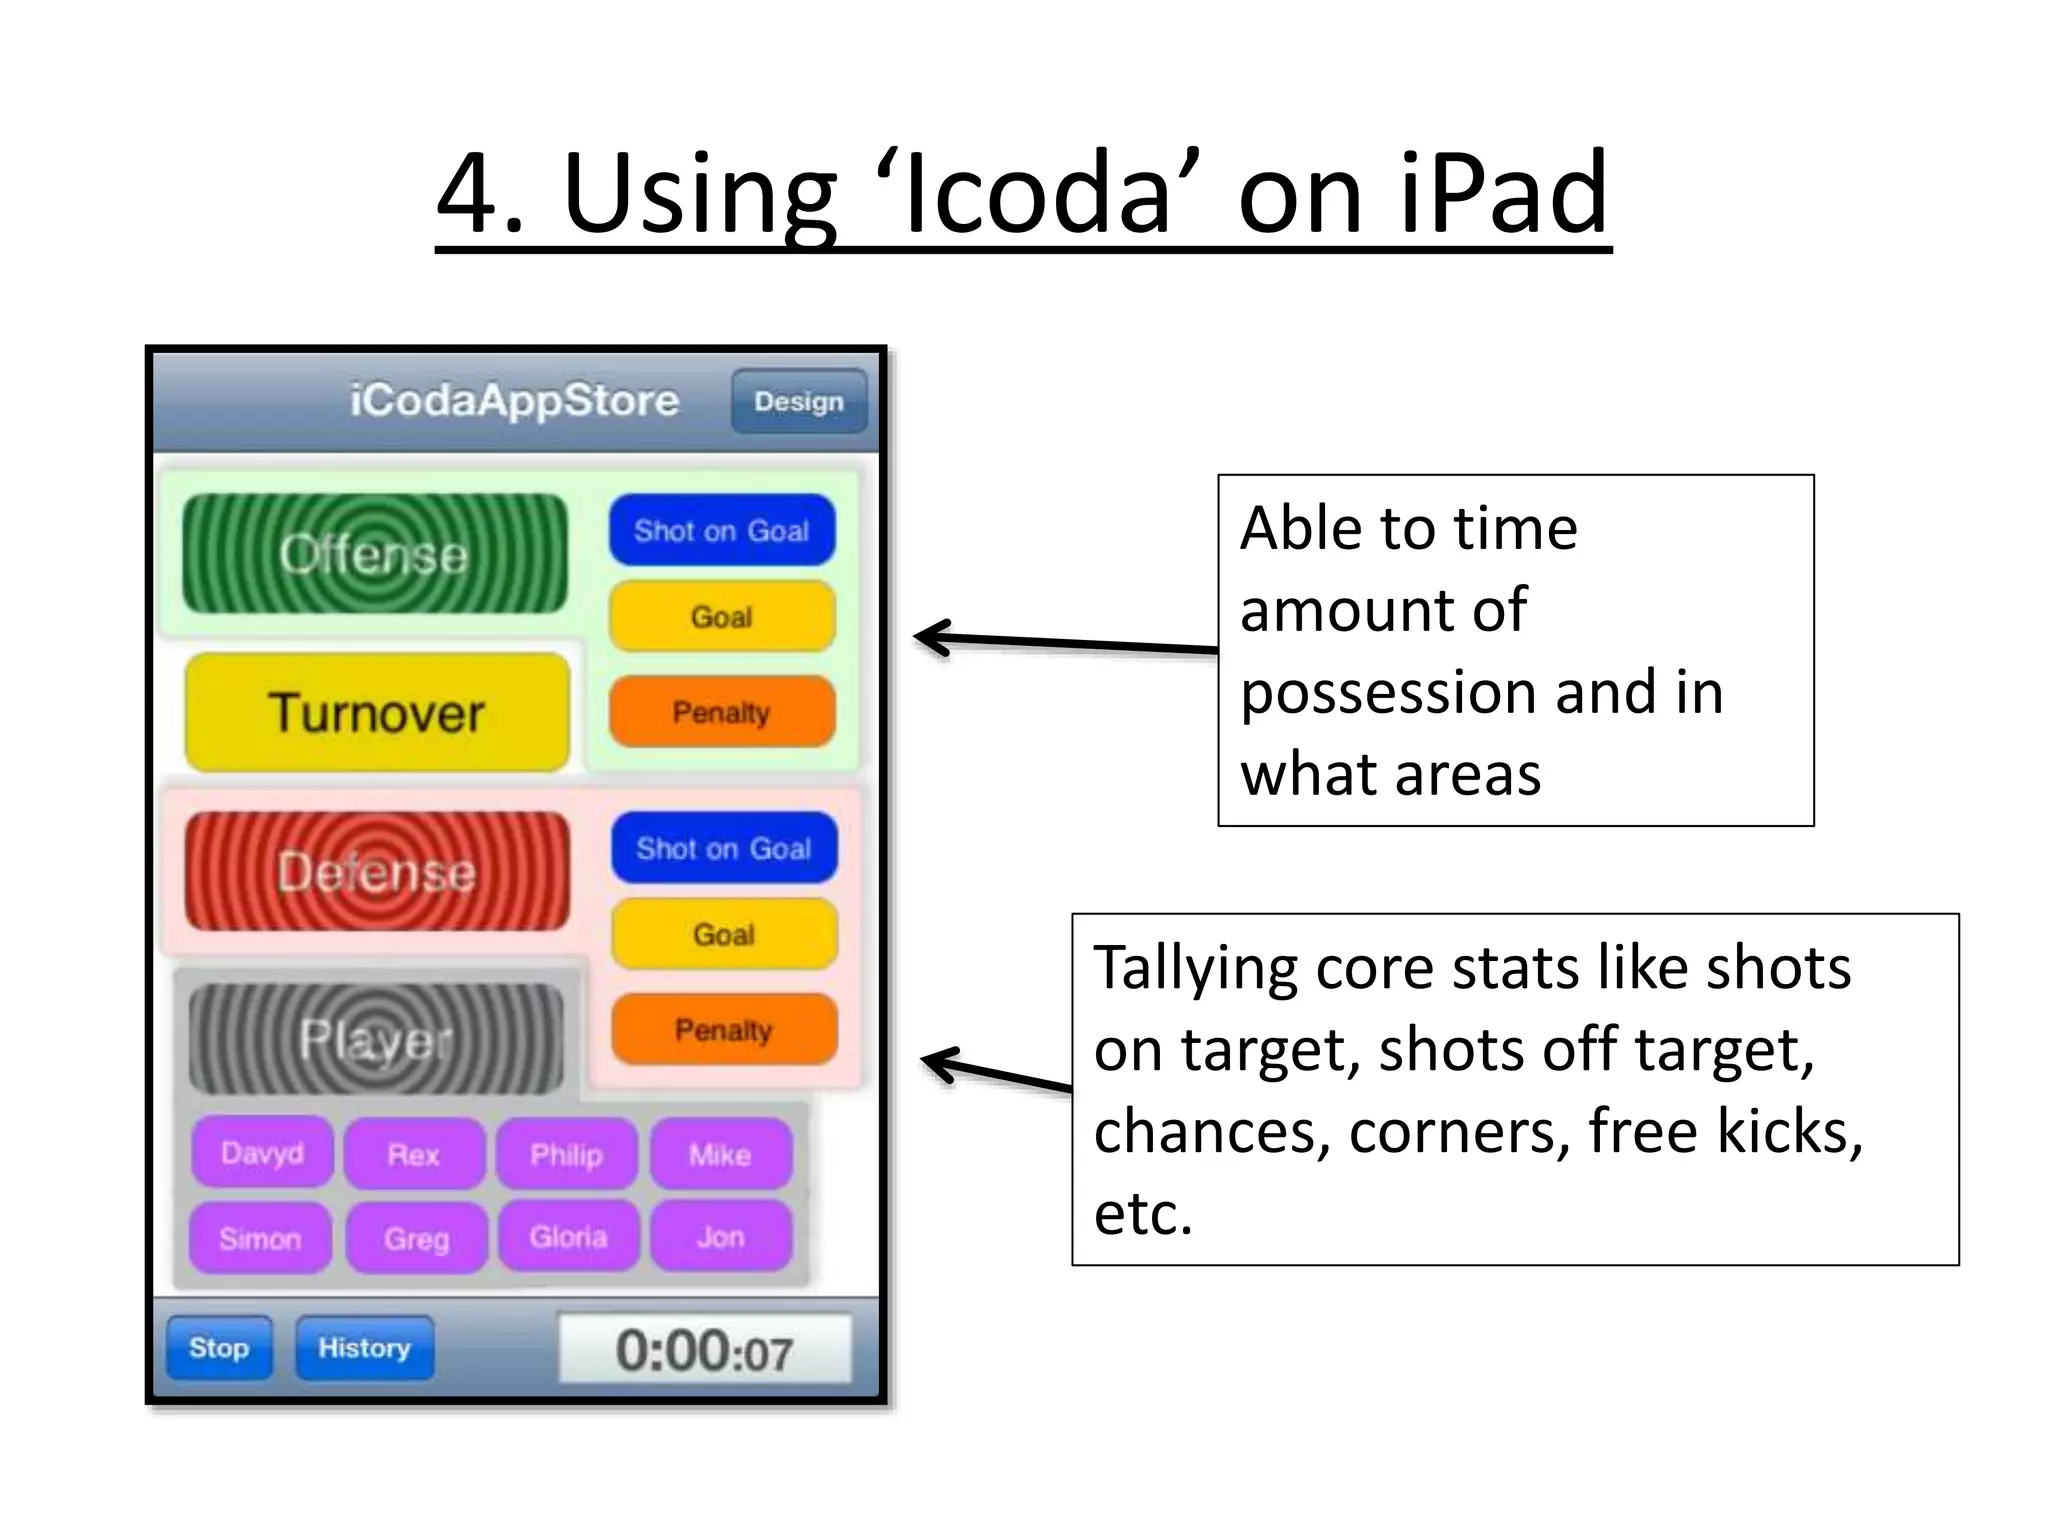
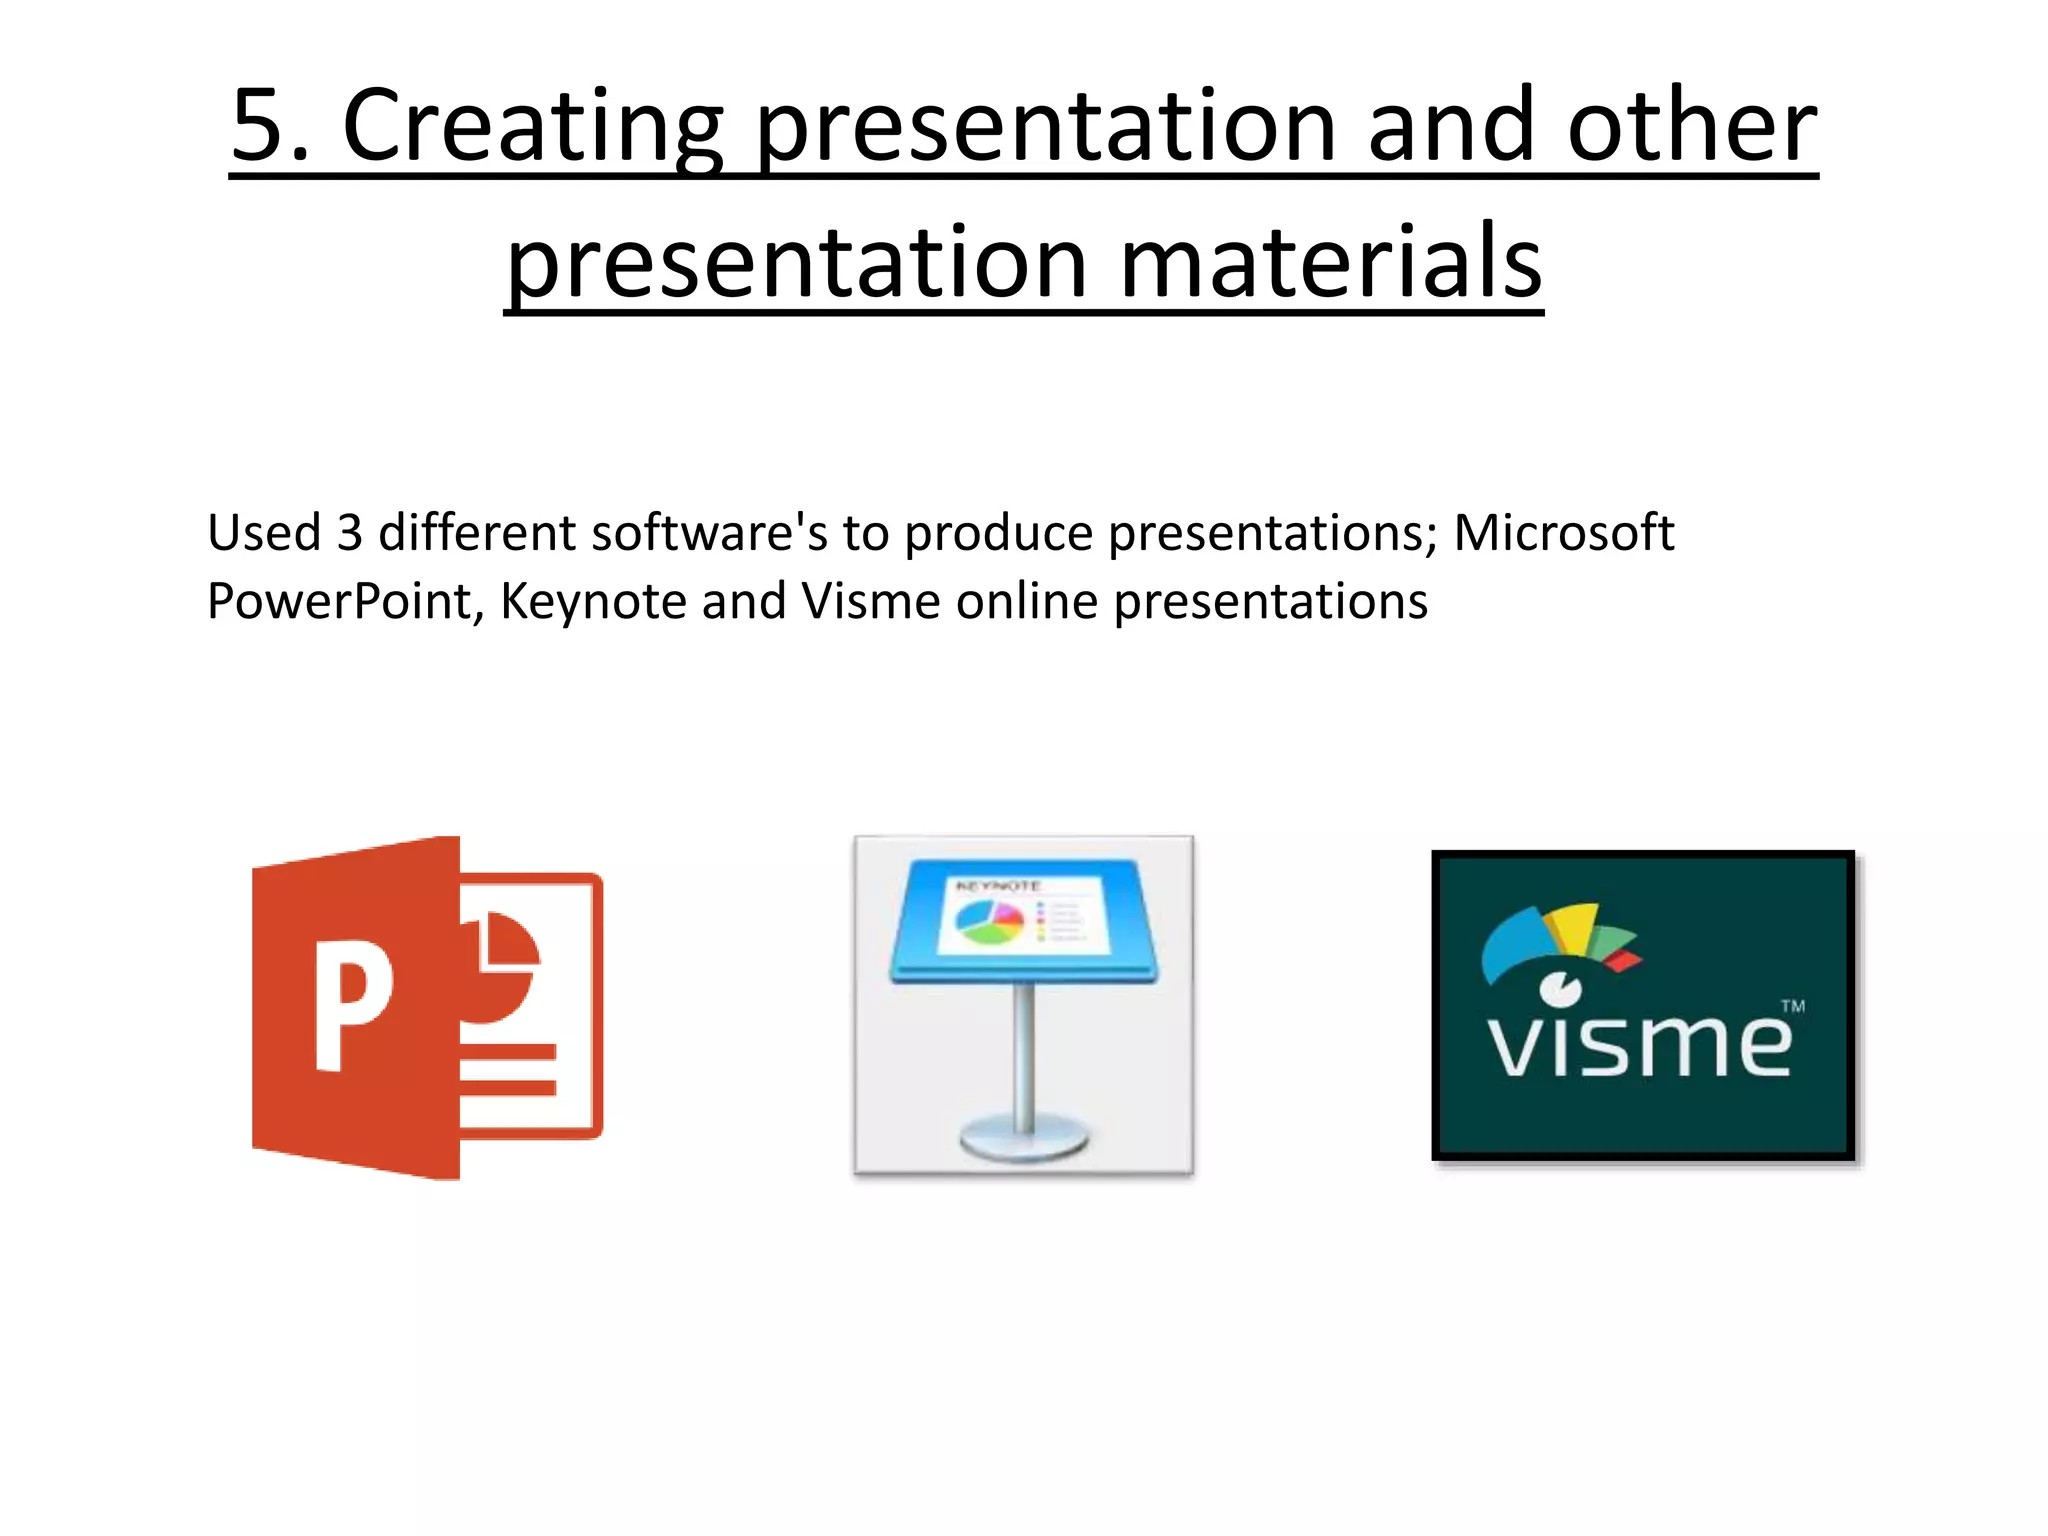
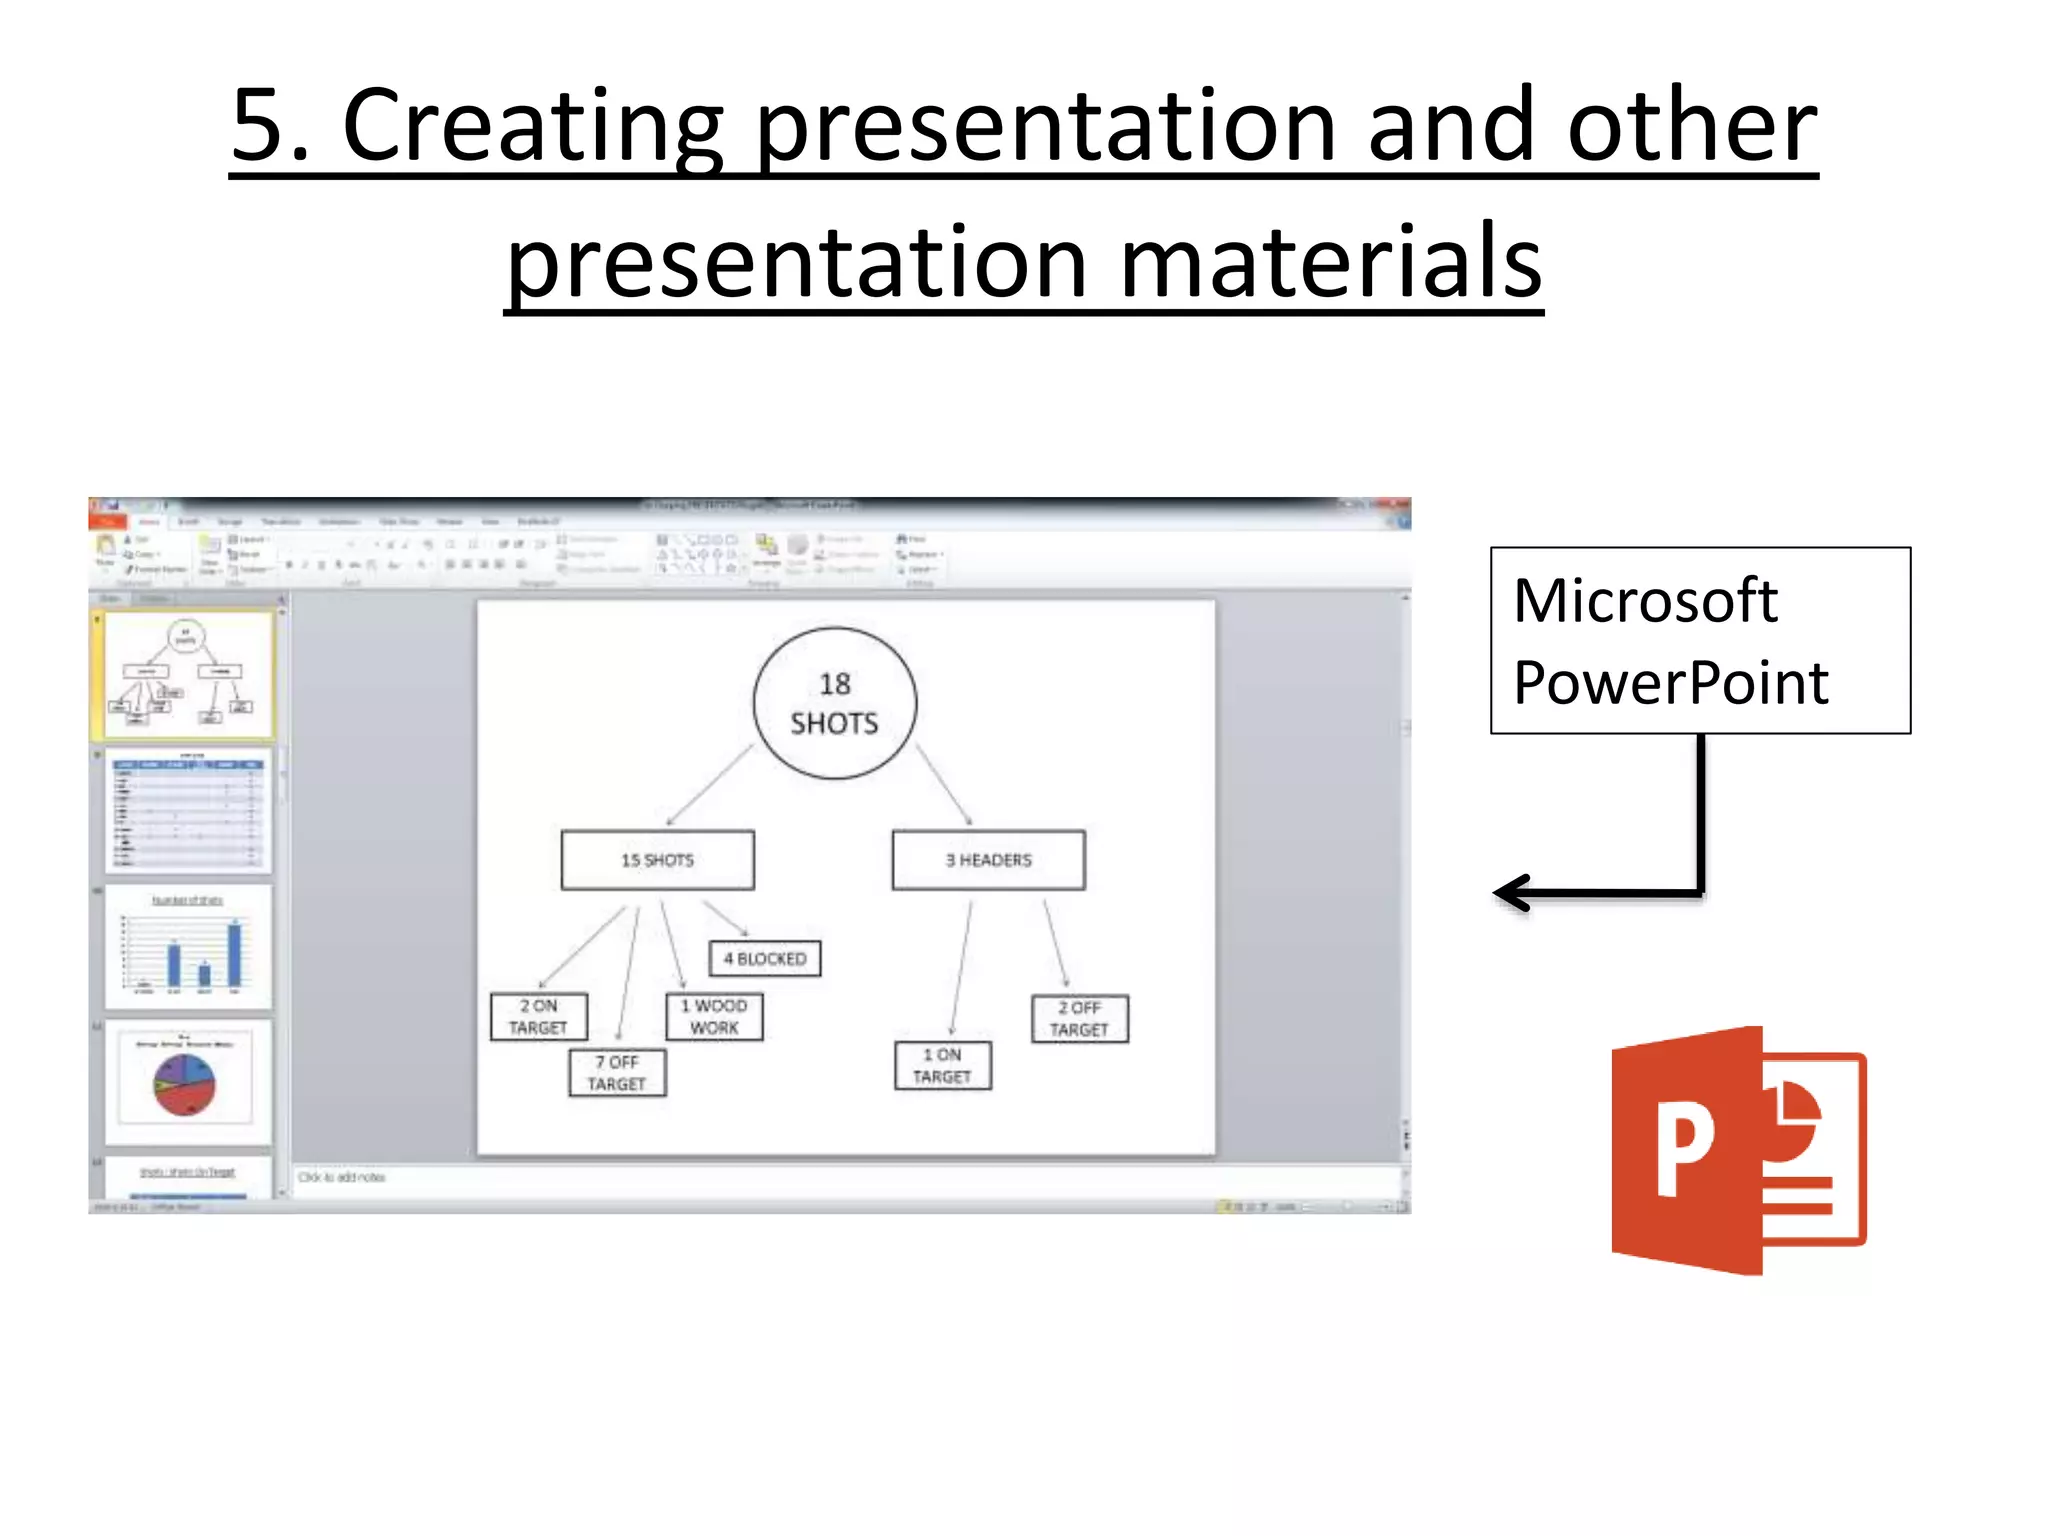
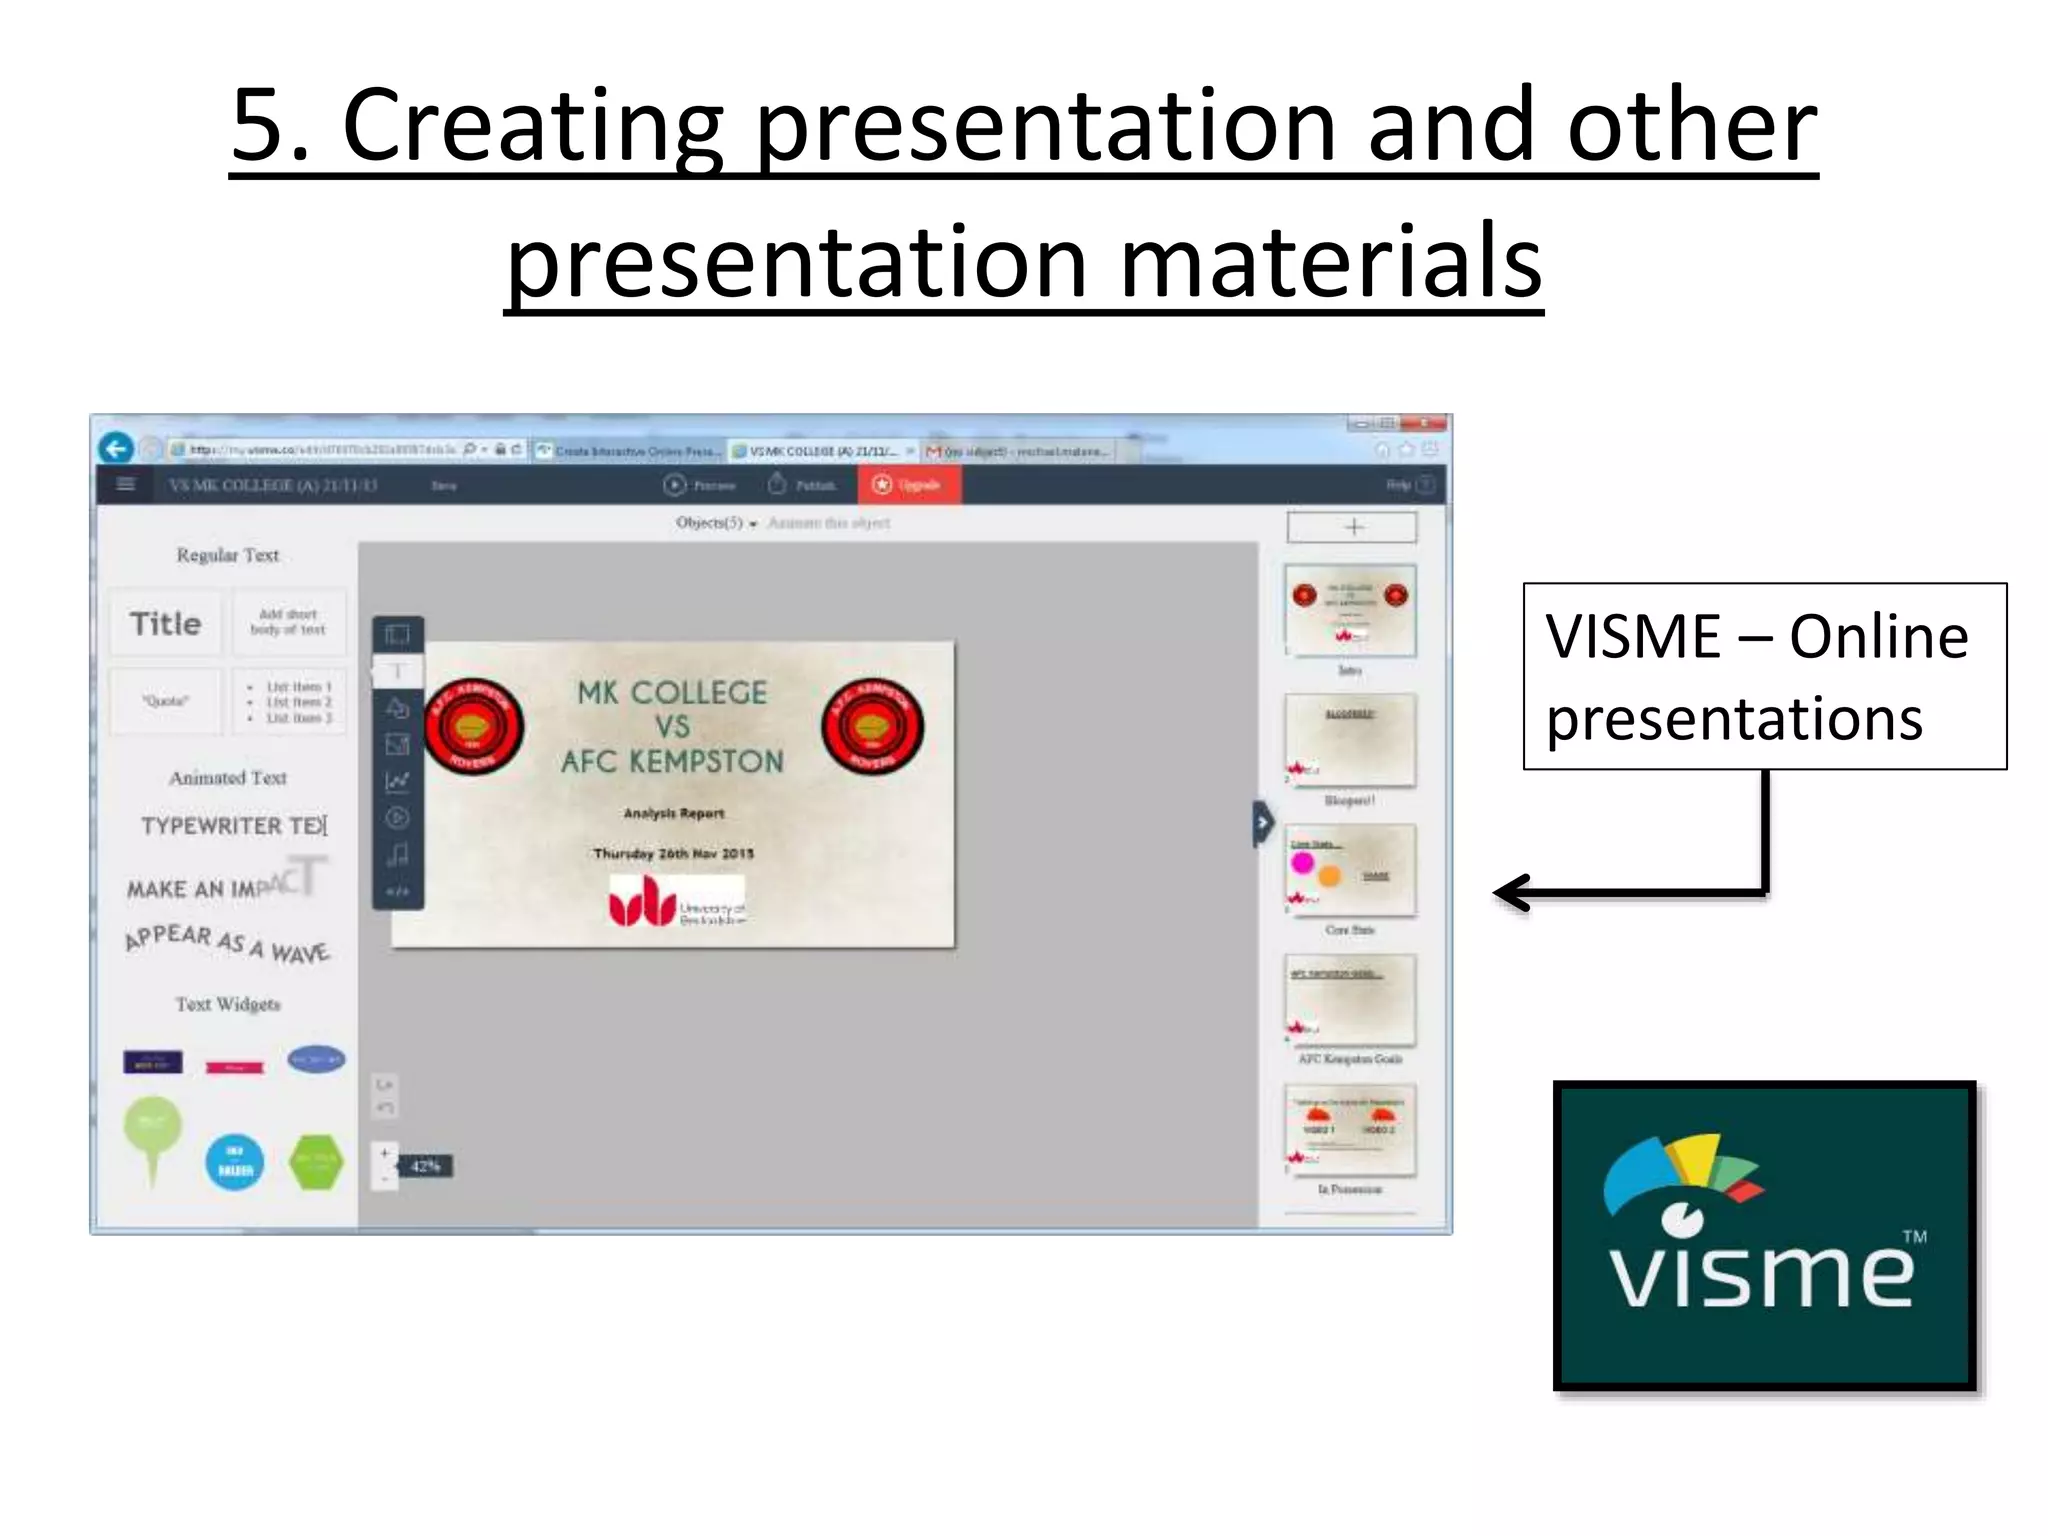
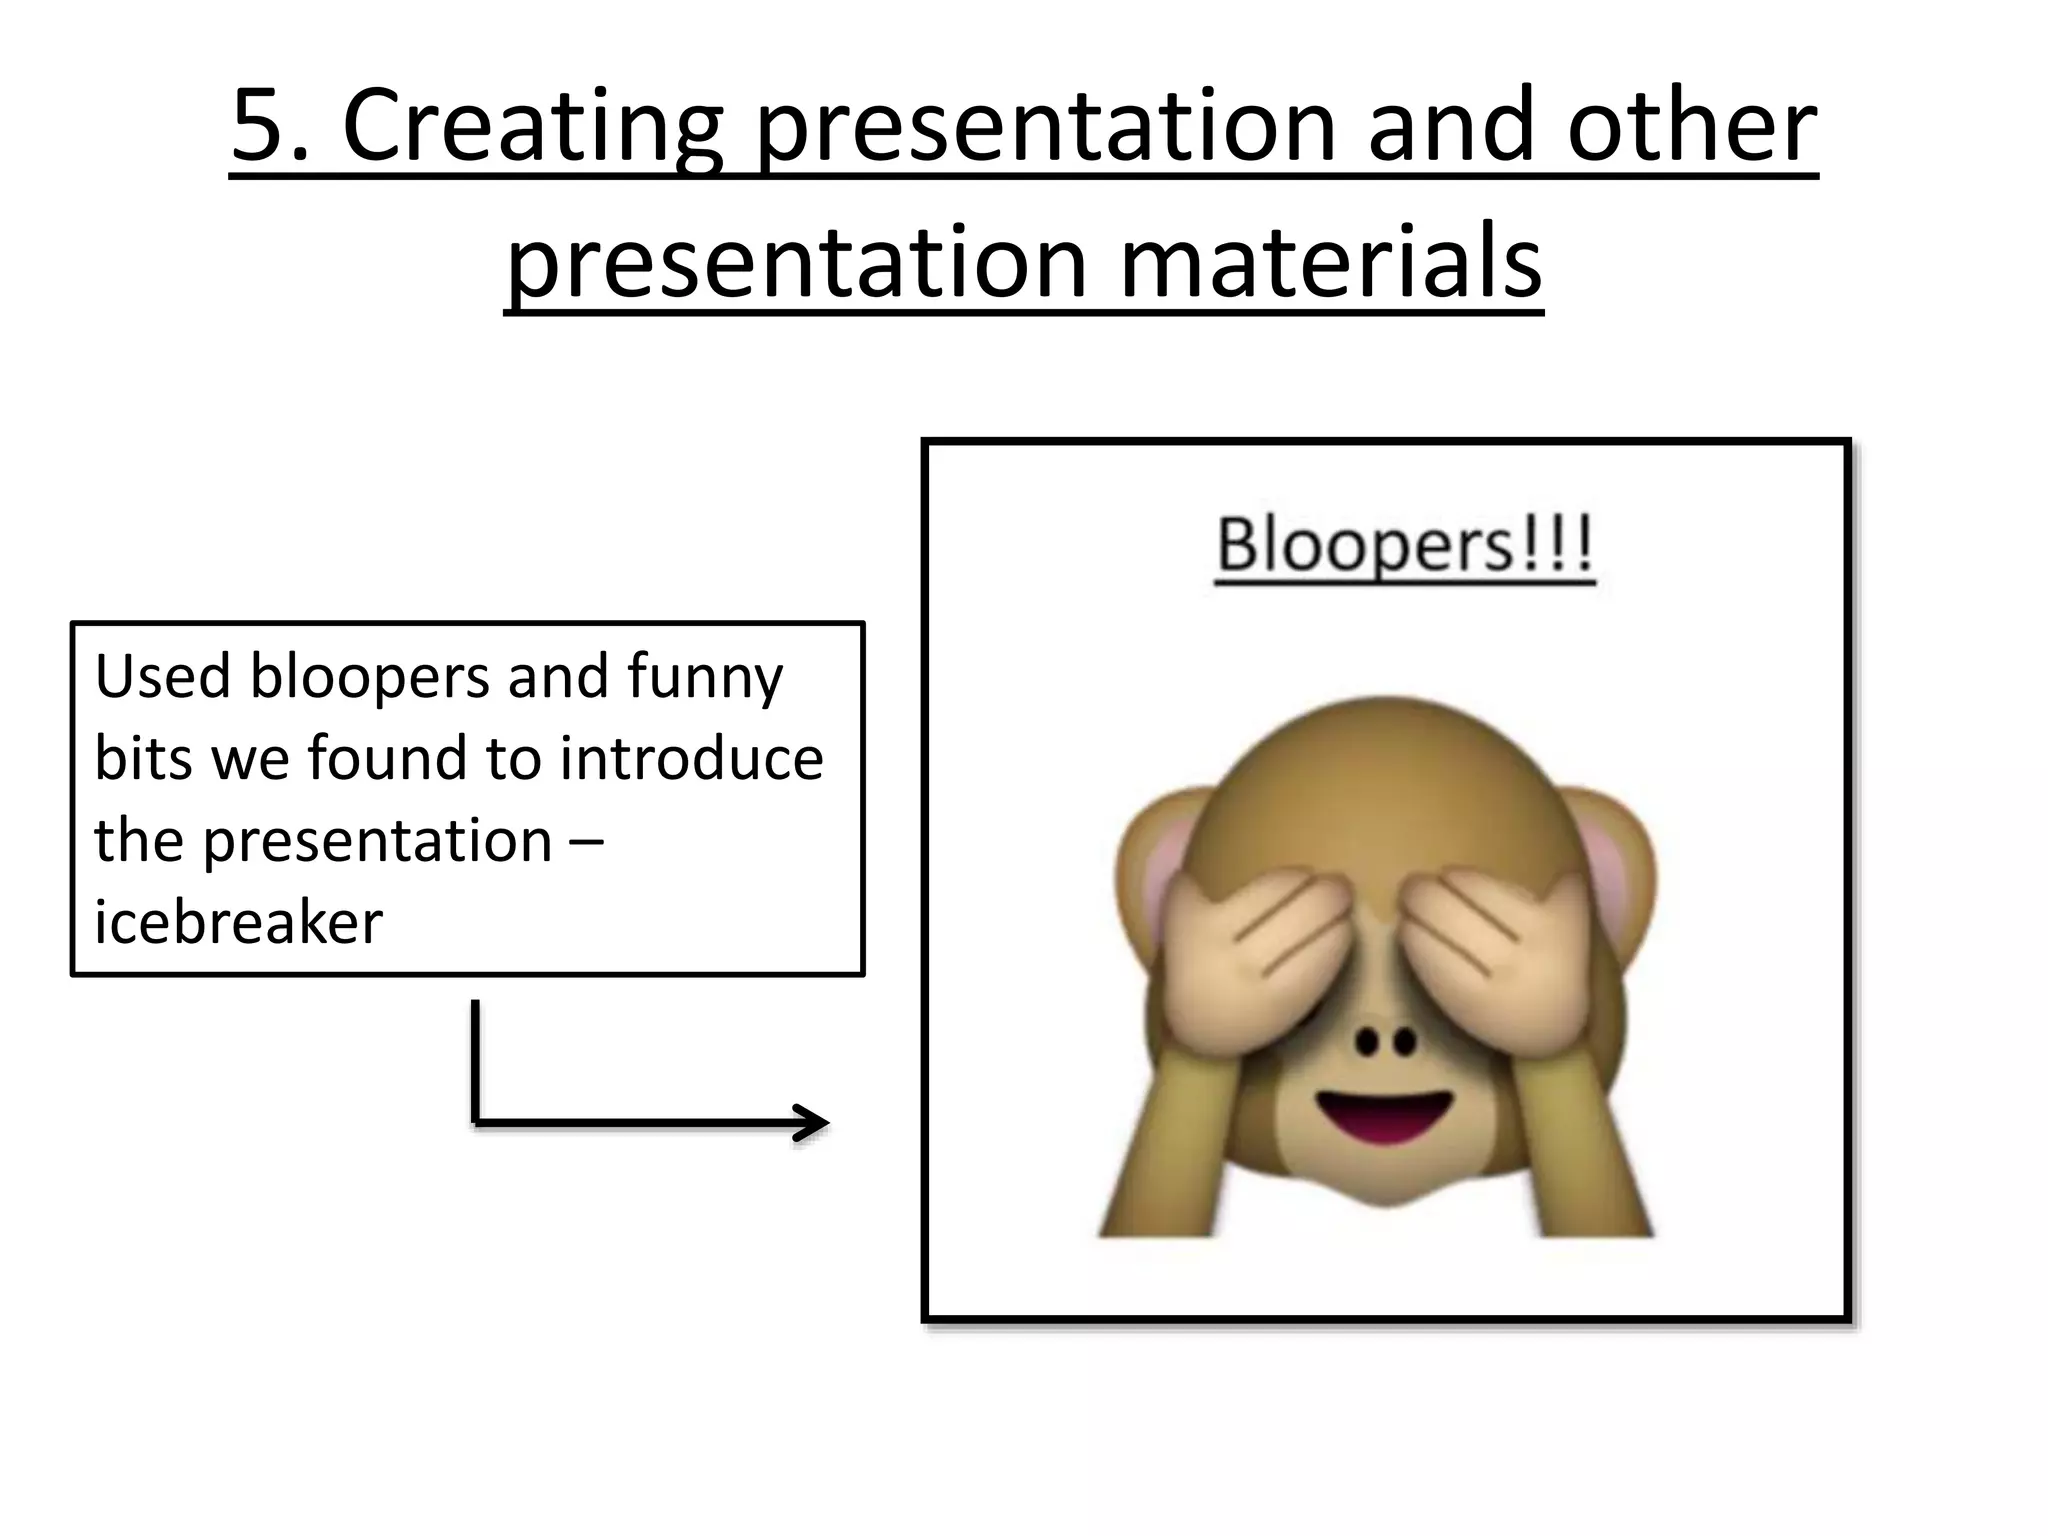
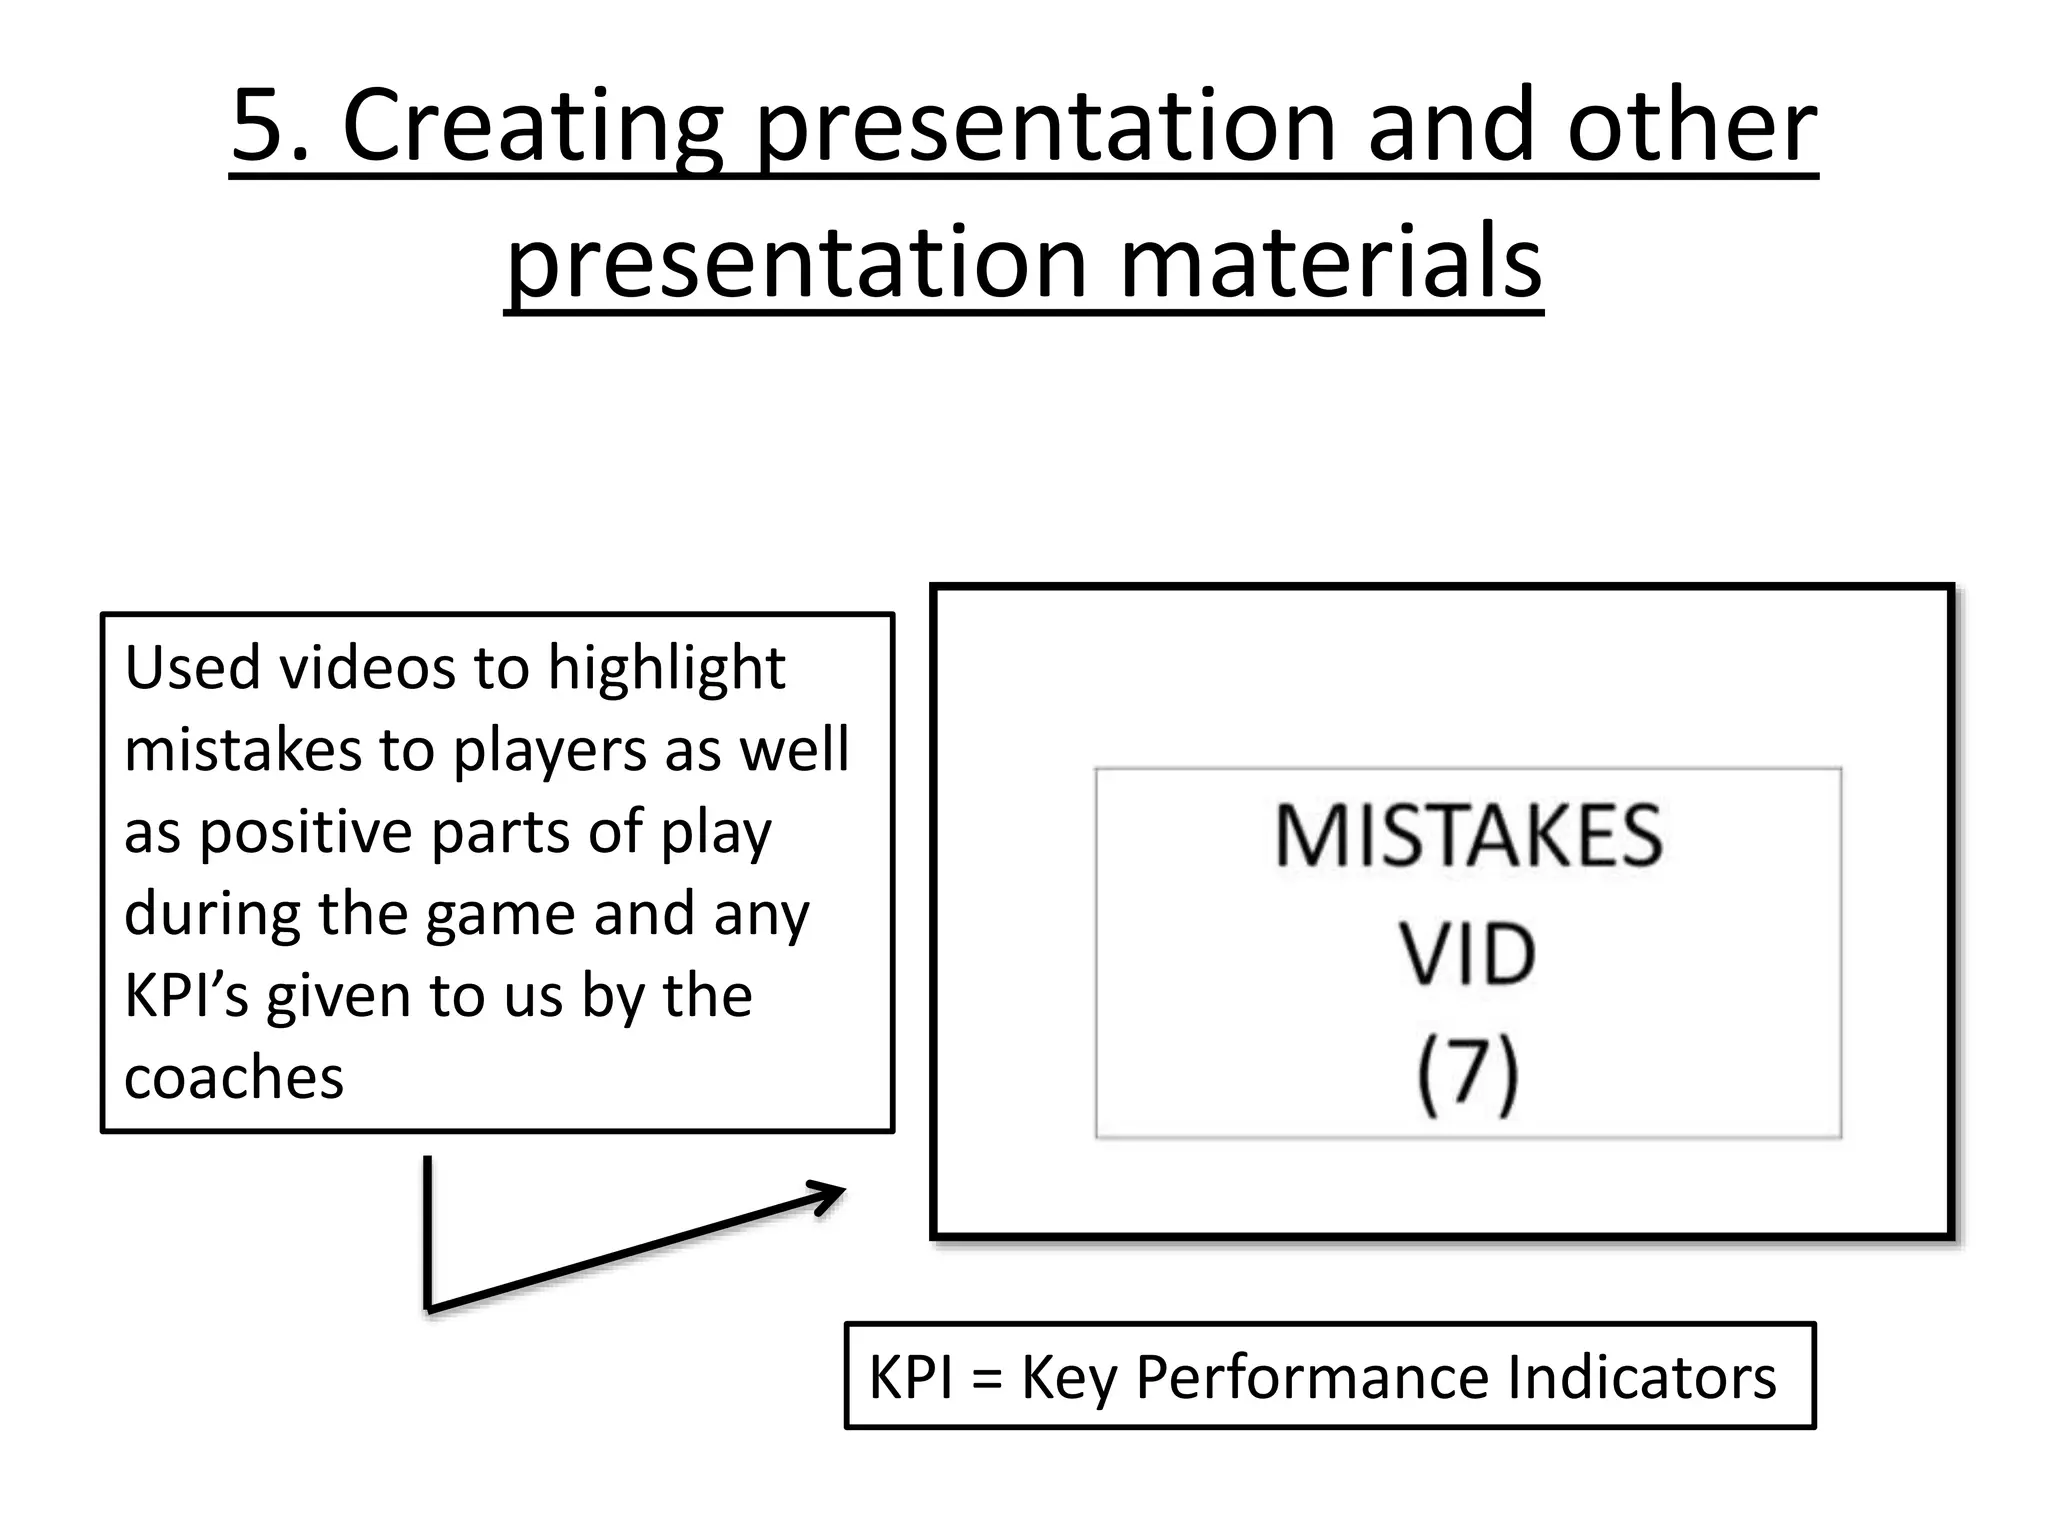
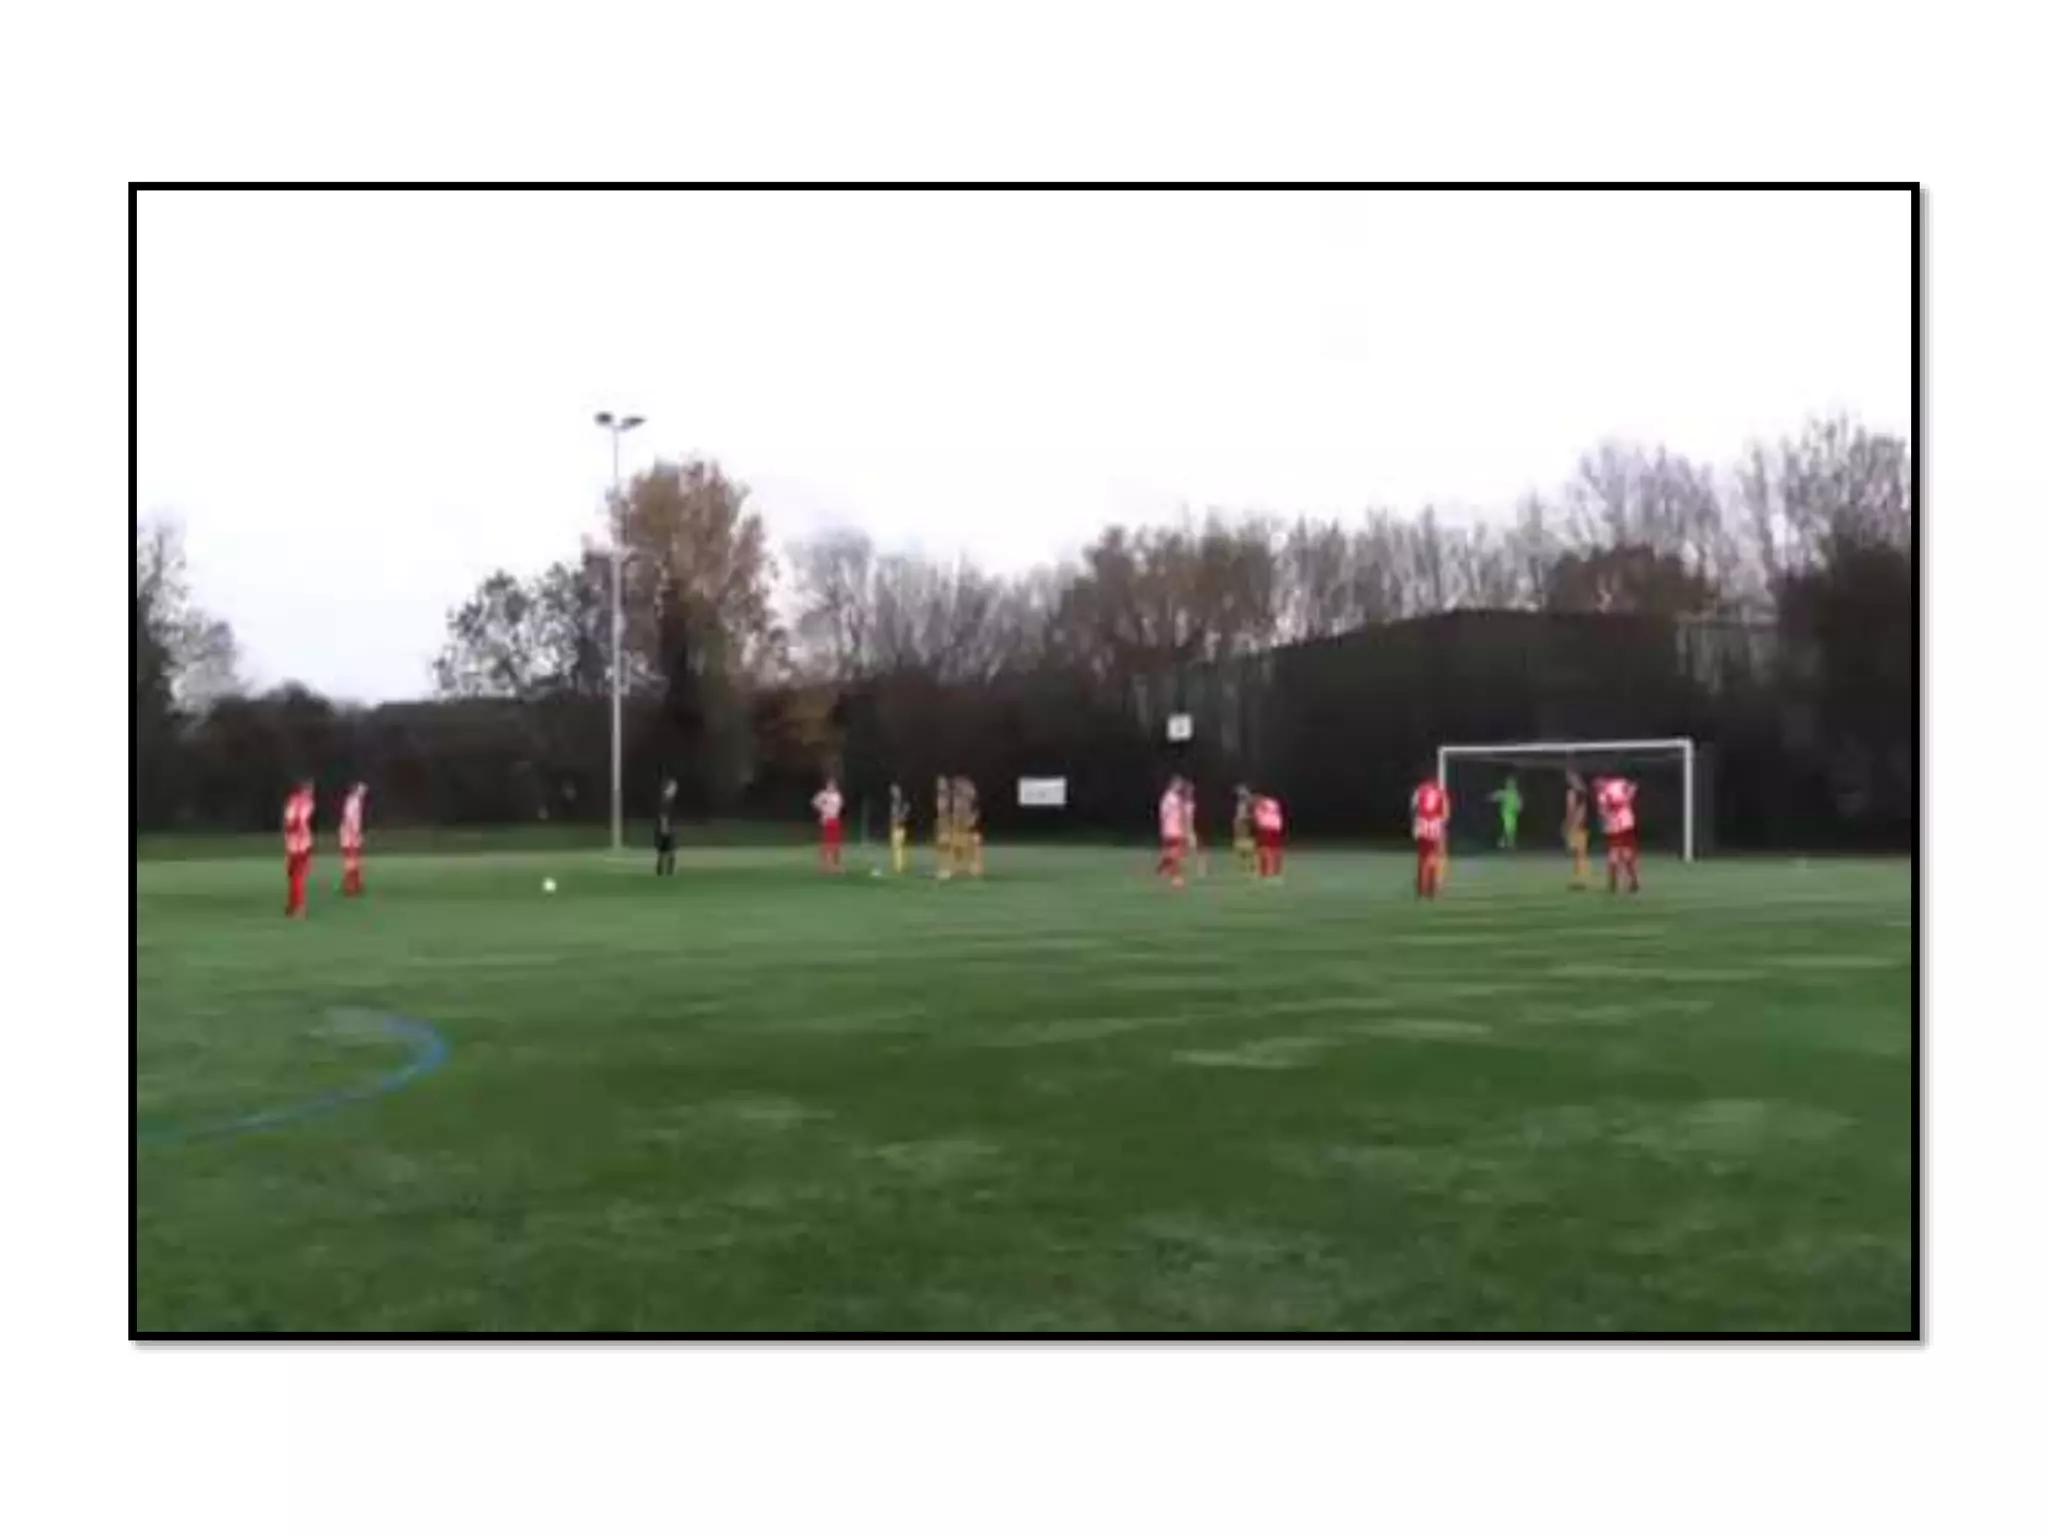
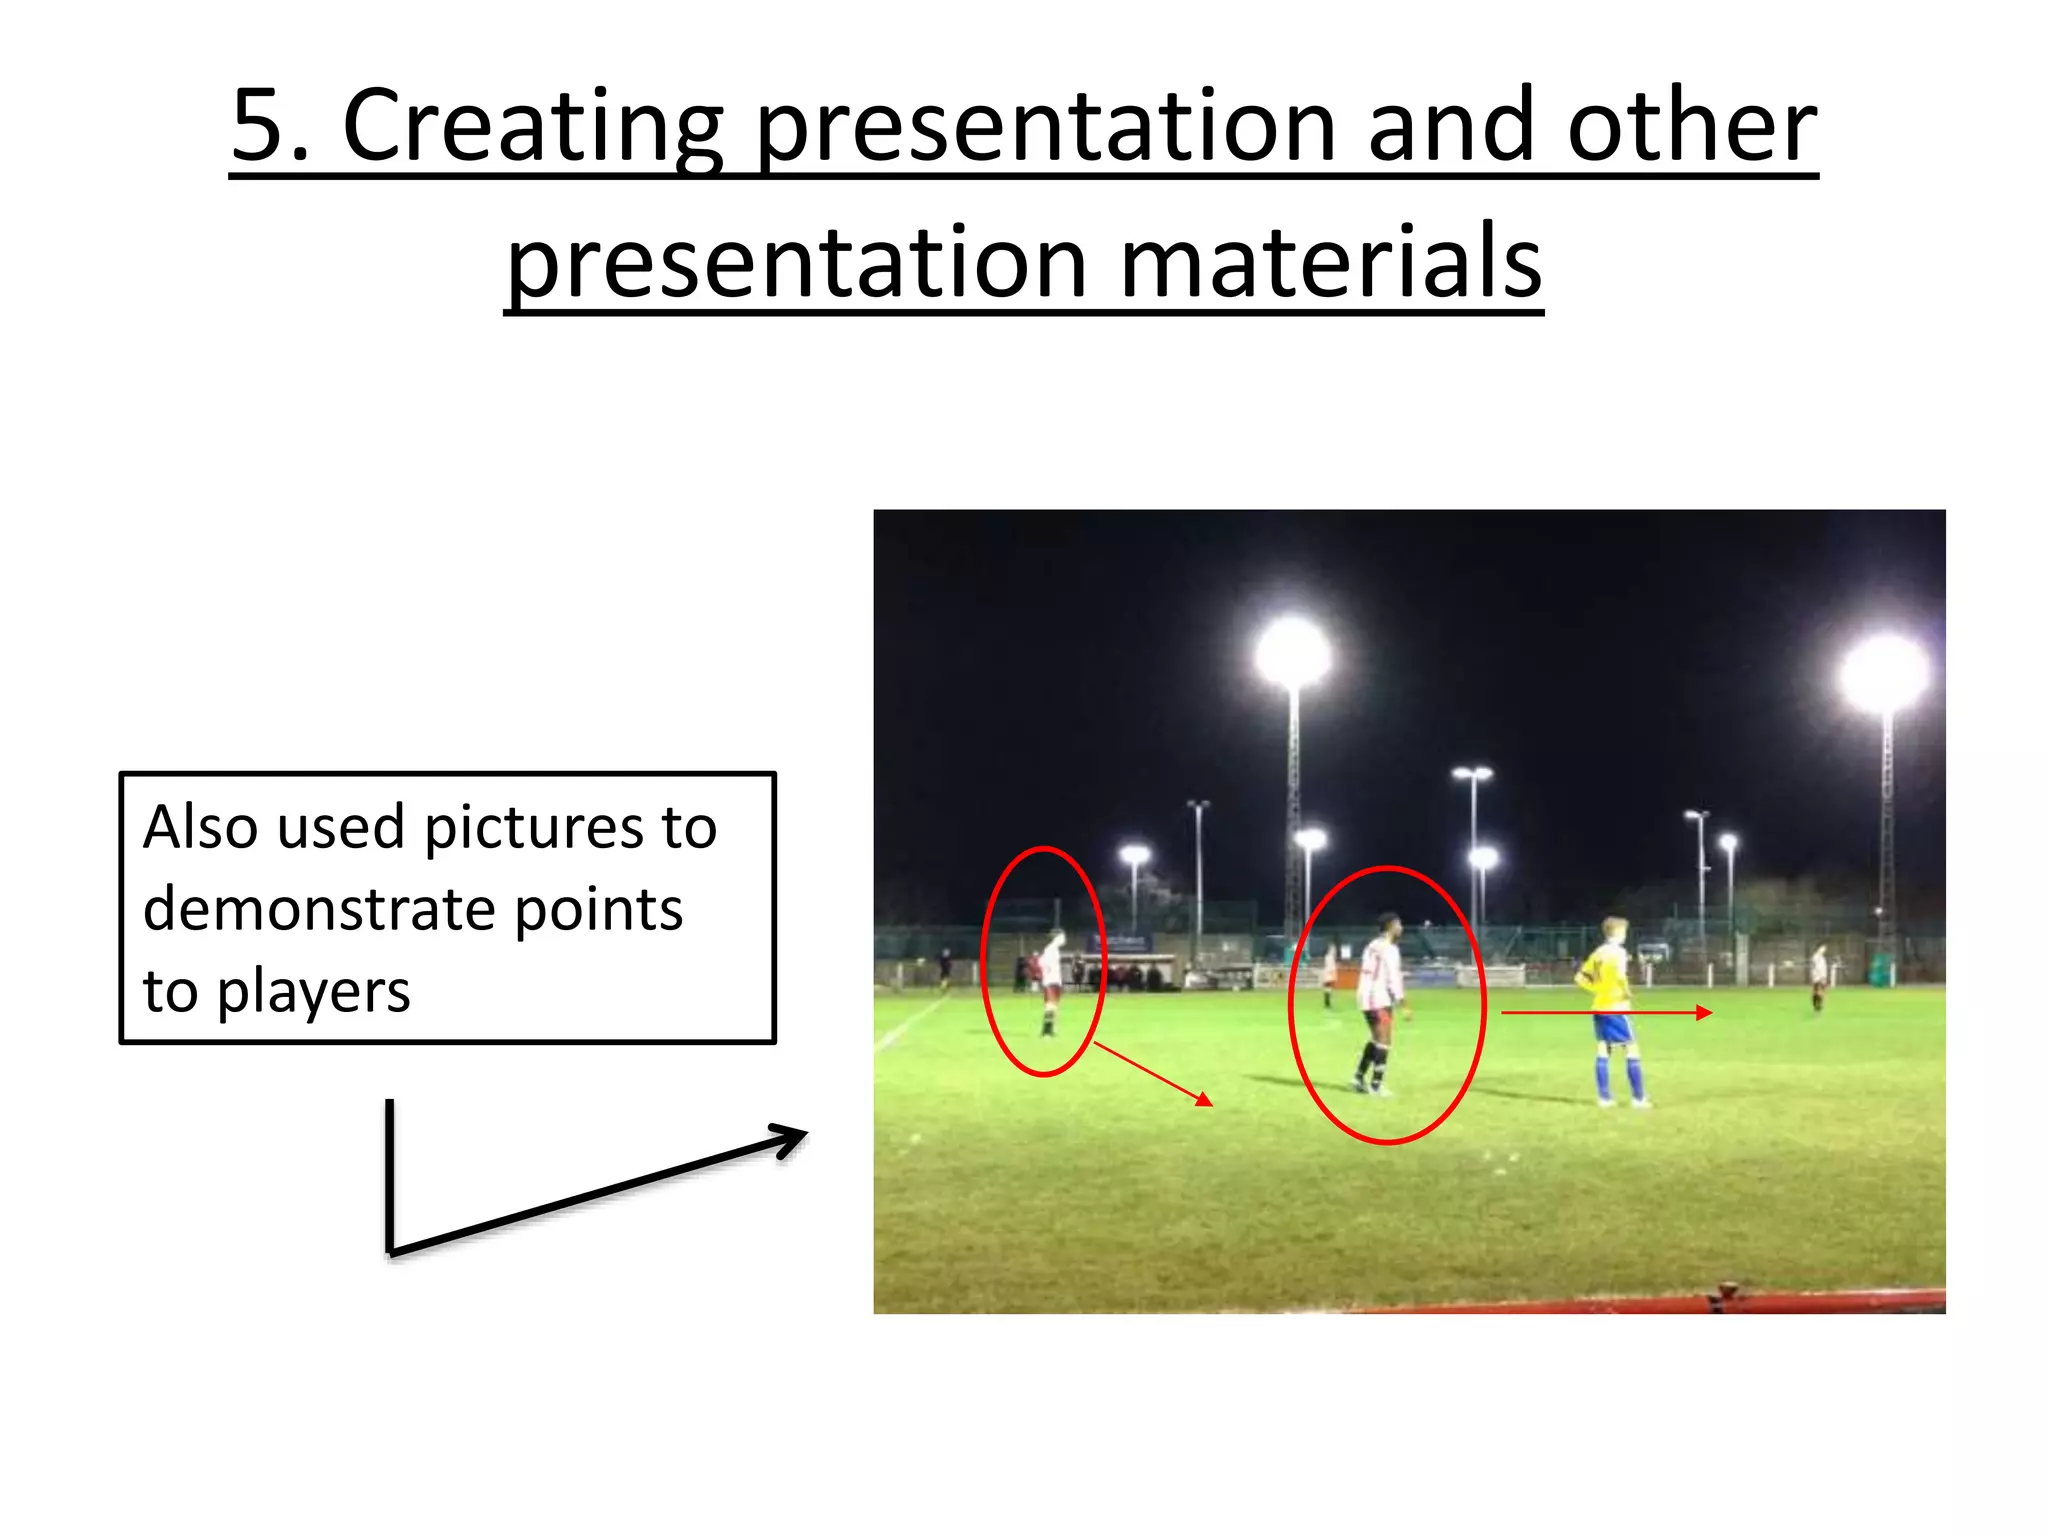
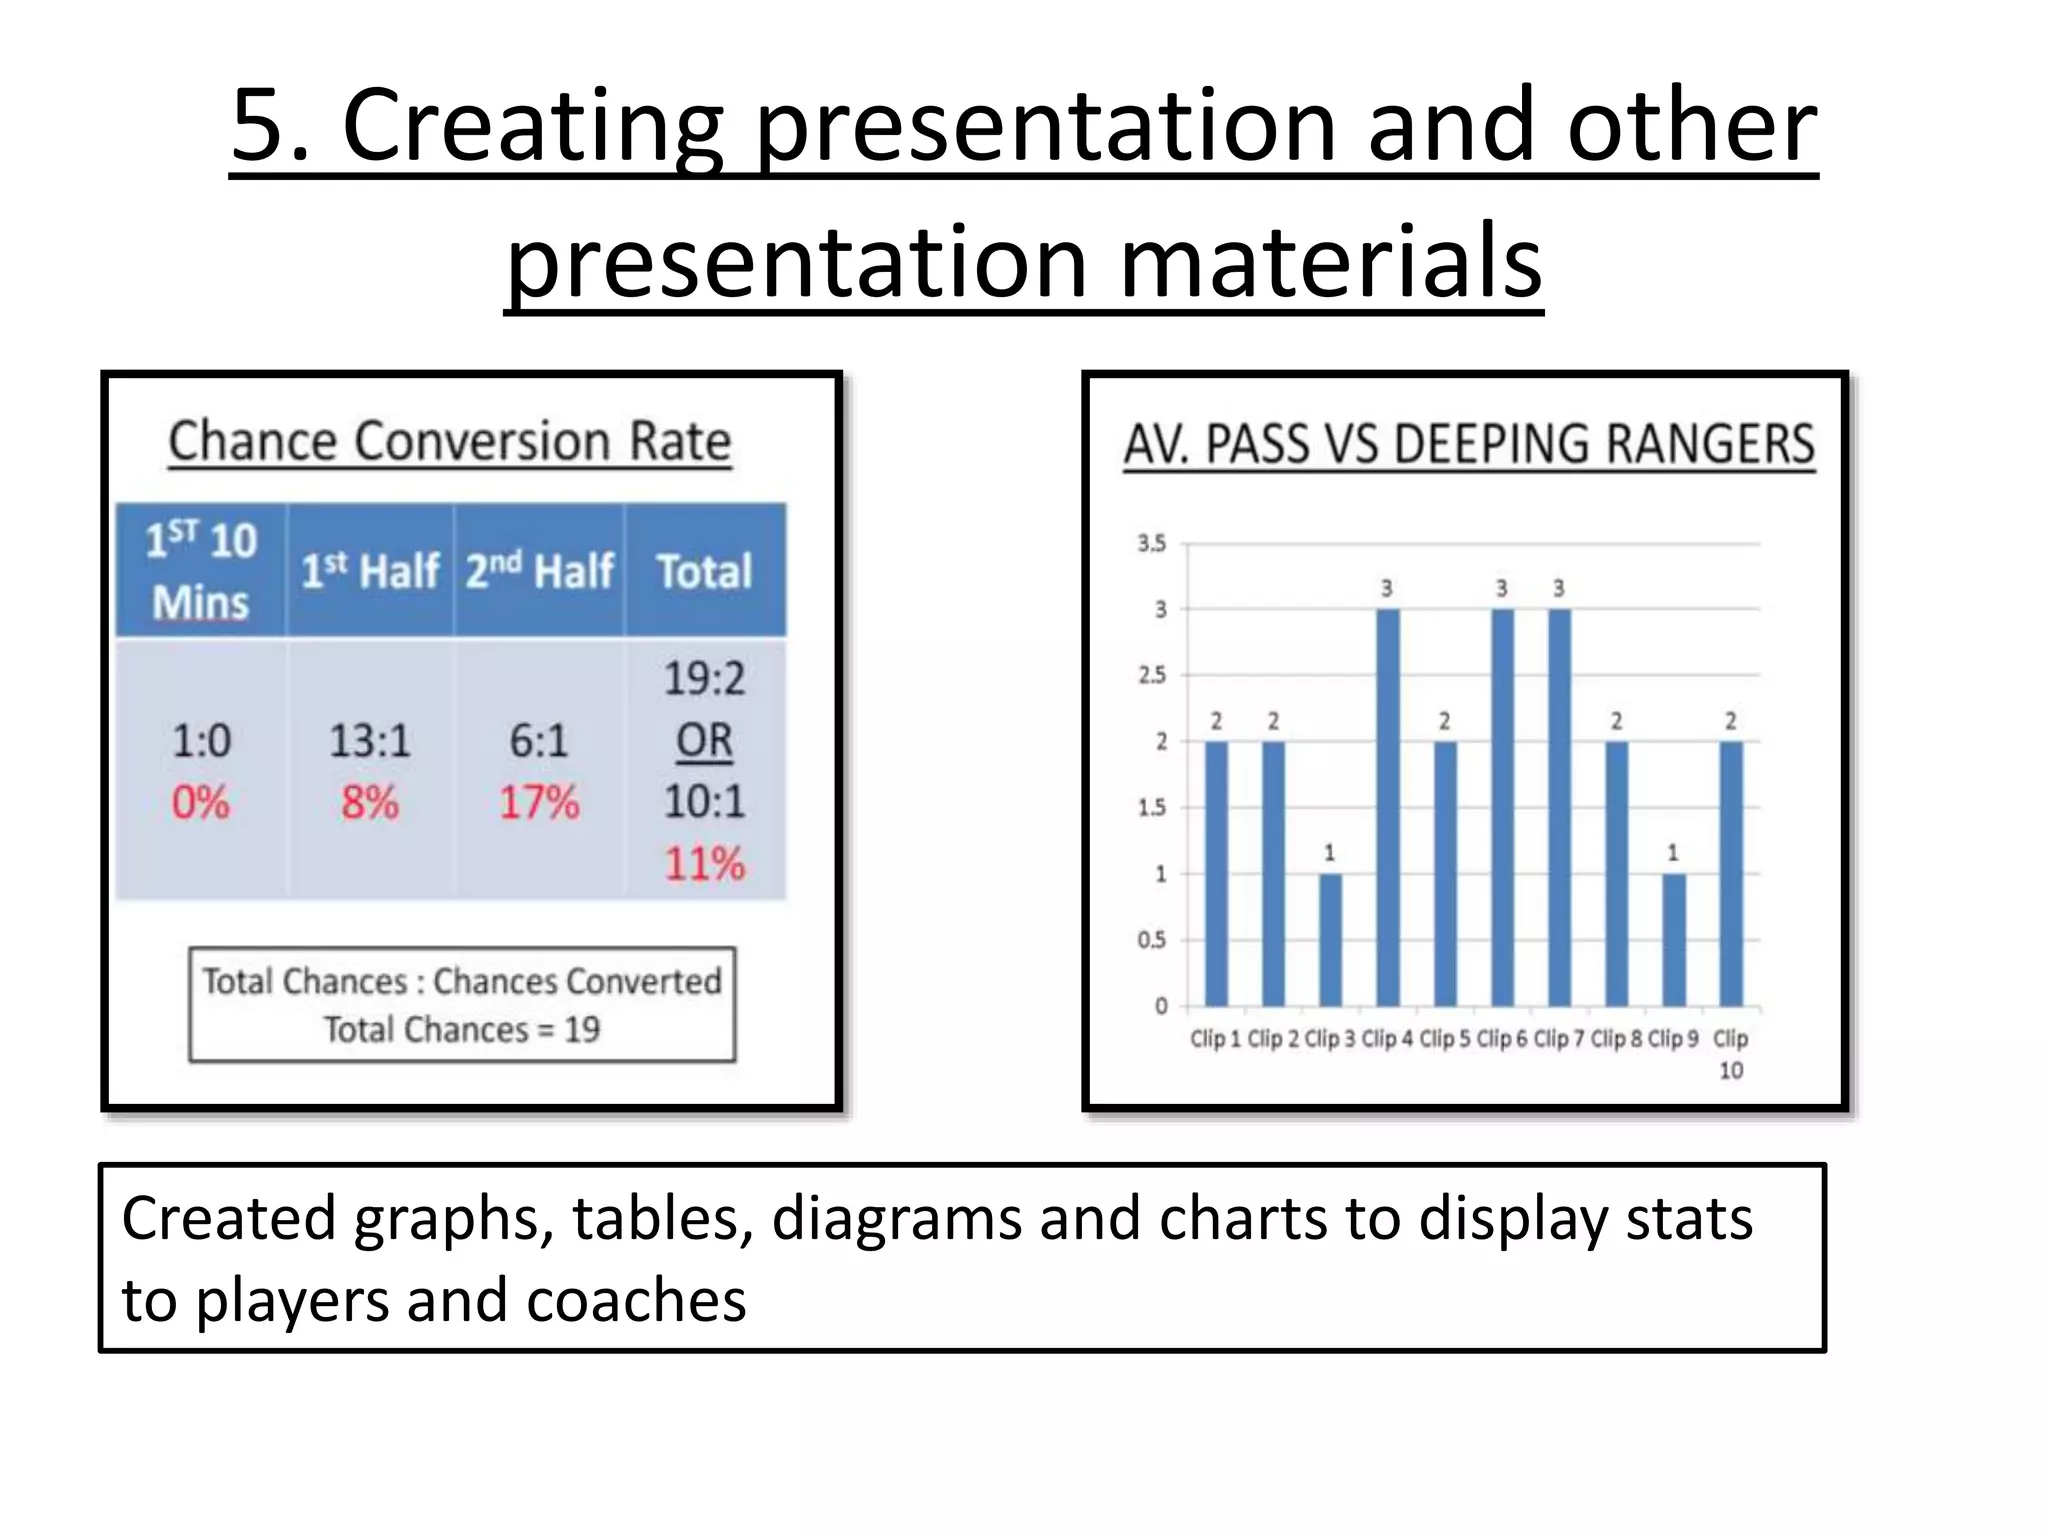
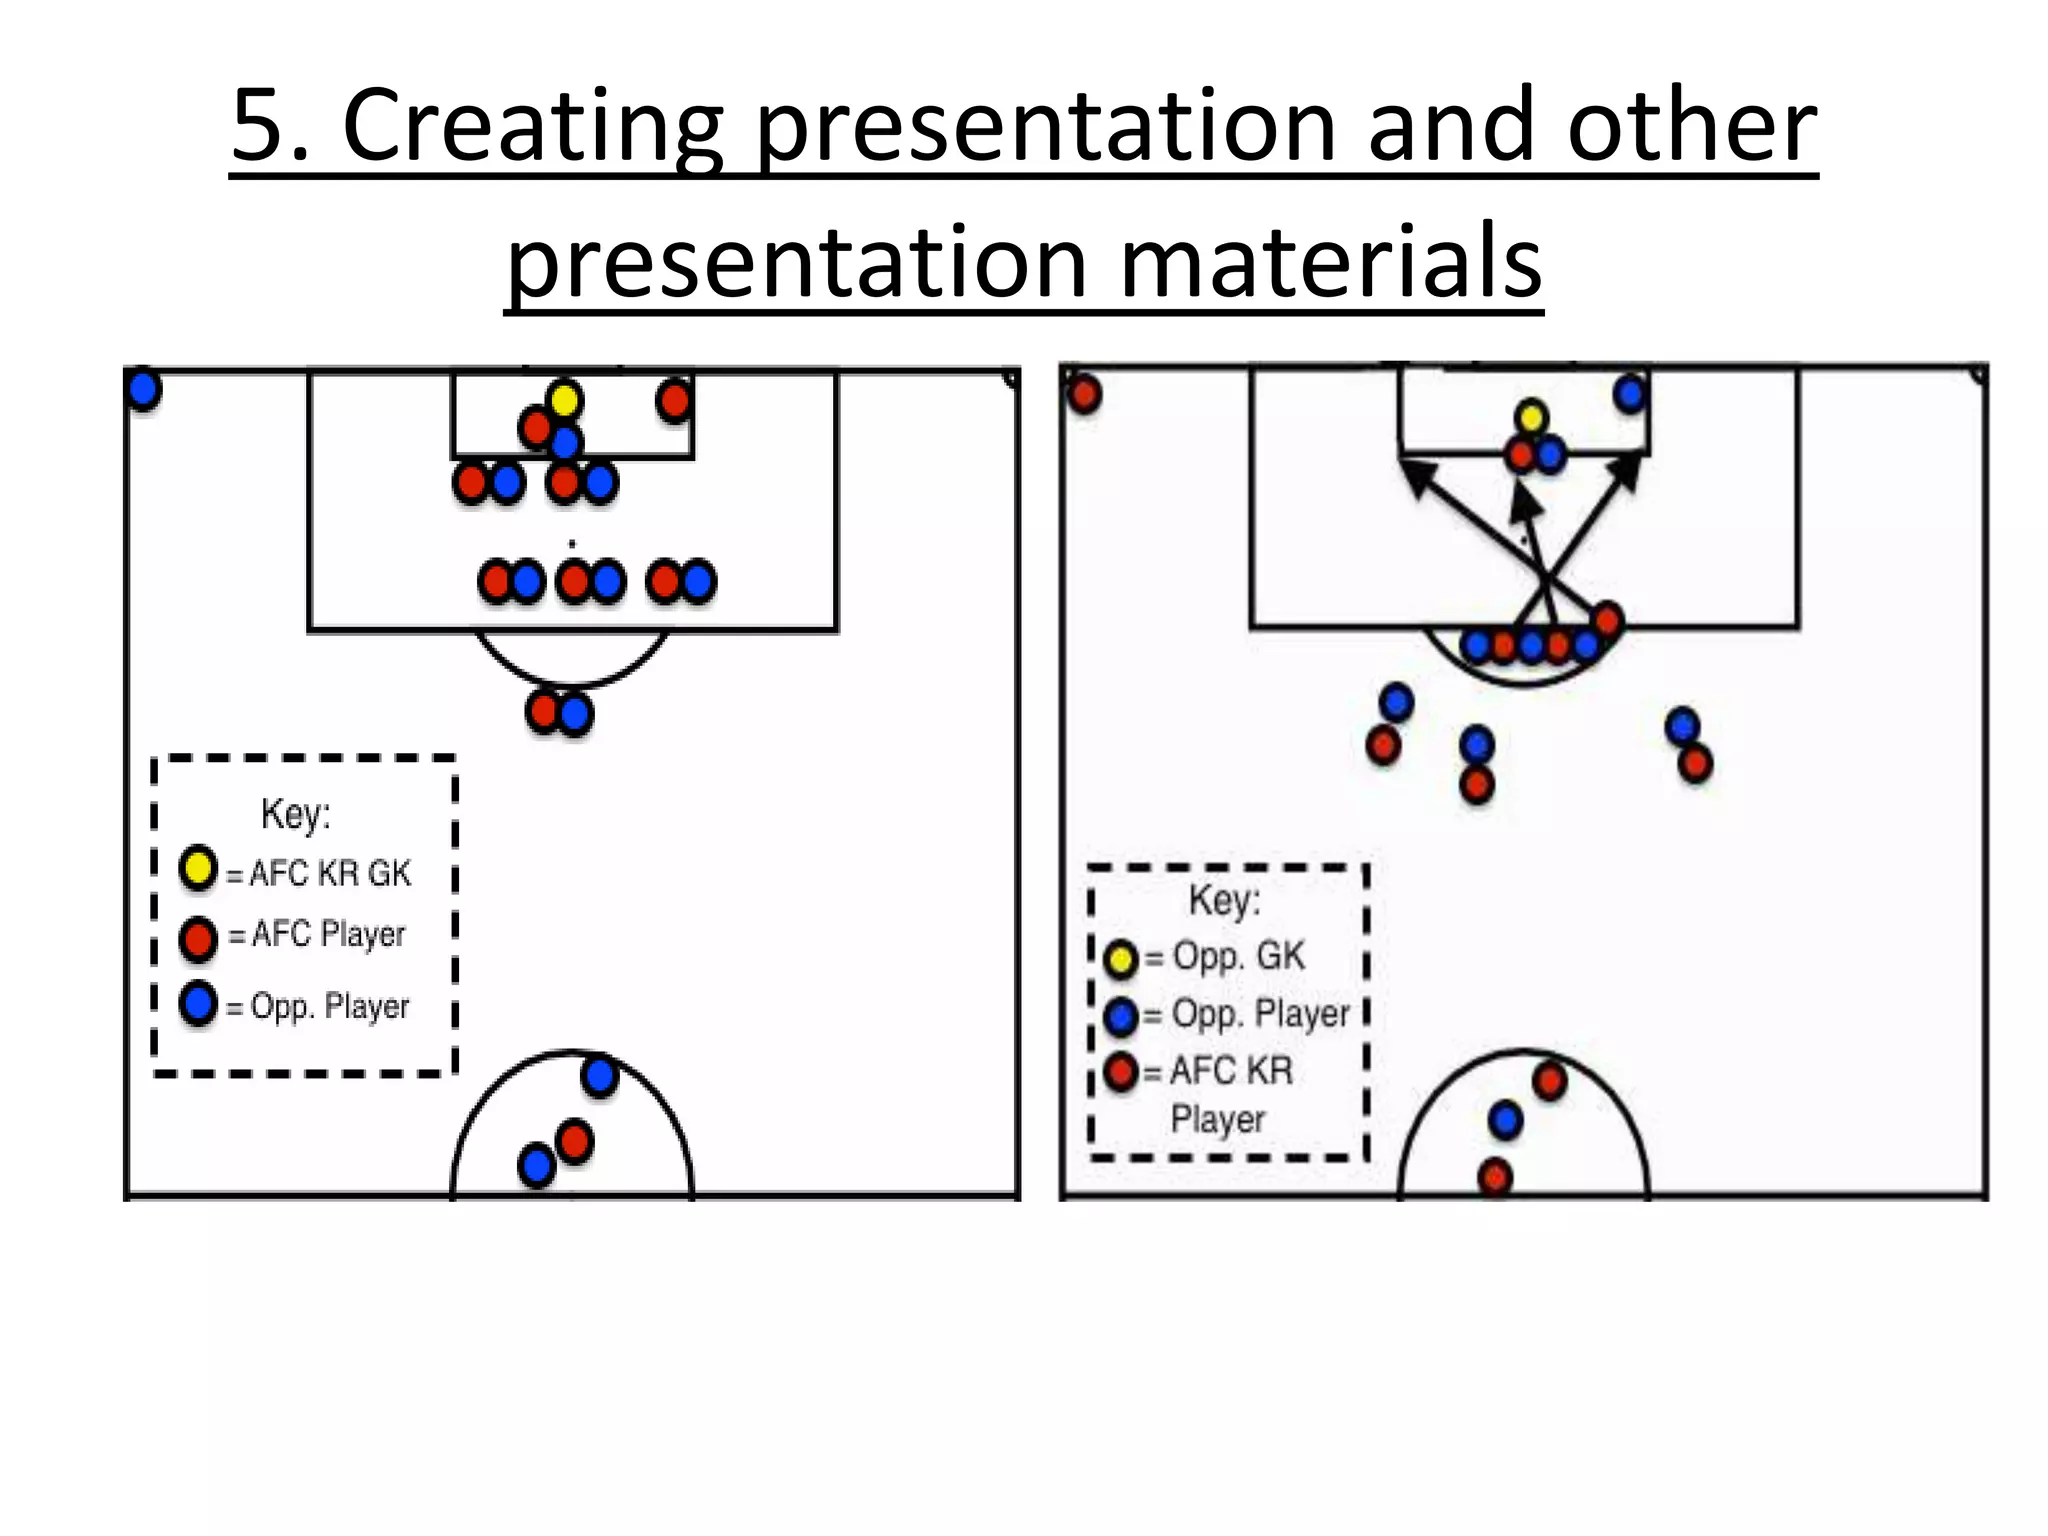
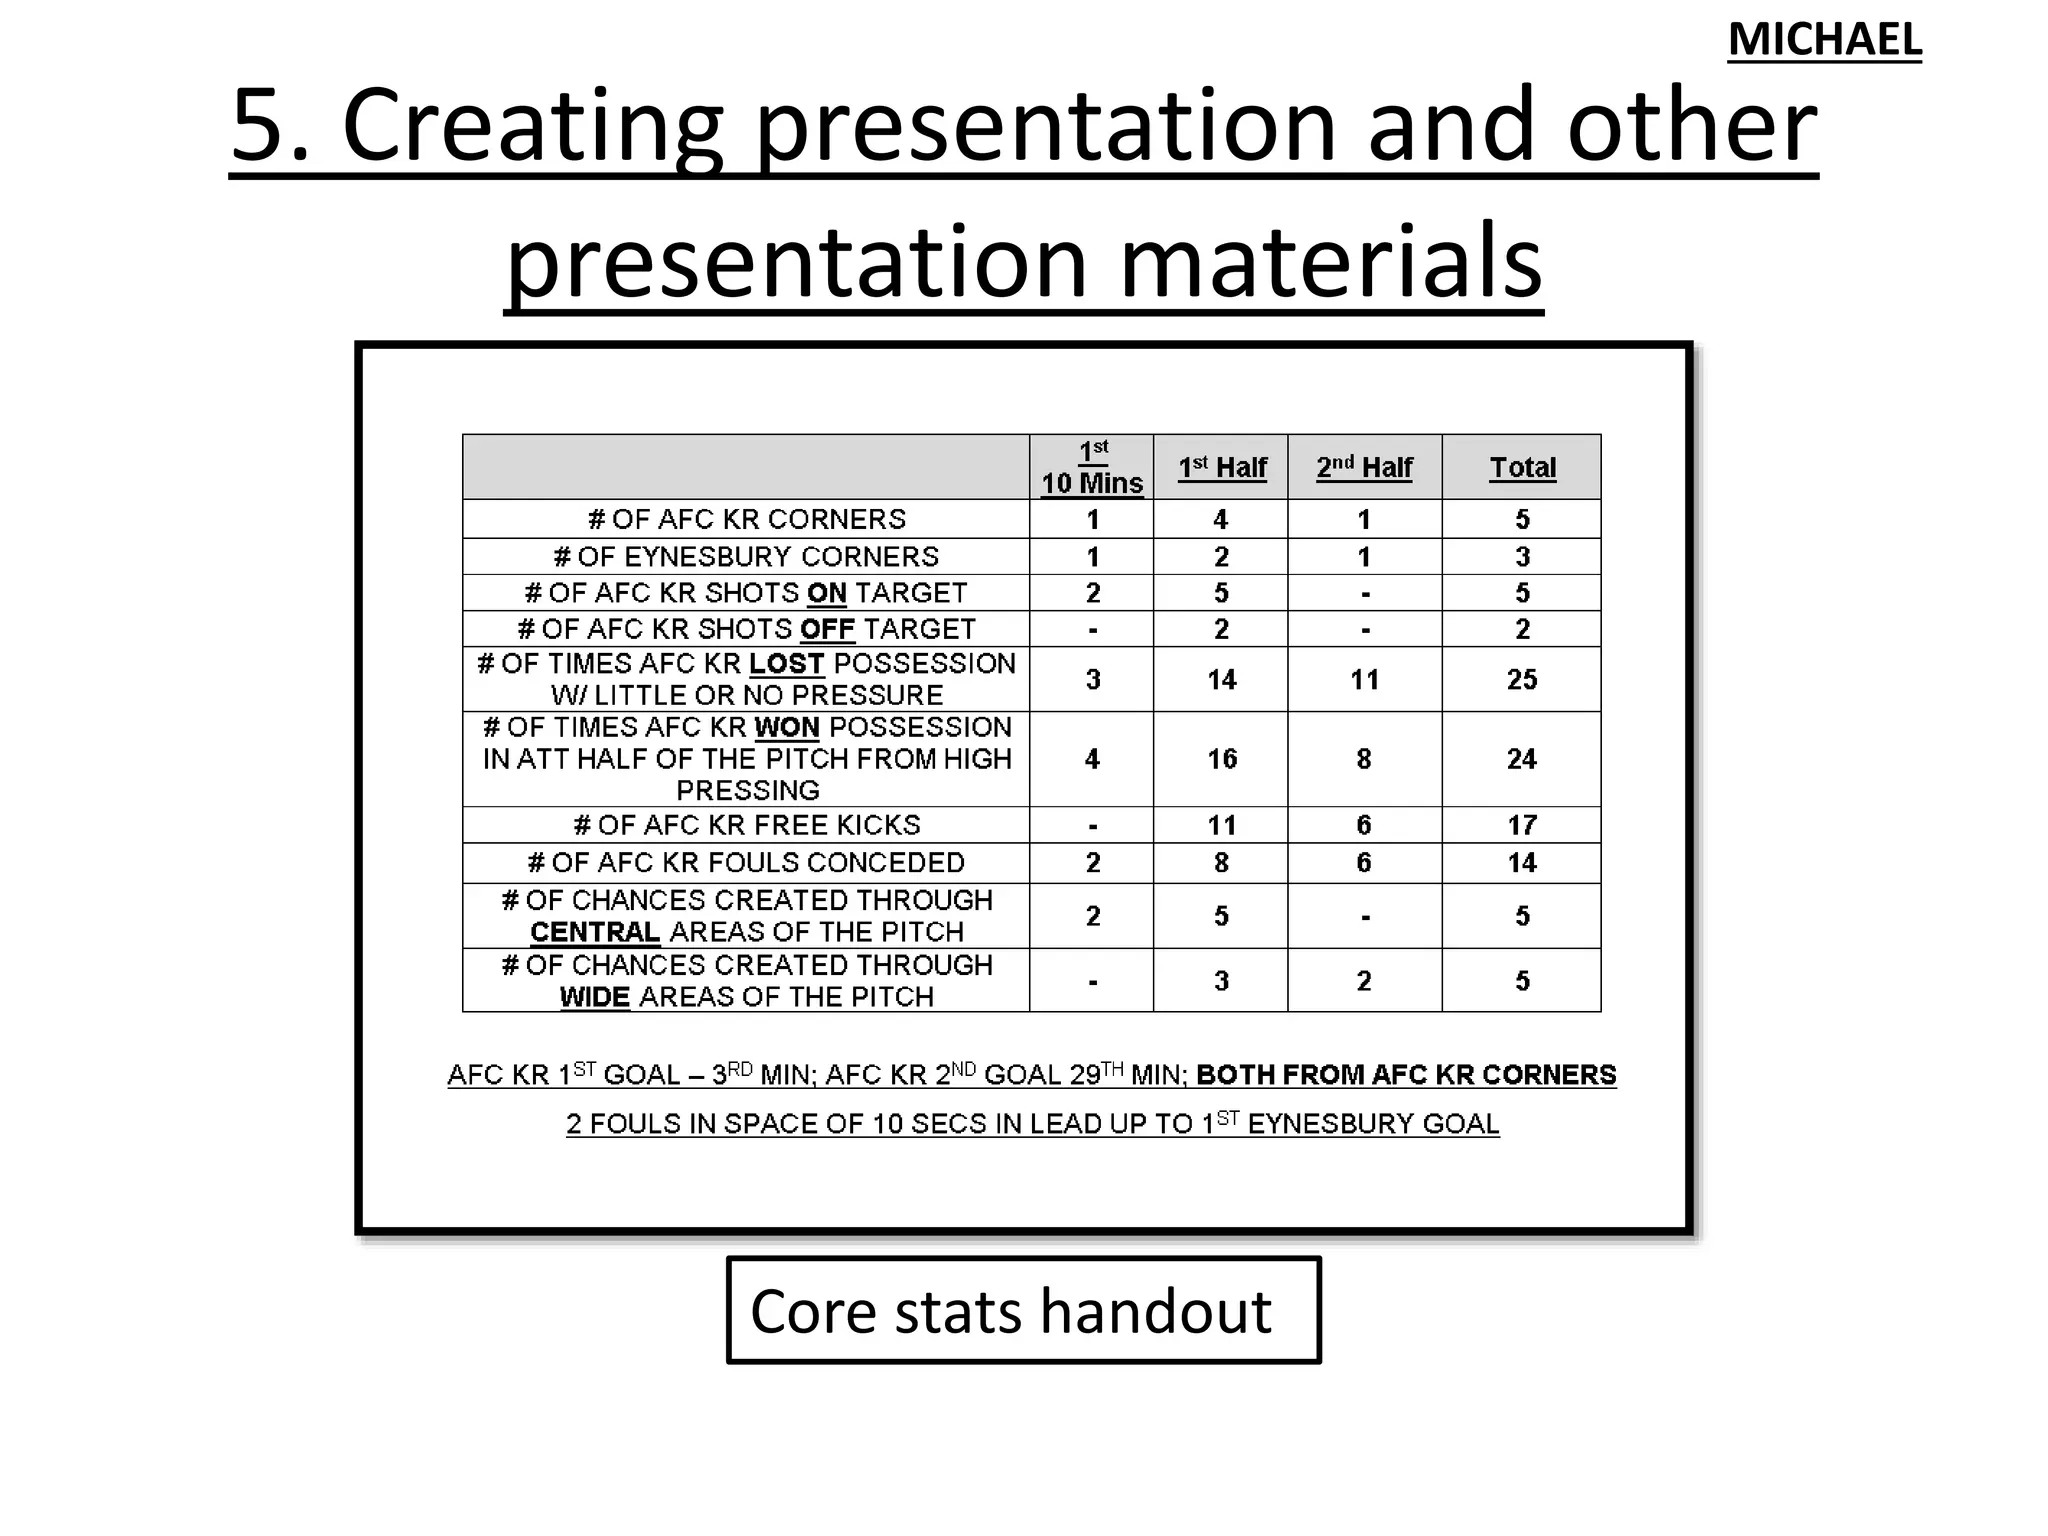
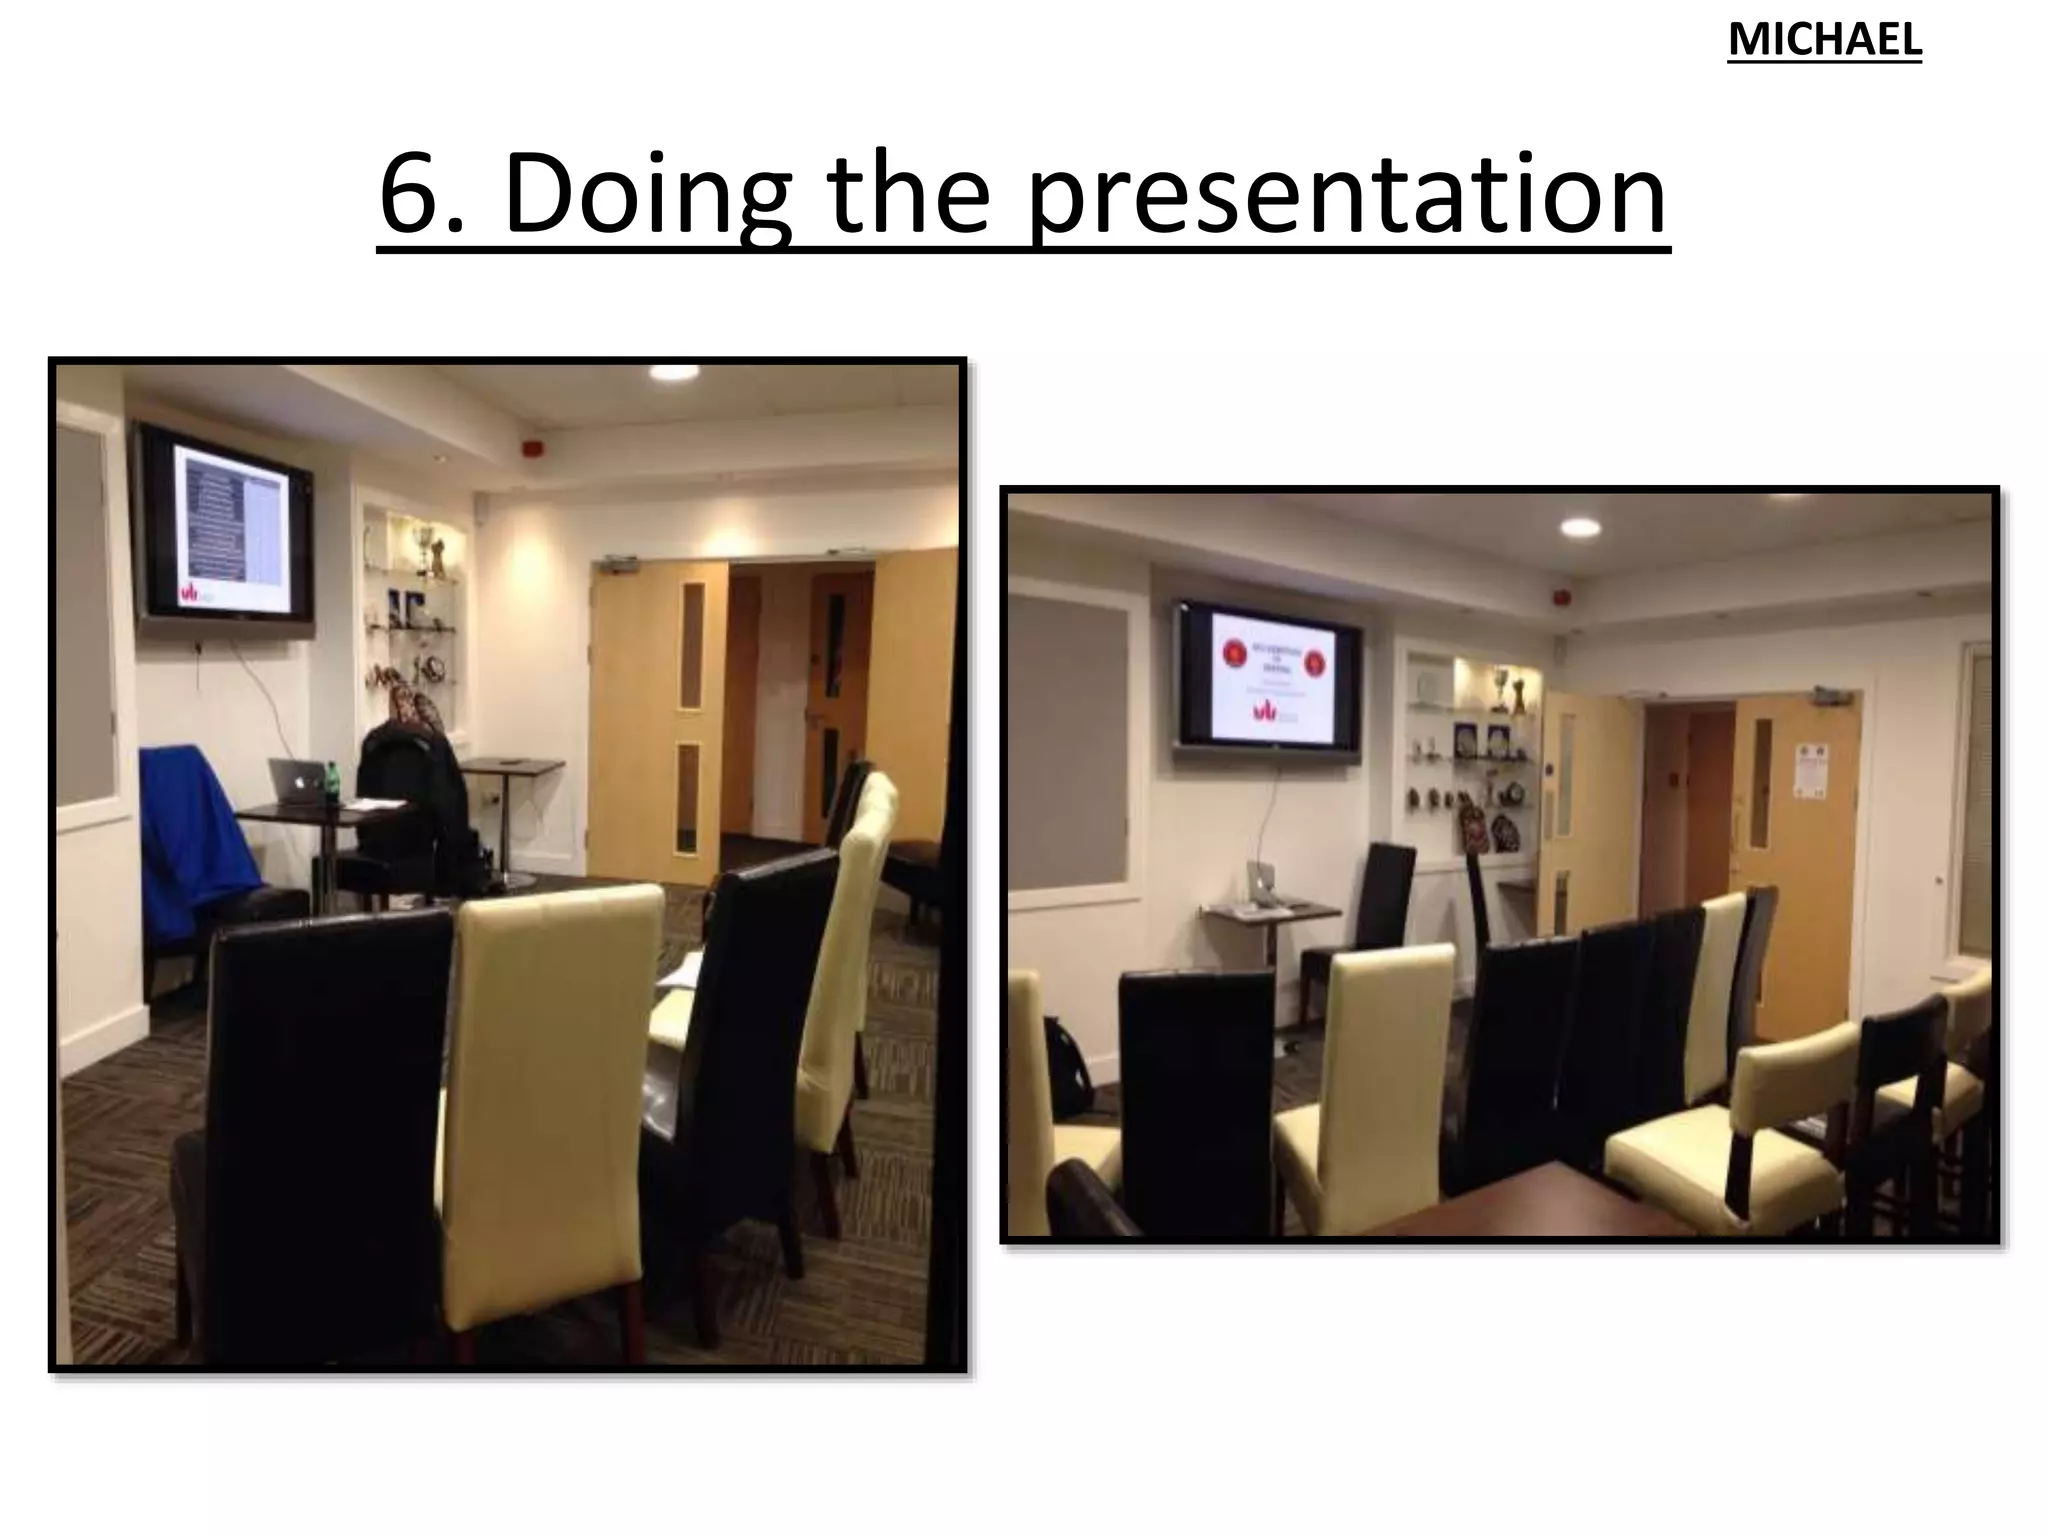
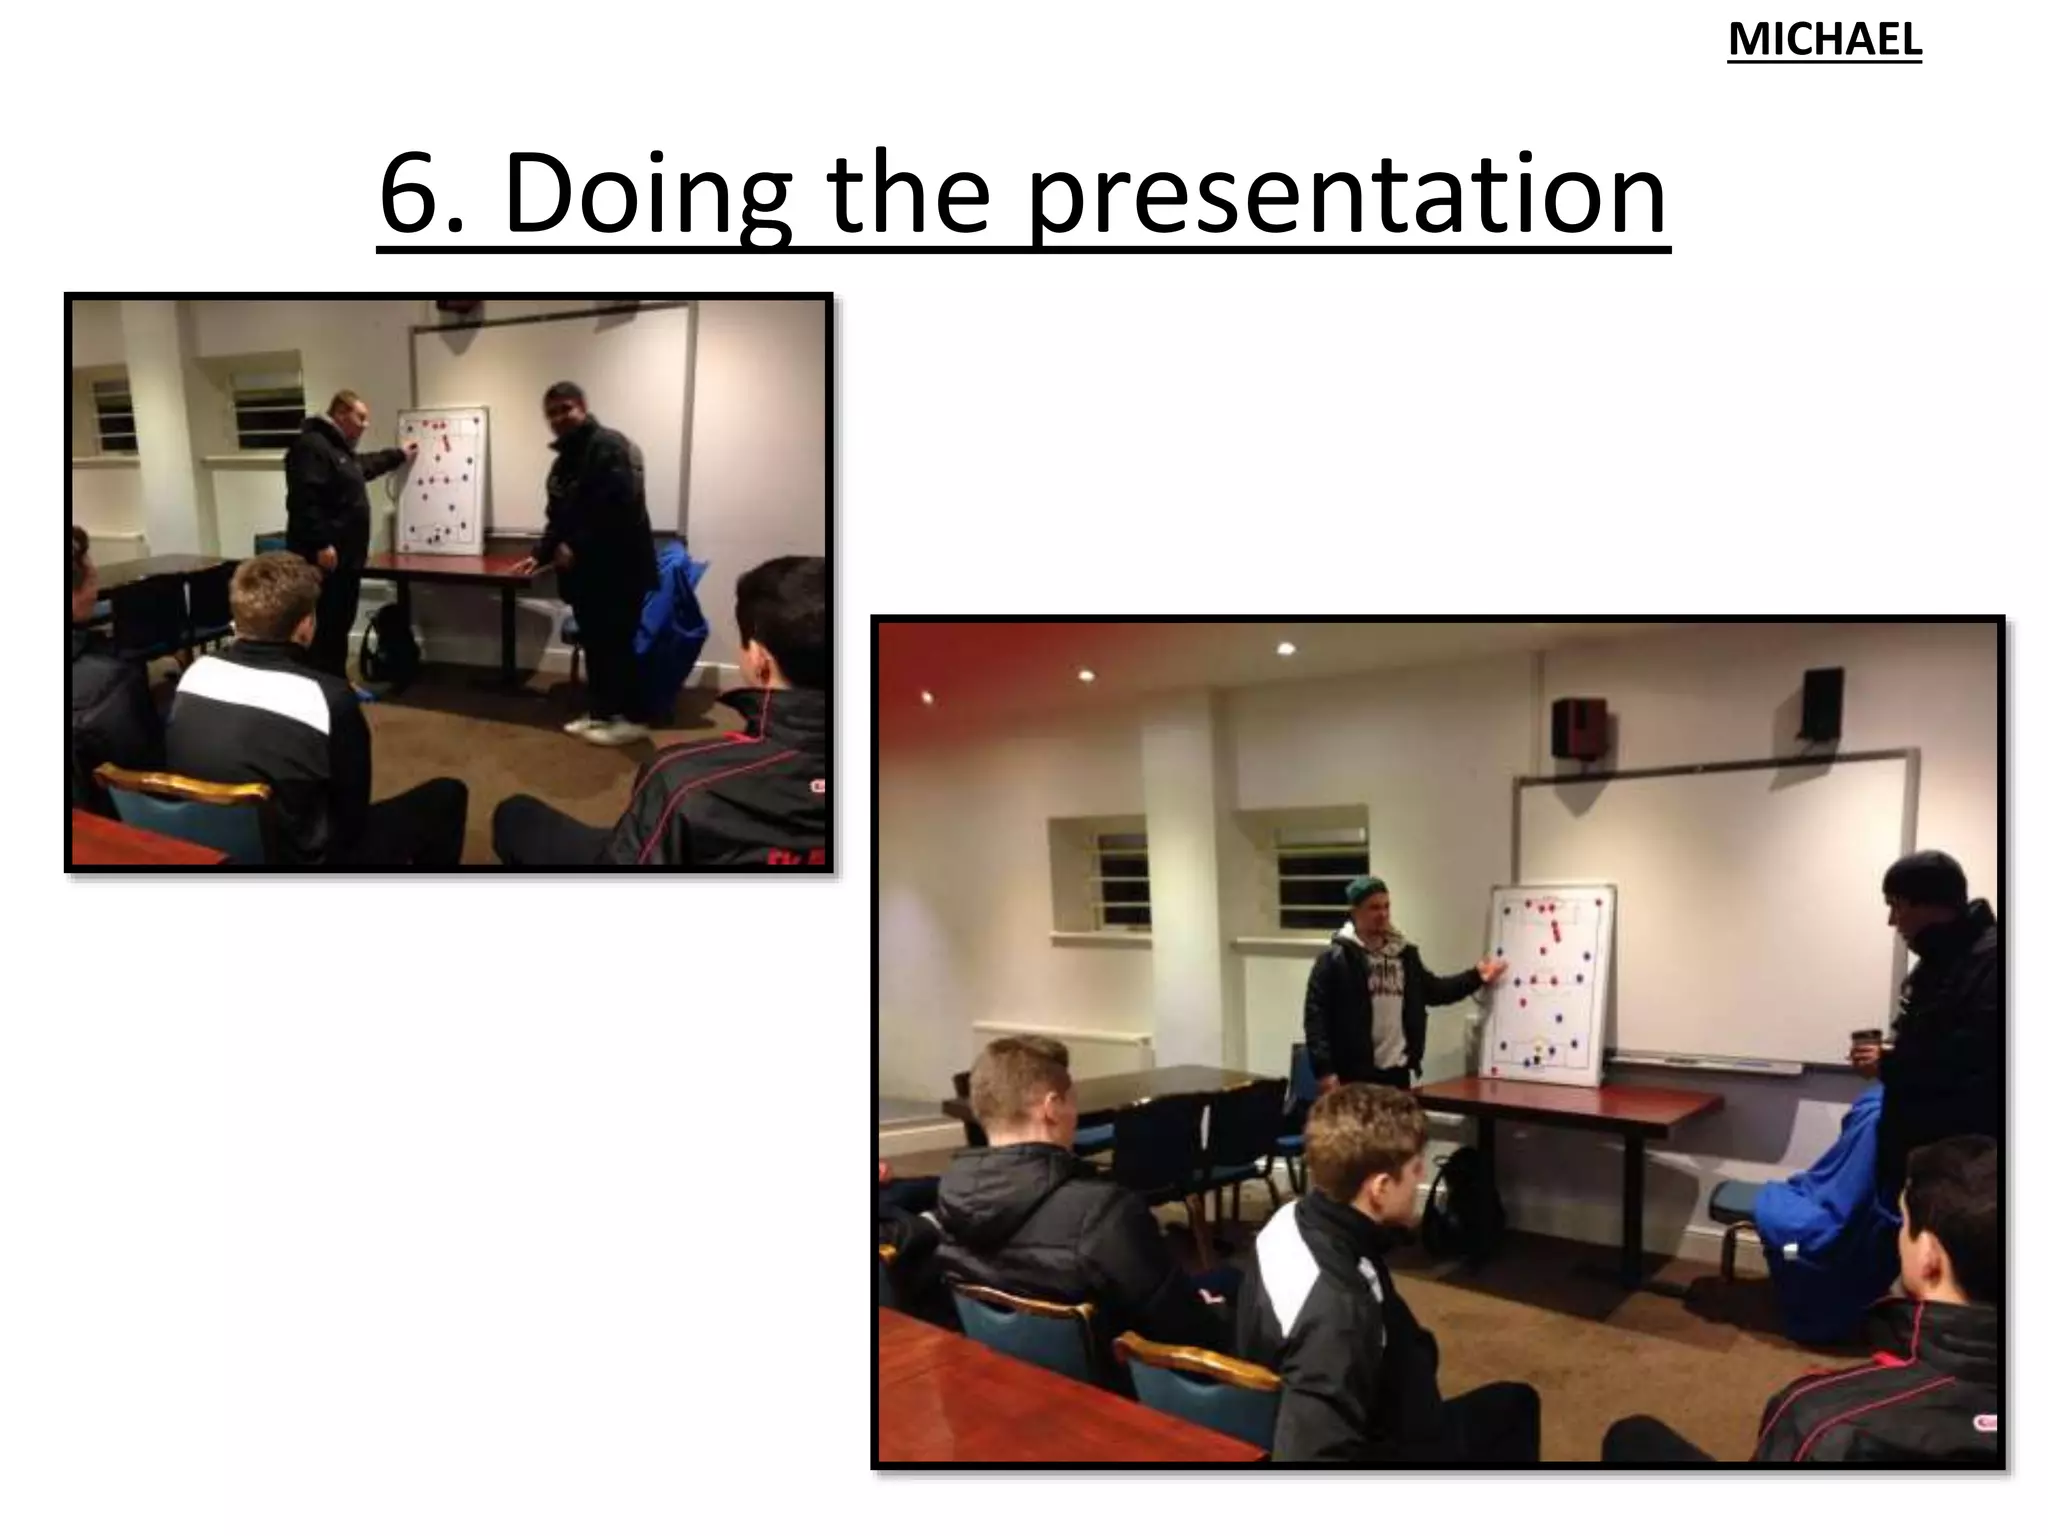
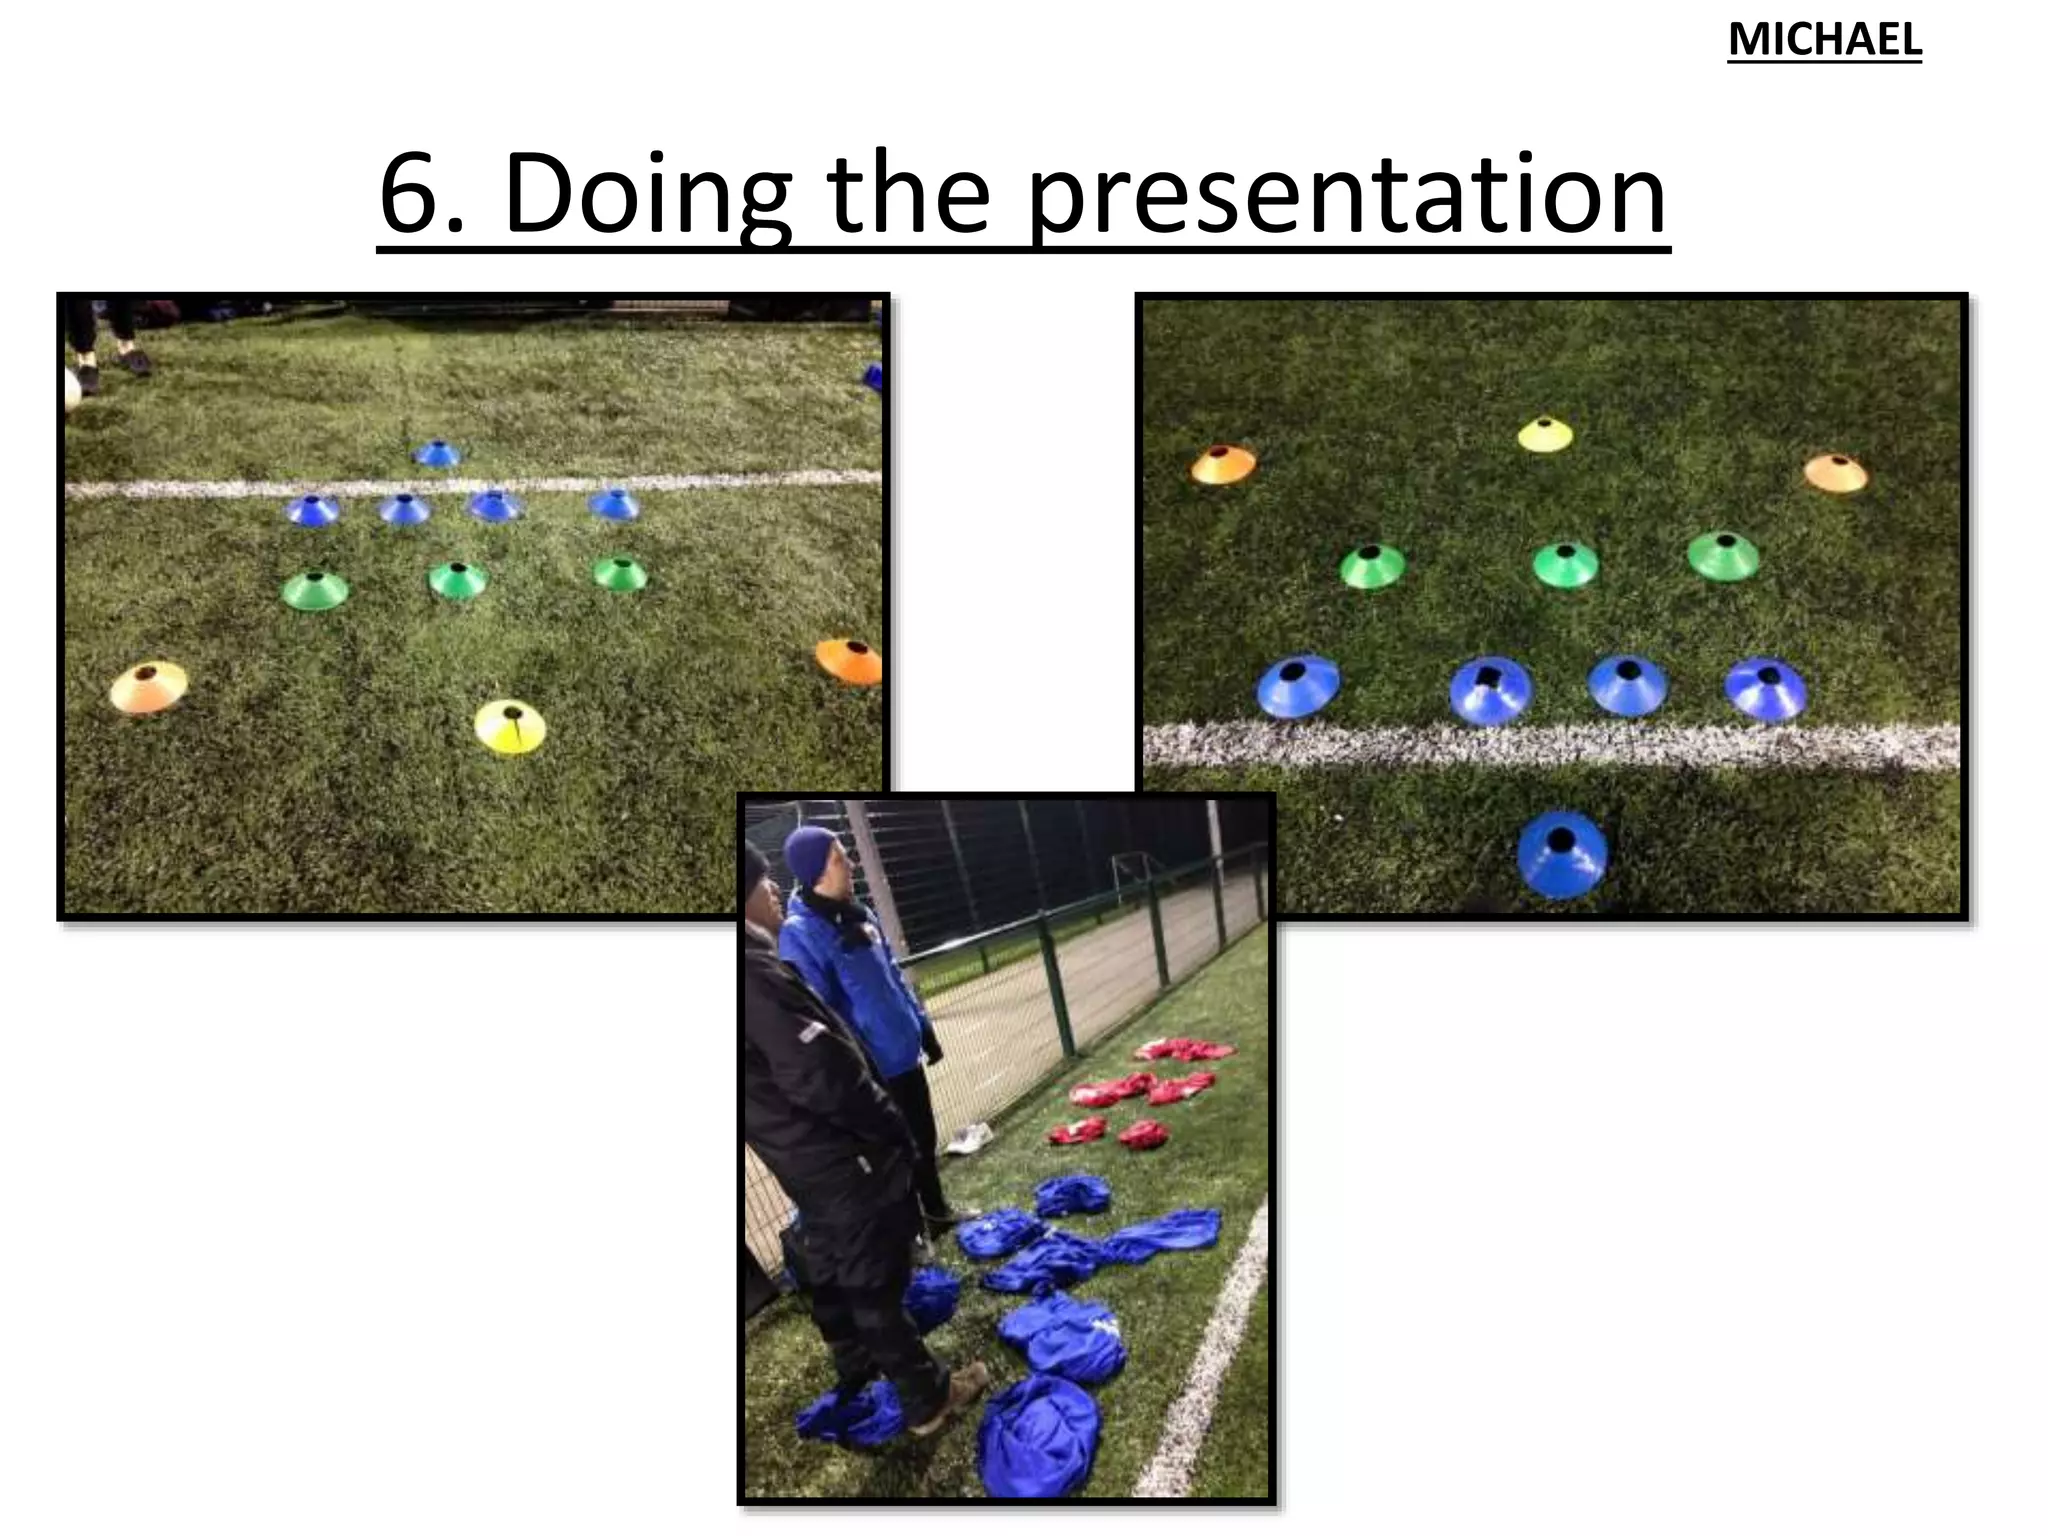
Performance Analysis Guide
What It Is & How It’s Done
AFC Kempston Rovers
2015/16 Season
By Michael Malone
BSc (H) Sports Science and Coaching
Presentation Order
• Performance Analysis – What it is, what
its used for and both advantages and
disadvantages of the technology
• What we were asked you to do
• How we went about it
• Results/Outcomes
Performance Analysis – What is it?
Can be defined as ‘an objective way of recording
performance so that key elements of that
performance can be used to try to get a positive
change in athlete performance’
- English Institute of Sport & International Society of
Performance Analysis of Sport (ISPAS)
(http://www.eis2win.co.uk/pages/Performance_Analysis.aspx)
(http://www.ispas.org/ )
Performance Analysis – What is it?
Research shows that on average, athletes and coaches
can only recall 30% of performance correctly -
performance analysis helps with the remaining 70%.’
- English Institute of Sport
(http://www.eis2win.co.uk/pages/Performance_Analysis.aspx)
Advantages & Disadvantages of
Analysis Technology
• Allows for coach to see the footage multiple
times
• Prevents human error in recalling events
• Much quicker process than by hand
• Technology – it CAN breakdown
• Equipment can be expensive
• Even though it is quicker than when done by
hand, it can take a while to produce the goods
What is it used for?
Its uses can be applied to many different sporting environments.
There are 4 main uses for it; reduce injuries (rehab), improve
performance, maximise training gains and also to identify
strengths/weaknesses of athletes performance or opposition
performance
What we were asked to do…
1. Look at how the information given in training
was applied to the game i.e. tactics
2. General mistakes, good play, AFC KR patterns,
opposition patterns i.e. long ball from the
kick off
2 Main objectives…
How we went about it…
1. Initial observations & chatting with coaches and
players
2. Filmed training and matches
3. Used game breaker software to highlight specific clips
for use in presentations – KPI’s given to us by coaches
4. Used ‘Icoda’ on iPad to gain core stats
5. Created Presentation using Keynote, Visme & PPT
with graphs, tables, charts, pictures, diagrams and
videos to present to players/coaches
6. Doing Presentation
7. Player Feedback
8. Used player feedback to improvements, presentation,
filming, stats, etc.
1. Initial Observations & Chatting
Watching training and gain initial performance
markers and opinions
Chatting with coaches and players to gain
knowledge of previous games/performances,
patterns and tactics used
1. Initial Observations & Chatting
2. Filming training & matches
3. Using Game Breaker software
Used KPI’s given to us by coaches – 3 main
categories; In Possession, Out of Possession,
Transition
Used our own personal knowledge to identify
patterns, etc.
3. Using GB software
Using the code window to
isolate clips that could be
used in presentation
Also, gained knowledge
of how to draw on the
video to display a point
4. Using ‘Icoda’ on iPad
Able to time
amount of
possession and in
what areas
Tallying core stats like shots
on target, shots off target,
chances, corners, free kicks,
etc.
5. Creating presentation and other
presentation materials
Used 3 different software's to produce presentations; Microsoft
PowerPoint, Keynote and Visme online presentations
5. Creating presentation and other
presentation materials
Microsoft
PowerPoint
5. Creating presentation and other
presentation materials
Keynote
Presentation
Software
5. Creating presentation and other
presentation materials
VISME – Online
presentations
5. Creating presentation and other
presentation materials
Used bloopers and funny
bits we found to introduce
the presentation –
icebreaker
5. Creating presentation and other
presentation materials
Used videos to highlight
mistakes to players as well
as positive parts of play
during the game and any
KPI’s given to us by the
coaches
KPI = Key Performance Indicators
5. Creating presentation and other
presentation materials
Also used pictures to
demonstrate points
to players
5. Creating presentation and other
presentation materials
Used videos on
YouTube to highlight
errors so that the
players learn and not
just listen (especially
the under 21’s)
5. Creating presentation and other
presentation materials
Created graphs, tables, diagrams and charts to display stats
to players and coaches
5. Creating presentation and other
presentation materials
5. Creating presentation and other
presentation materials
5. Creating presentation and other
presentation materials
Compared stats with previous games to identify patterns in play
5. Creating presentation and other
presentation materials
ADAM
Individual stats – Shots, Headers, On Target, Off Target, etc.
5. Creating presentation and other
presentation materials
Created hand out of core stats for coaches and provided a
digital copy for players (big screen at start of
presentation)
Created DVD’s for Coaches & digital copies for players
(goals/pictures)
Met with Coaches before the presentation to run through
things and makes any tweaks
Used Bibs, Cones and Tactic board to further display
points to player
MICHAEL
5. Creating presentation and other
presentation materials
MICHAEL
Core stats handout
6. Doing the presentation
MICHAEL
6. Doing the presentation
MICHAEL
6. Doing the presentation
MICHAEL
7. Player & Coach Feedback
Chatting with players and coaches to learn what
the thought about presentation, how we could
improve it and what we did well
Asking what sort of stats they would be
interested to see based on the presentation
8. Improving on feedback
Example: Increasing amount of clips we viewed when doing
the average passes before losing possession stat
Results/Outcomes
• Improvement in performance
• Increase in understanding – watching
themselves back – ‘Seeing Is Believing’
• Offered the opportunity to work with analysis
team at Southampton FC
• Good feedback from AFC KR coaches, players
& chairman
Questions
Performance Analysis Guide - AFC Kempston

Performance Analysis Guide - AFC Kempston

  • 1.
    Performance Analysis Guide WhatIt Is & How It’s Done AFC Kempston Rovers 2015/16 Season By Michael Malone BSc (H) Sports Science and Coaching
  • 3.
    Presentation Order • PerformanceAnalysis – What it is, what its used for and both advantages and disadvantages of the technology • What we were asked you to do • How we went about it • Results/Outcomes
  • 4.
    Performance Analysis –What is it? Can be defined as ‘an objective way of recording performance so that key elements of that performance can be used to try to get a positive change in athlete performance’ - English Institute of Sport & International Society of Performance Analysis of Sport (ISPAS) (http://www.eis2win.co.uk/pages/Performance_Analysis.aspx) (http://www.ispas.org/ )
  • 5.
    Performance Analysis –What is it? Research shows that on average, athletes and coaches can only recall 30% of performance correctly - performance analysis helps with the remaining 70%.’ - English Institute of Sport (http://www.eis2win.co.uk/pages/Performance_Analysis.aspx)
  • 6.
    Advantages & Disadvantagesof Analysis Technology • Allows for coach to see the footage multiple times • Prevents human error in recalling events • Much quicker process than by hand • Technology – it CAN breakdown • Equipment can be expensive • Even though it is quicker than when done by hand, it can take a while to produce the goods
  • 7.
    What is itused for? Its uses can be applied to many different sporting environments. There are 4 main uses for it; reduce injuries (rehab), improve performance, maximise training gains and also to identify strengths/weaknesses of athletes performance or opposition performance
  • 8.
    What we wereasked to do… 1. Look at how the information given in training was applied to the game i.e. tactics 2. General mistakes, good play, AFC KR patterns, opposition patterns i.e. long ball from the kick off 2 Main objectives…
  • 9.
    How we wentabout it… 1. Initial observations & chatting with coaches and players 2. Filmed training and matches 3. Used game breaker software to highlight specific clips for use in presentations – KPI’s given to us by coaches 4. Used ‘Icoda’ on iPad to gain core stats 5. Created Presentation using Keynote, Visme & PPT with graphs, tables, charts, pictures, diagrams and videos to present to players/coaches 6. Doing Presentation 7. Player Feedback 8. Used player feedback to improvements, presentation, filming, stats, etc.
  • 10.
    1. Initial Observations& Chatting Watching training and gain initial performance markers and opinions Chatting with coaches and players to gain knowledge of previous games/performances, patterns and tactics used
  • 11.
  • 12.
  • 13.
  • 14.
  • 15.
  • 16.
    3. Using GameBreaker software Used KPI’s given to us by coaches – 3 main categories; In Possession, Out of Possession, Transition Used our own personal knowledge to identify patterns, etc.
  • 17.
    3. Using GBsoftware Using the code window to isolate clips that could be used in presentation Also, gained knowledge of how to draw on the video to display a point
  • 18.
    4. Using ‘Icoda’on iPad Able to time amount of possession and in what areas Tallying core stats like shots on target, shots off target, chances, corners, free kicks, etc.
  • 19.
    5. Creating presentationand other presentation materials Used 3 different software's to produce presentations; Microsoft PowerPoint, Keynote and Visme online presentations
  • 20.
    5. Creating presentationand other presentation materials Microsoft PowerPoint
  • 21.
    5. Creating presentationand other presentation materials Keynote Presentation Software
  • 22.
    5. Creating presentationand other presentation materials VISME – Online presentations
  • 23.
    5. Creating presentationand other presentation materials Used bloopers and funny bits we found to introduce the presentation – icebreaker
  • 24.
    5. Creating presentationand other presentation materials Used videos to highlight mistakes to players as well as positive parts of play during the game and any KPI’s given to us by the coaches KPI = Key Performance Indicators
  • 26.
    5. Creating presentationand other presentation materials Also used pictures to demonstrate points to players
  • 27.
    5. Creating presentationand other presentation materials Used videos on YouTube to highlight errors so that the players learn and not just listen (especially the under 21’s)
  • 28.
    5. Creating presentationand other presentation materials Created graphs, tables, diagrams and charts to display stats to players and coaches
  • 29.
    5. Creating presentationand other presentation materials
  • 30.
    5. Creating presentationand other presentation materials
  • 31.
    5. Creating presentationand other presentation materials Compared stats with previous games to identify patterns in play
  • 32.
    5. Creating presentationand other presentation materials ADAM Individual stats – Shots, Headers, On Target, Off Target, etc.
  • 33.
    5. Creating presentationand other presentation materials Created hand out of core stats for coaches and provided a digital copy for players (big screen at start of presentation) Created DVD’s for Coaches & digital copies for players (goals/pictures) Met with Coaches before the presentation to run through things and makes any tweaks Used Bibs, Cones and Tactic board to further display points to player MICHAEL
  • 34.
    5. Creating presentationand other presentation materials MICHAEL Core stats handout
  • 35.
    6. Doing thepresentation MICHAEL
  • 36.
    6. Doing thepresentation MICHAEL
  • 37.
    6. Doing thepresentation MICHAEL
  • 38.
    7. Player &Coach Feedback Chatting with players and coaches to learn what the thought about presentation, how we could improve it and what we did well Asking what sort of stats they would be interested to see based on the presentation
  • 39.
    8. Improving onfeedback Example: Increasing amount of clips we viewed when doing the average passes before losing possession stat
  • 40.
    Results/Outcomes • Improvement inperformance • Increase in understanding – watching themselves back – ‘Seeing Is Believing’ • Offered the opportunity to work with analysis team at Southampton FC • Good feedback from AFC KR coaches, players & chairman
  • 41.