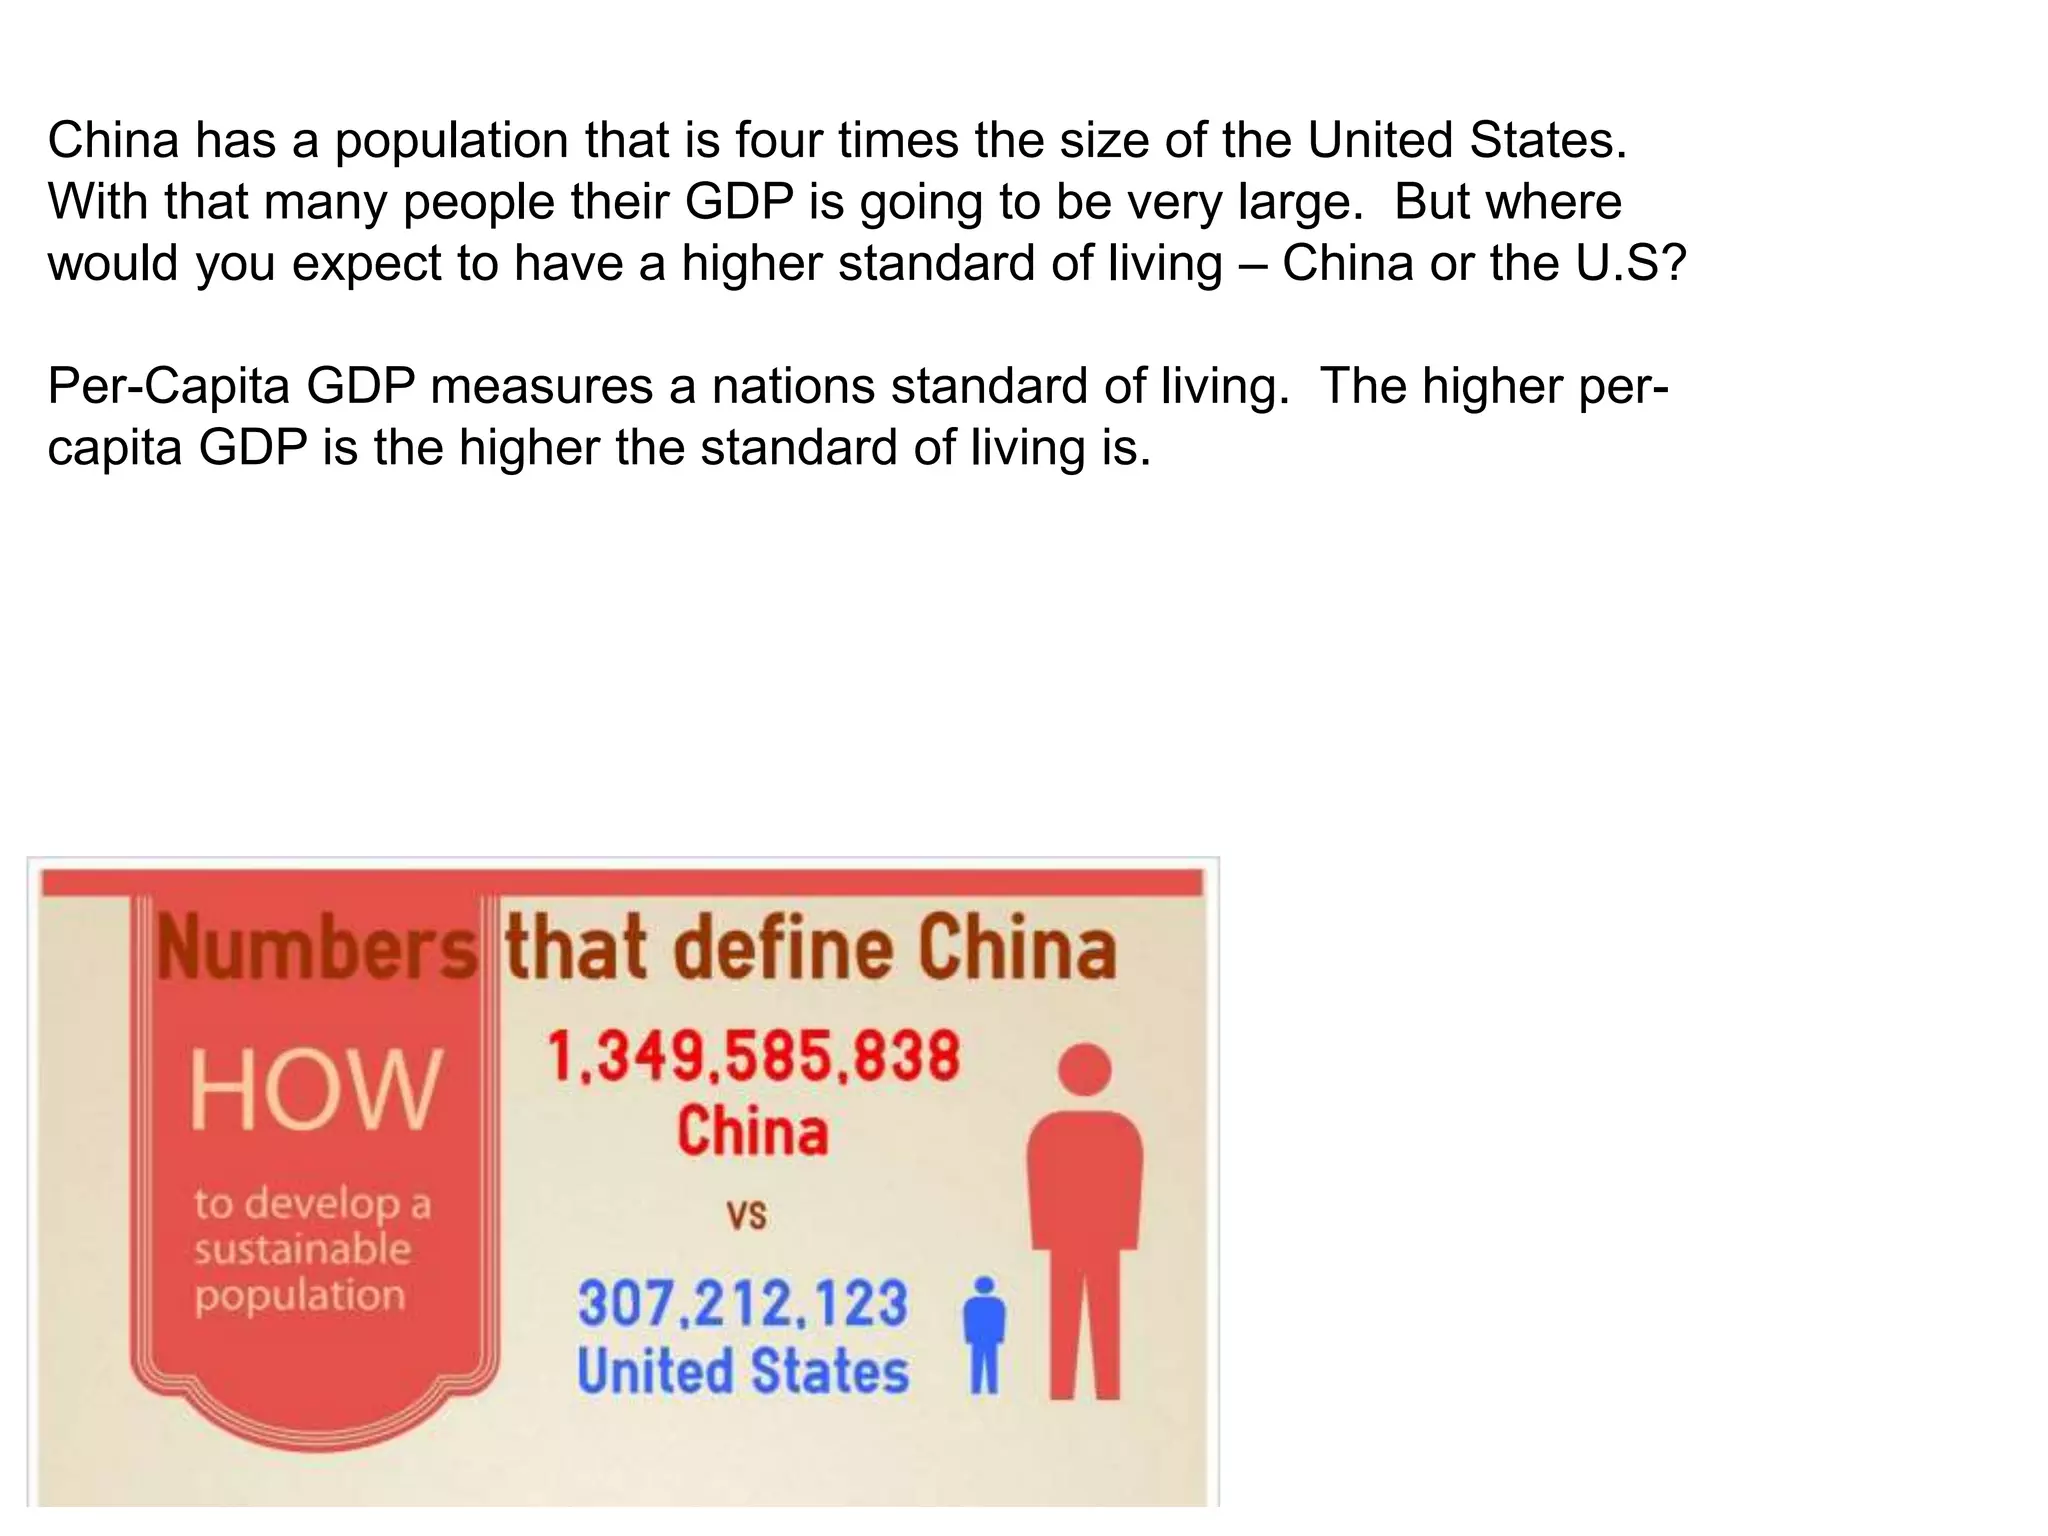
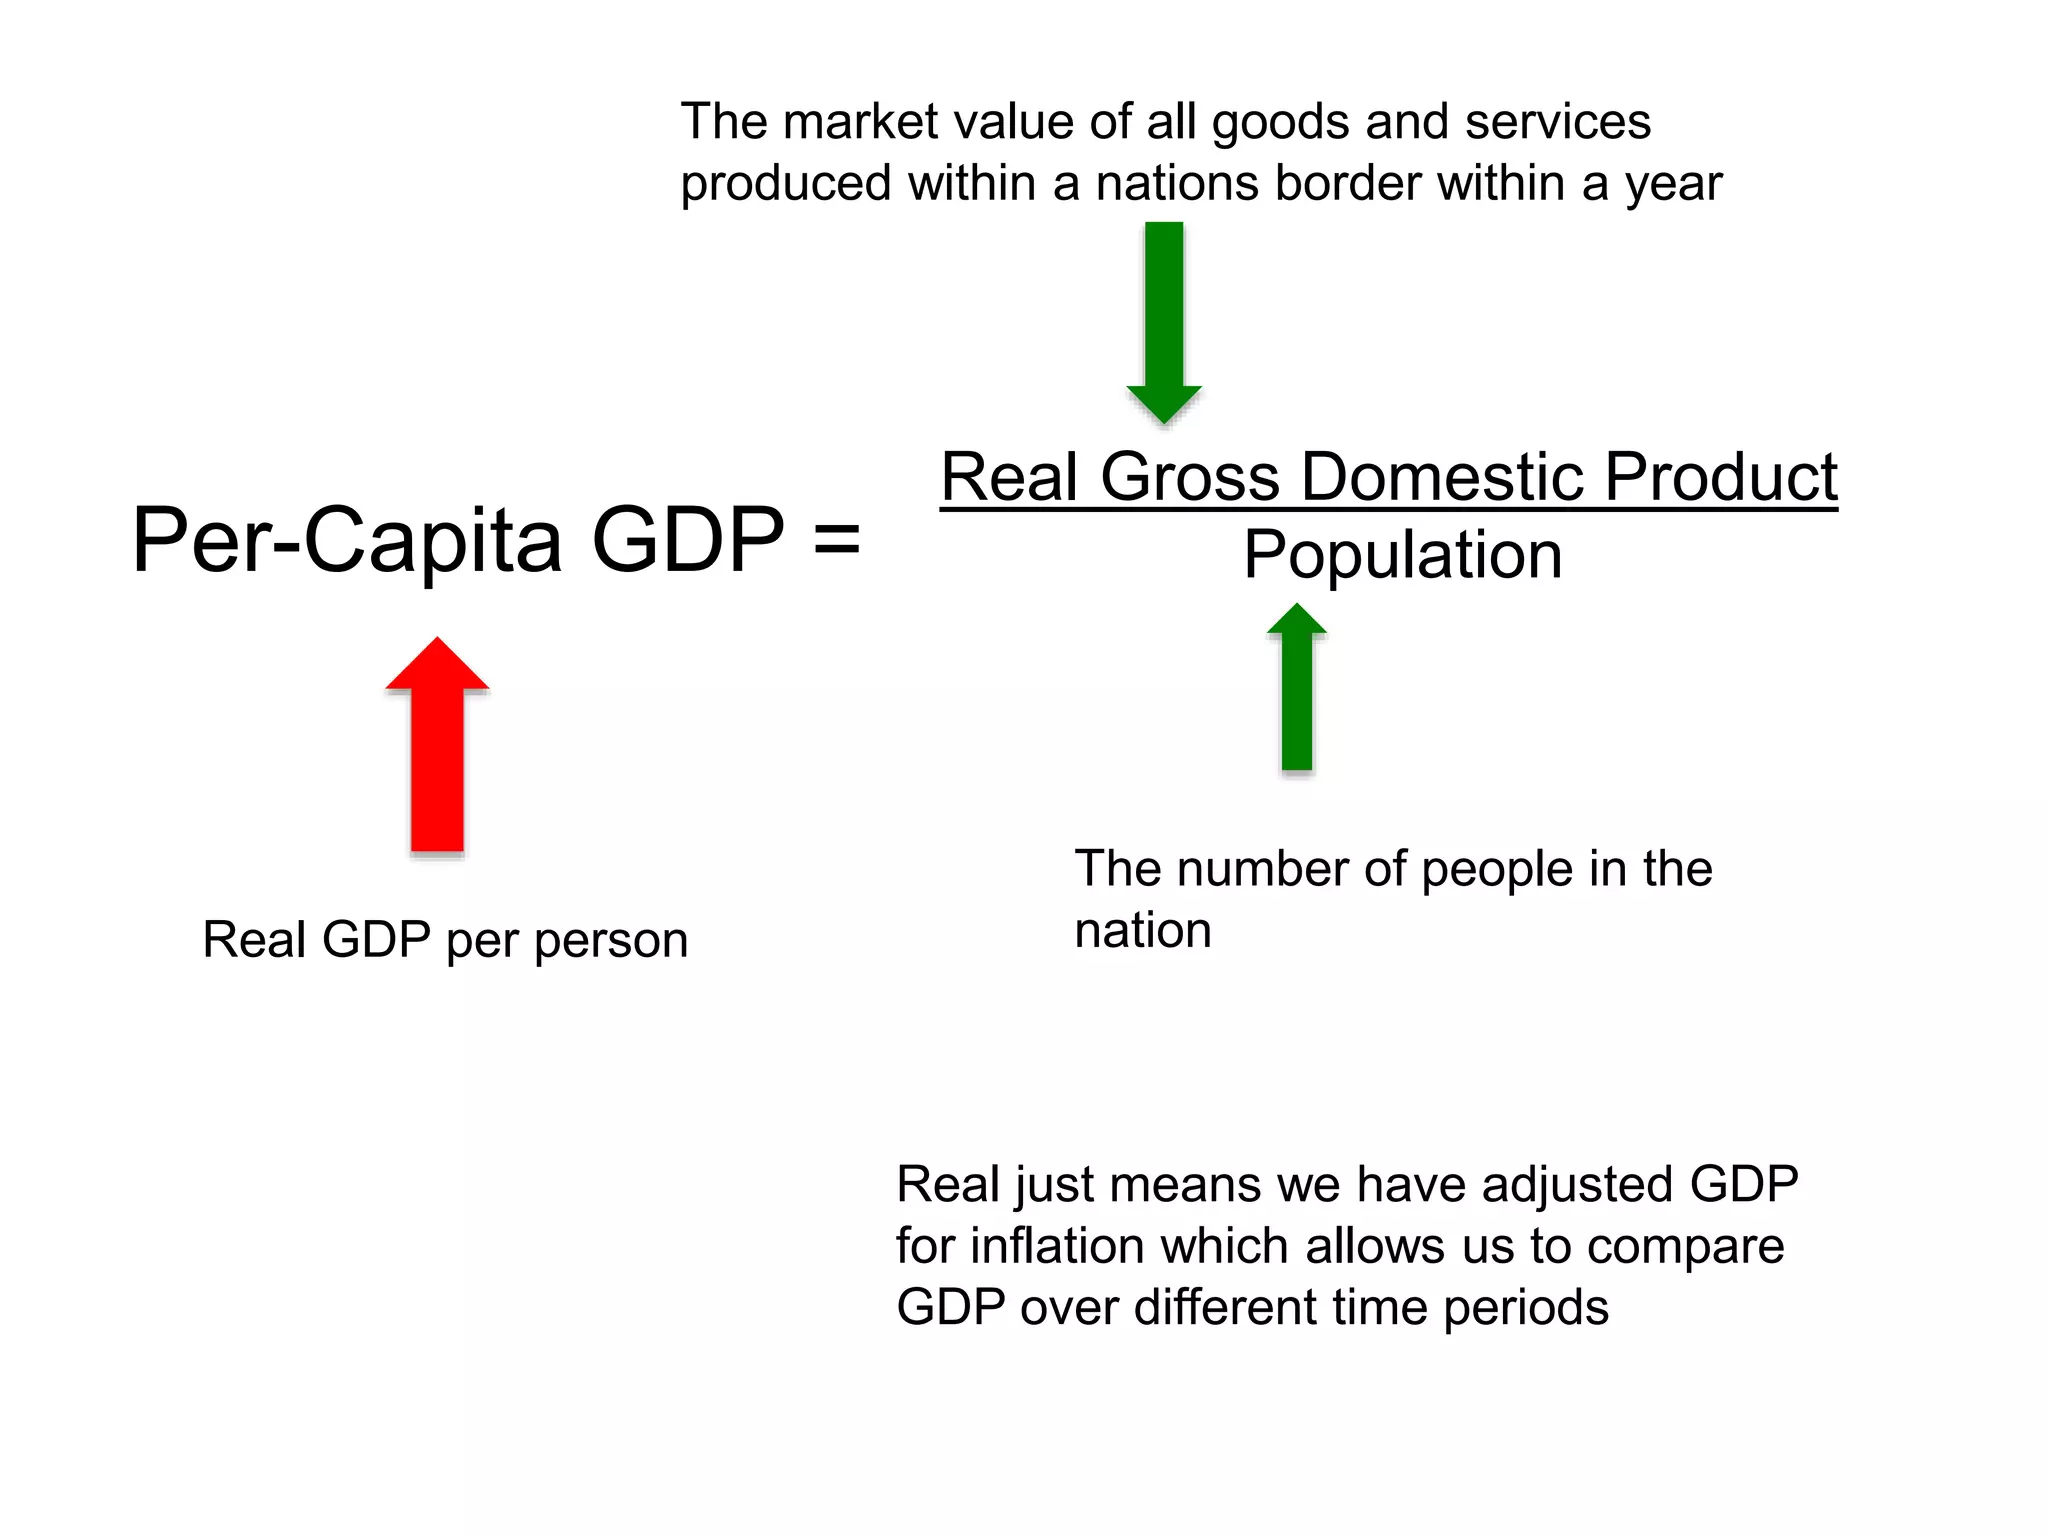
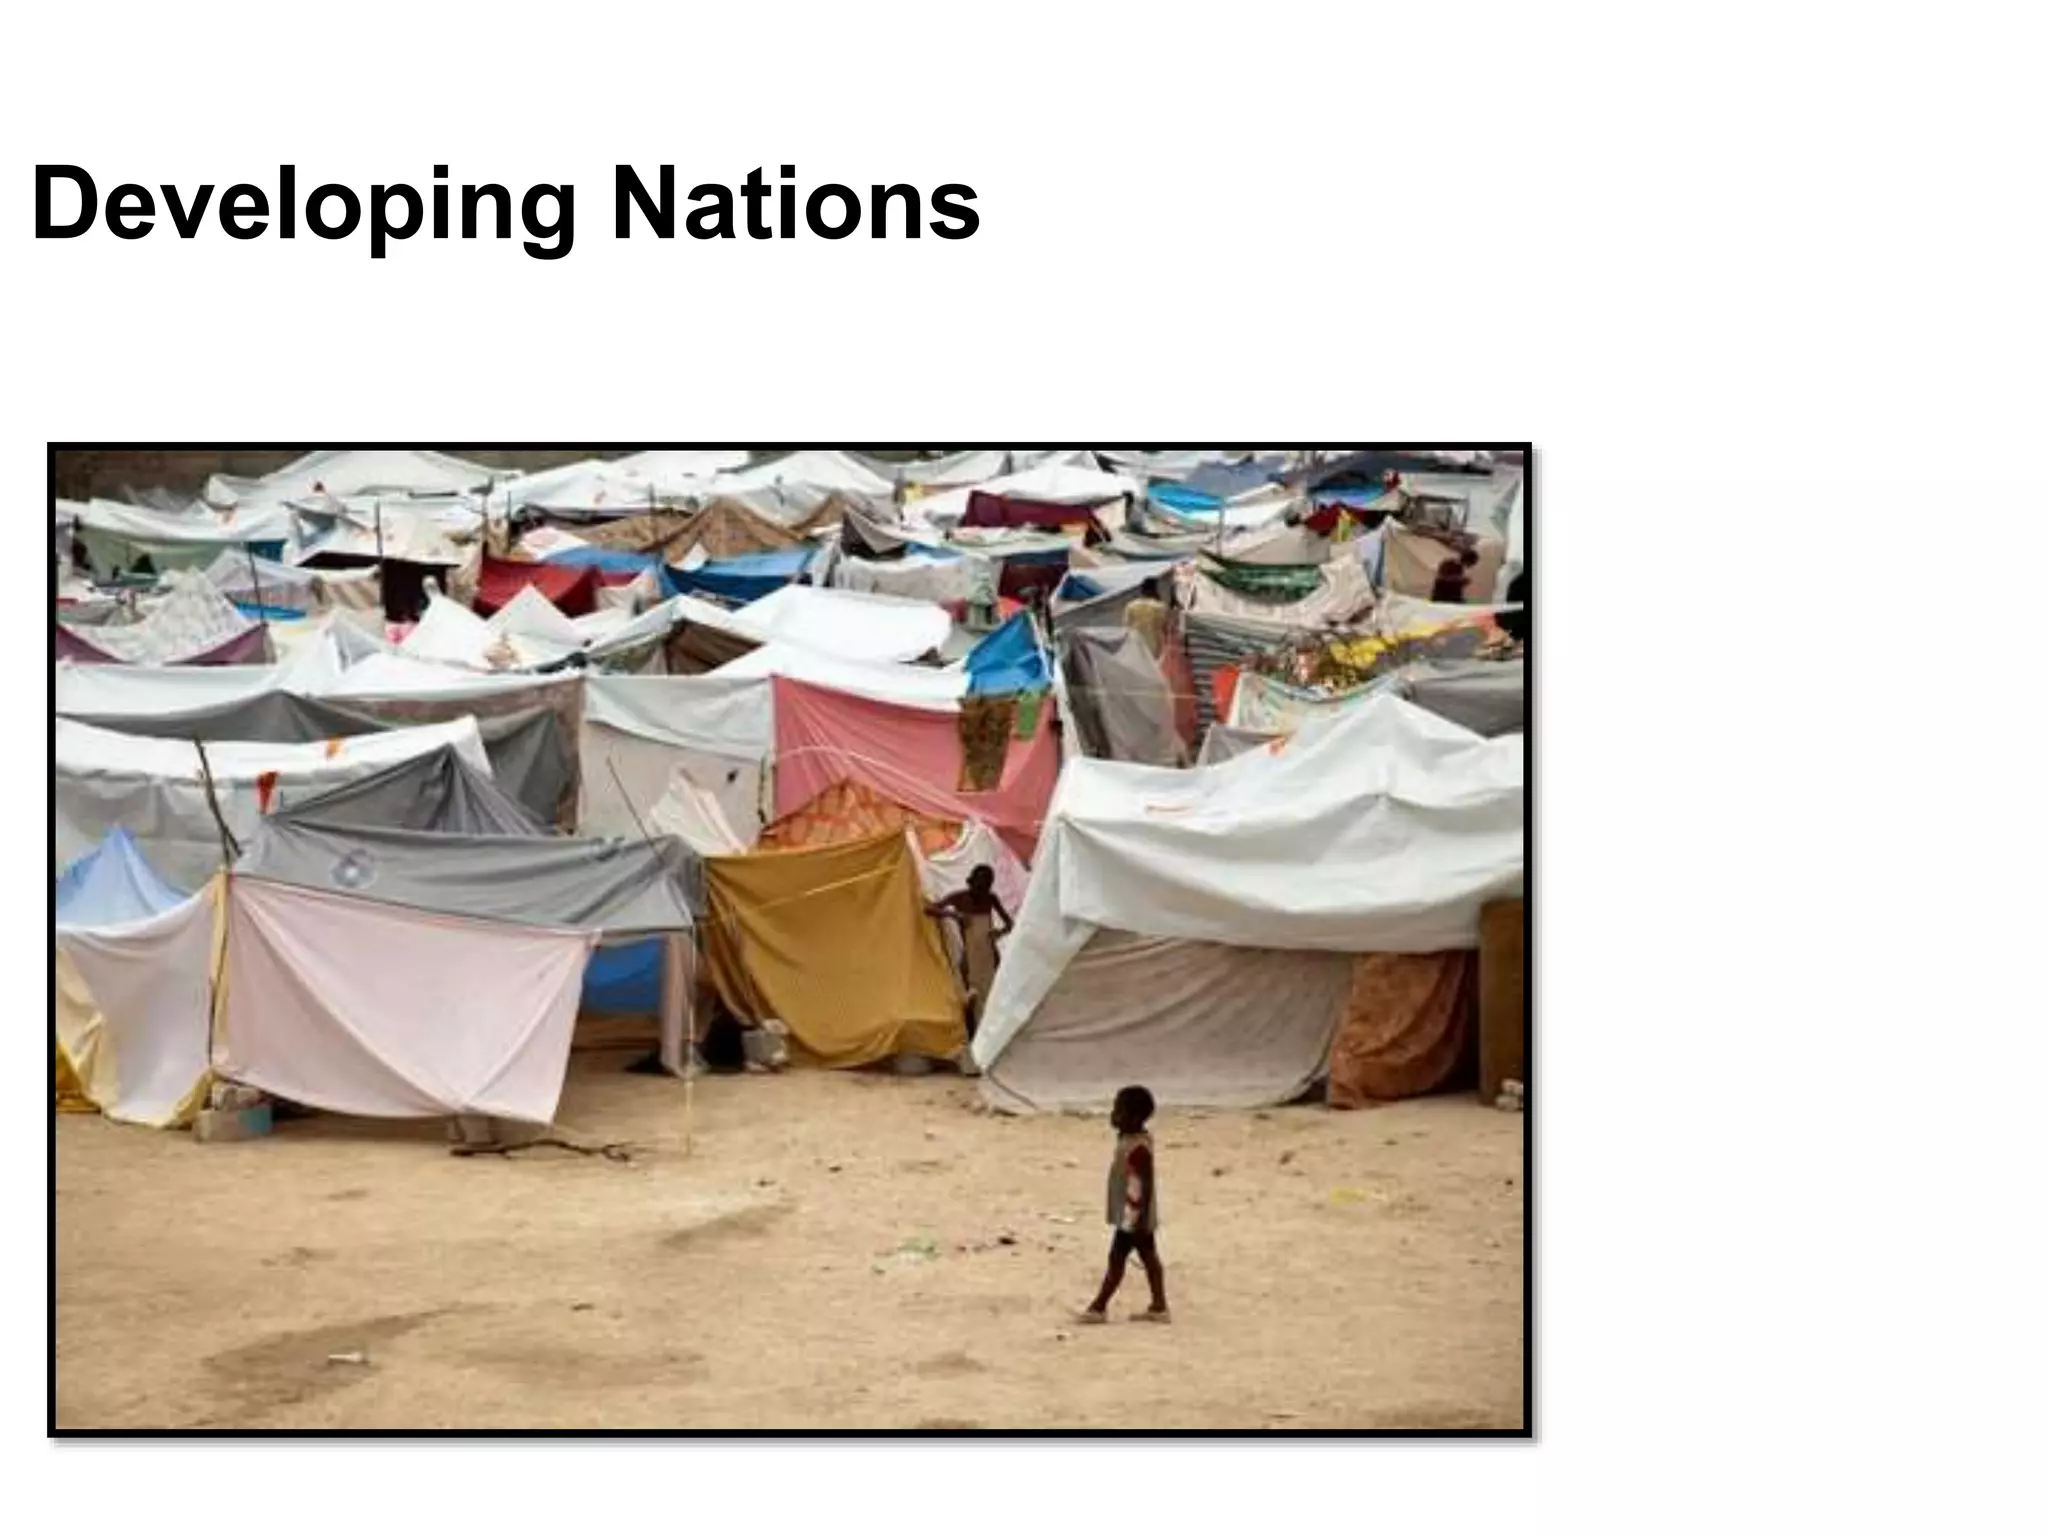
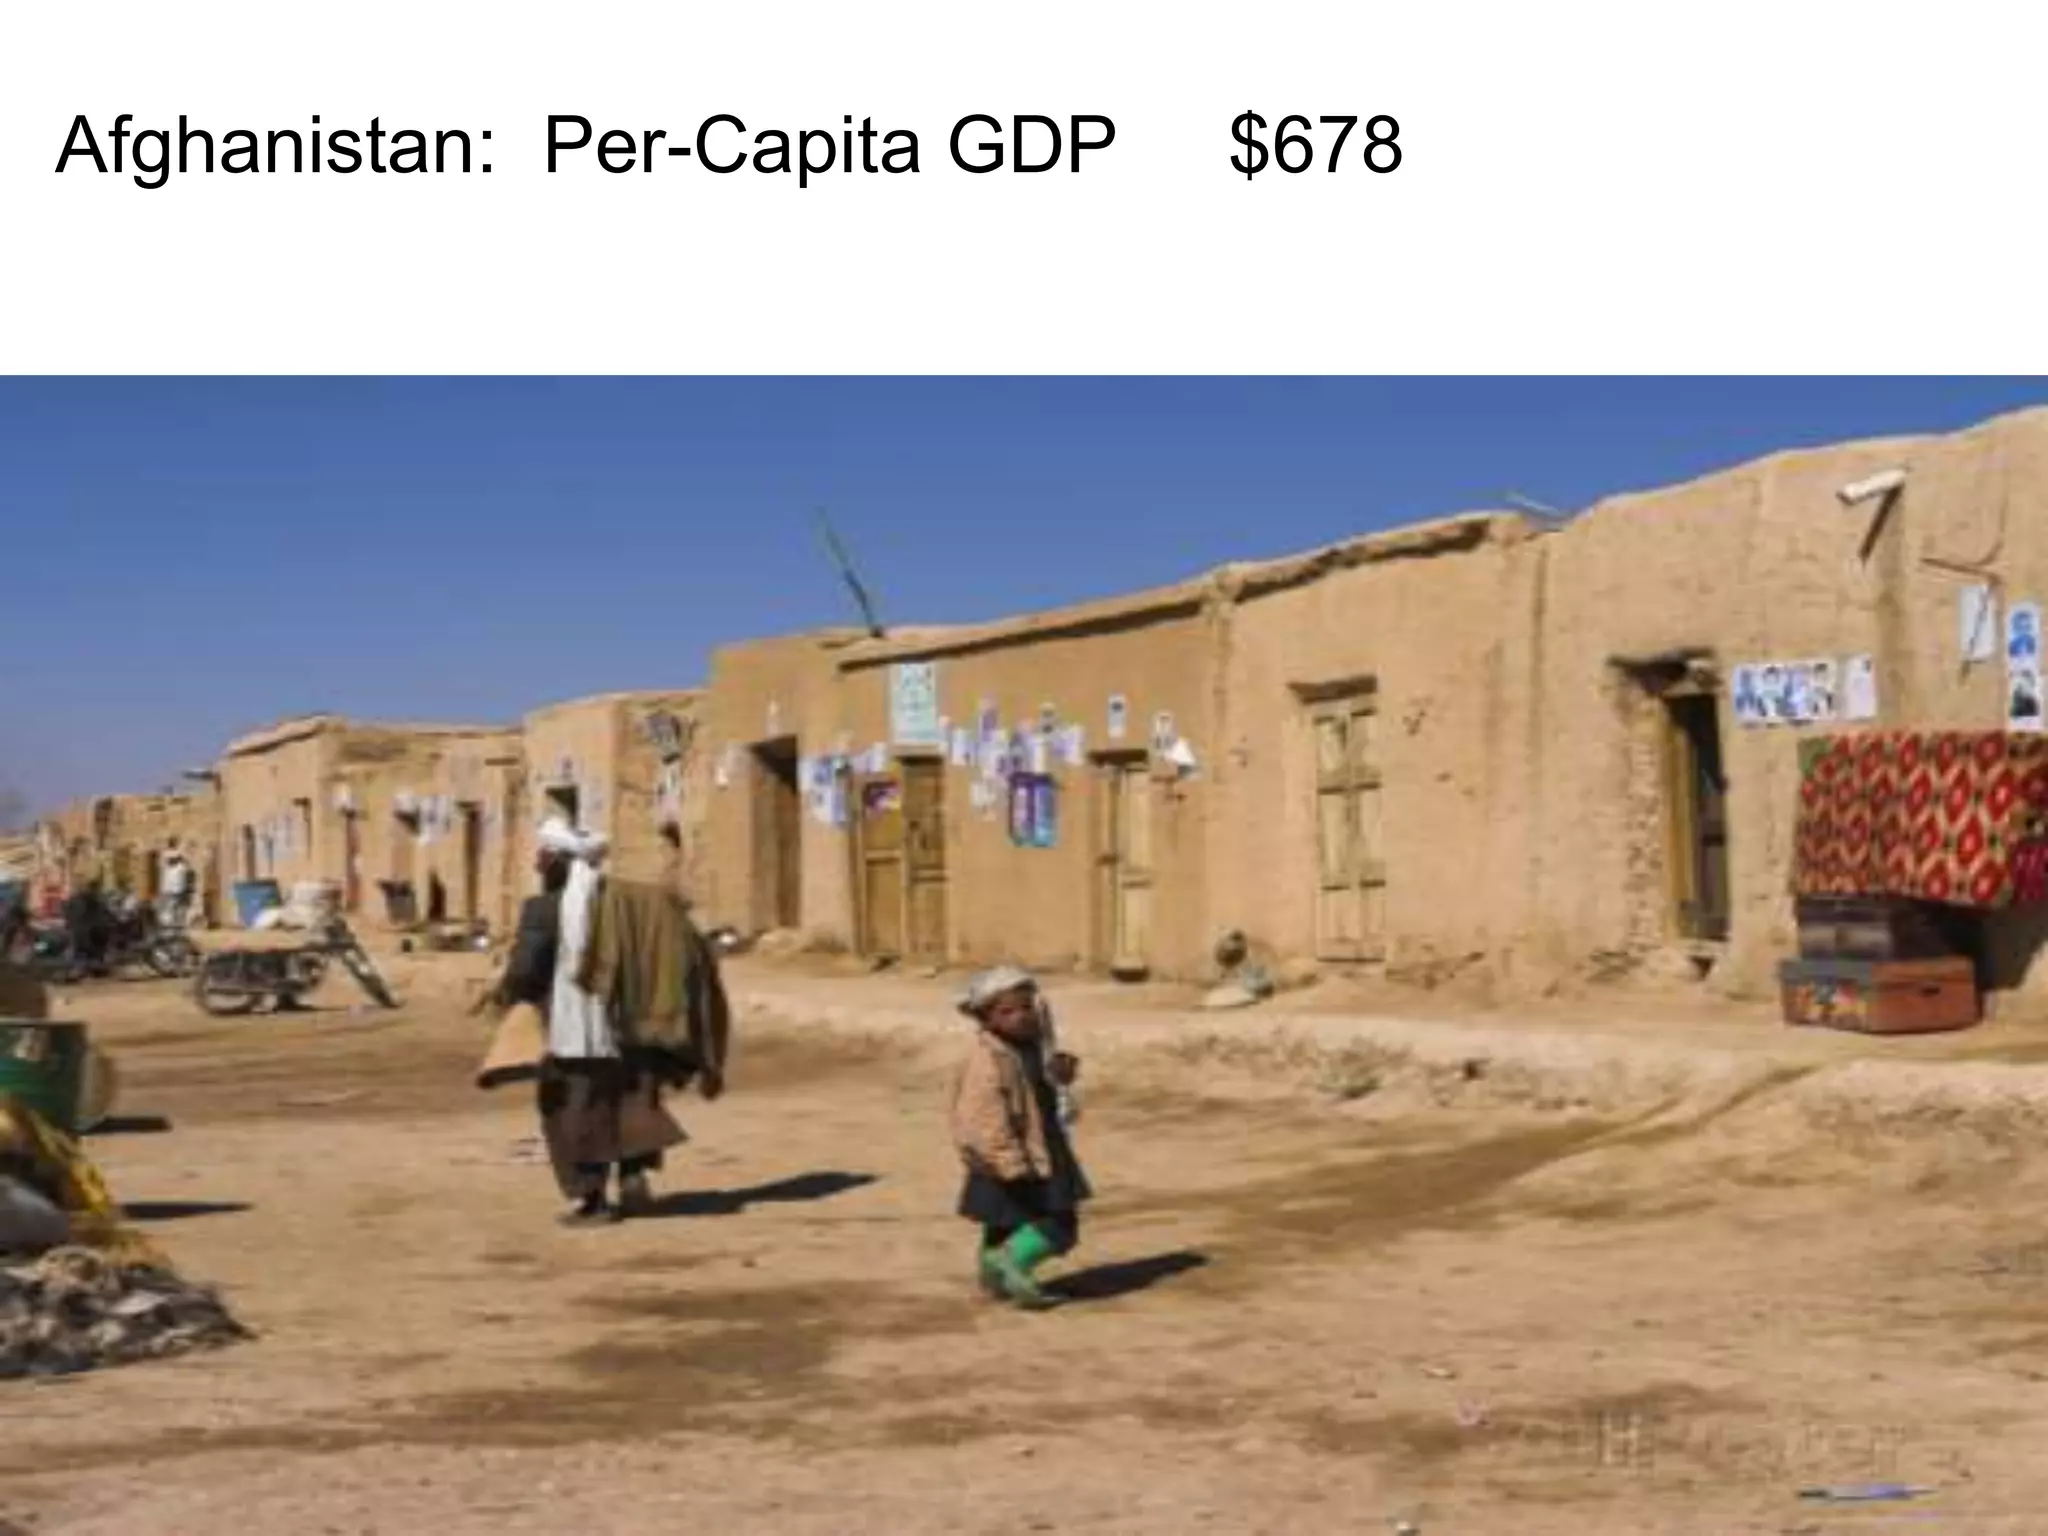
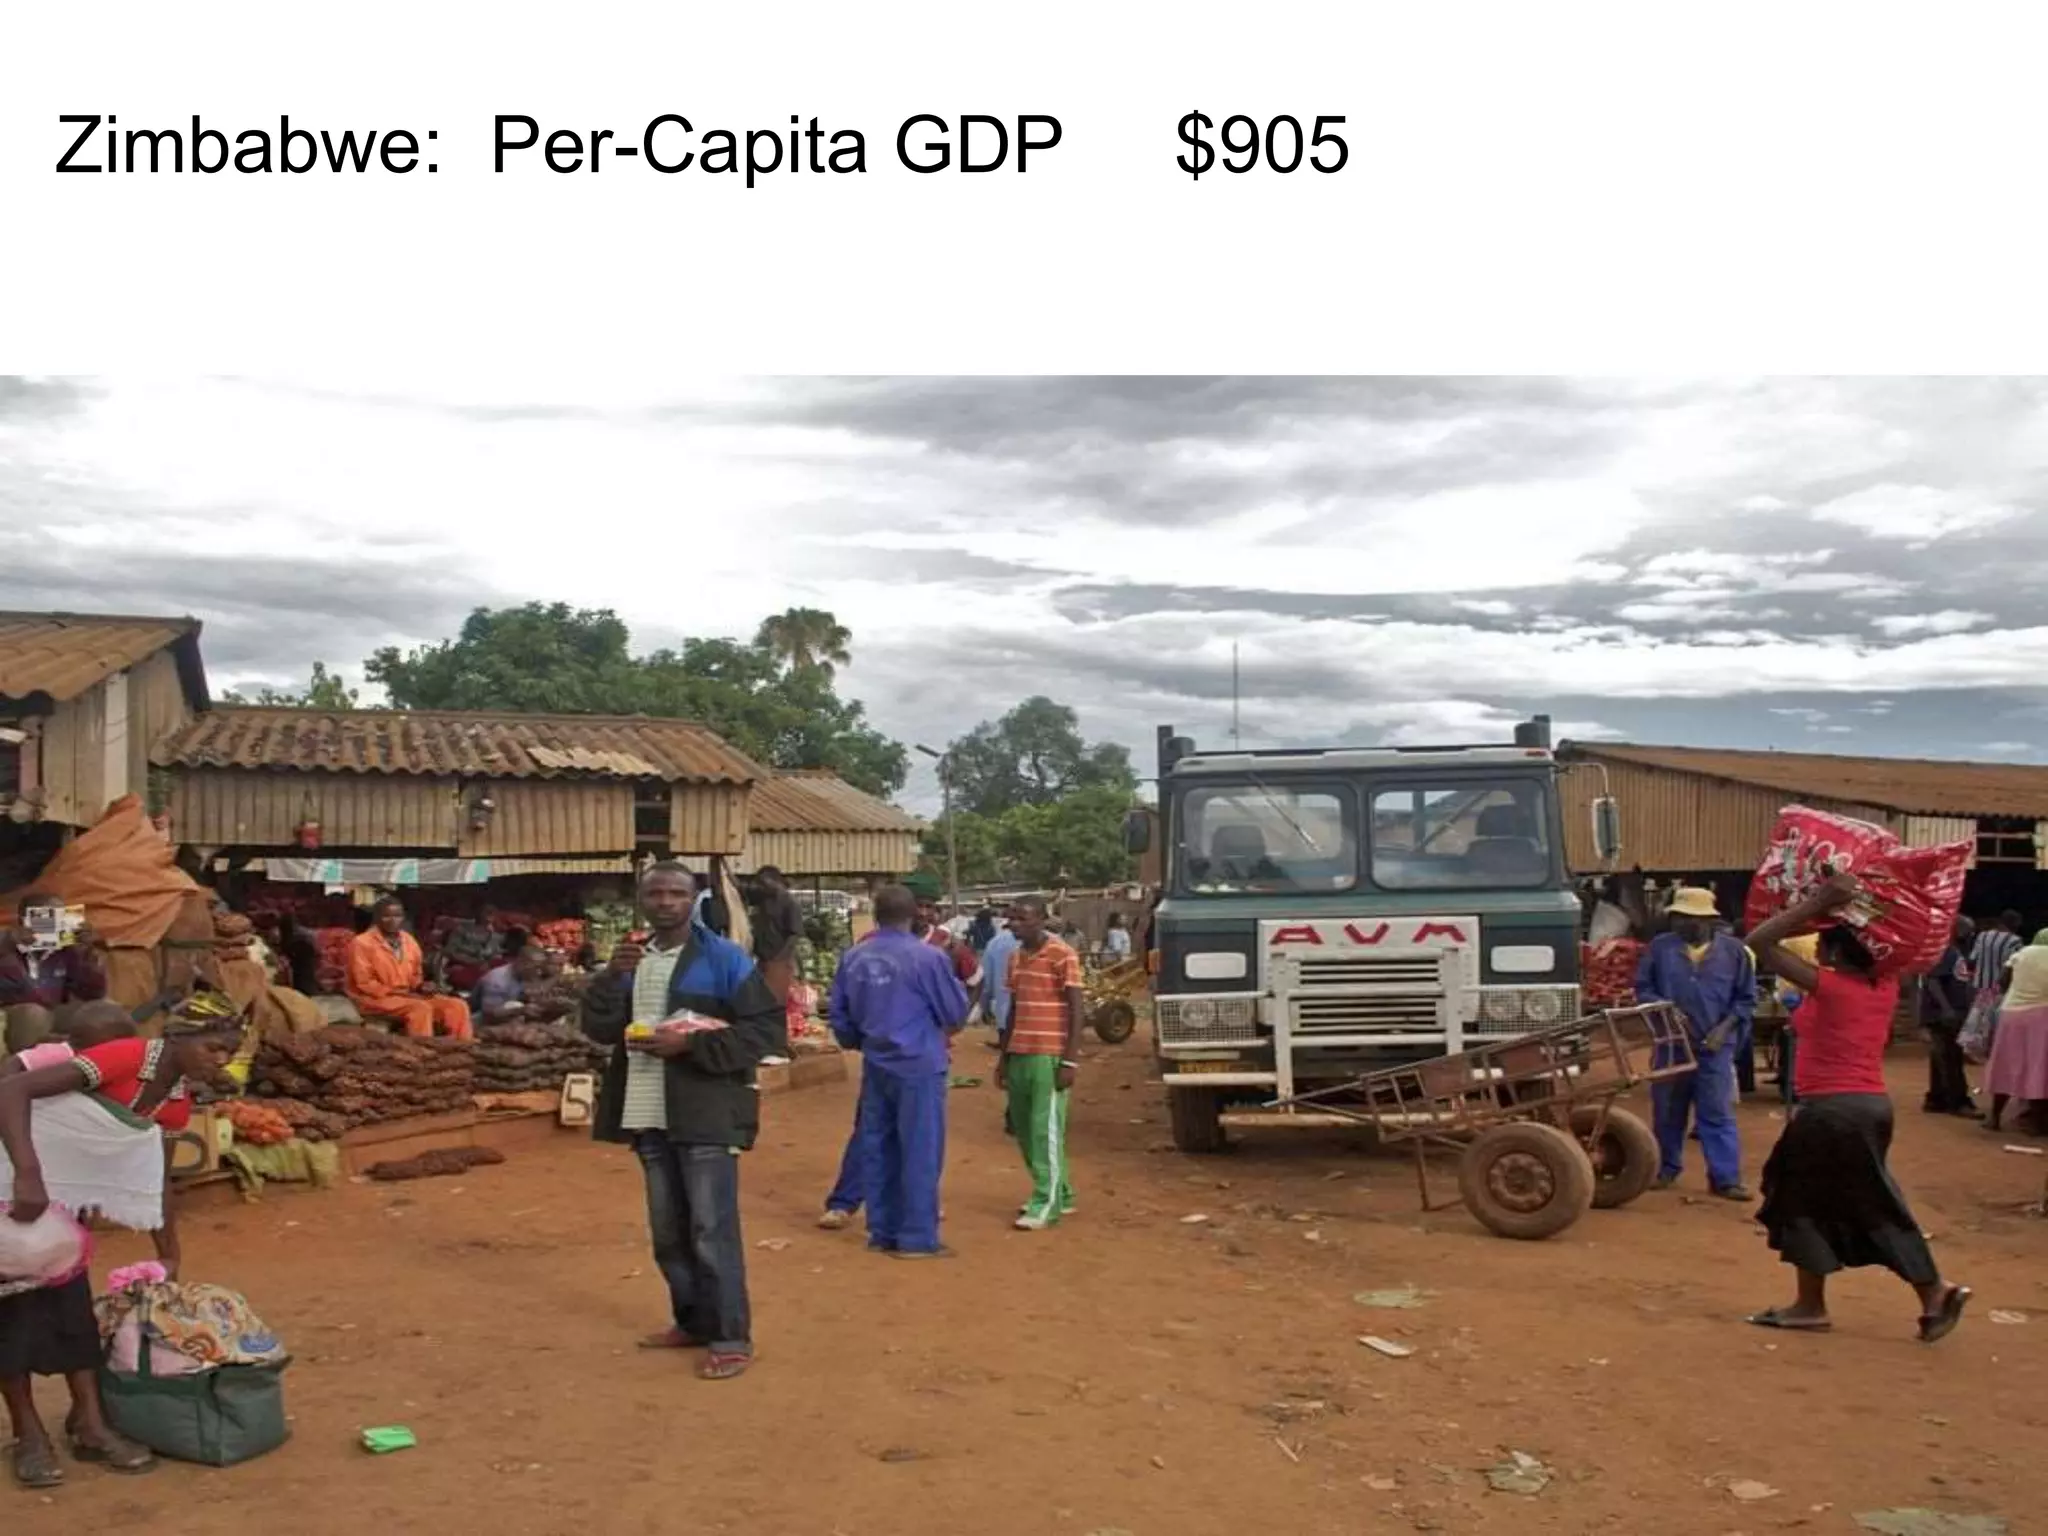
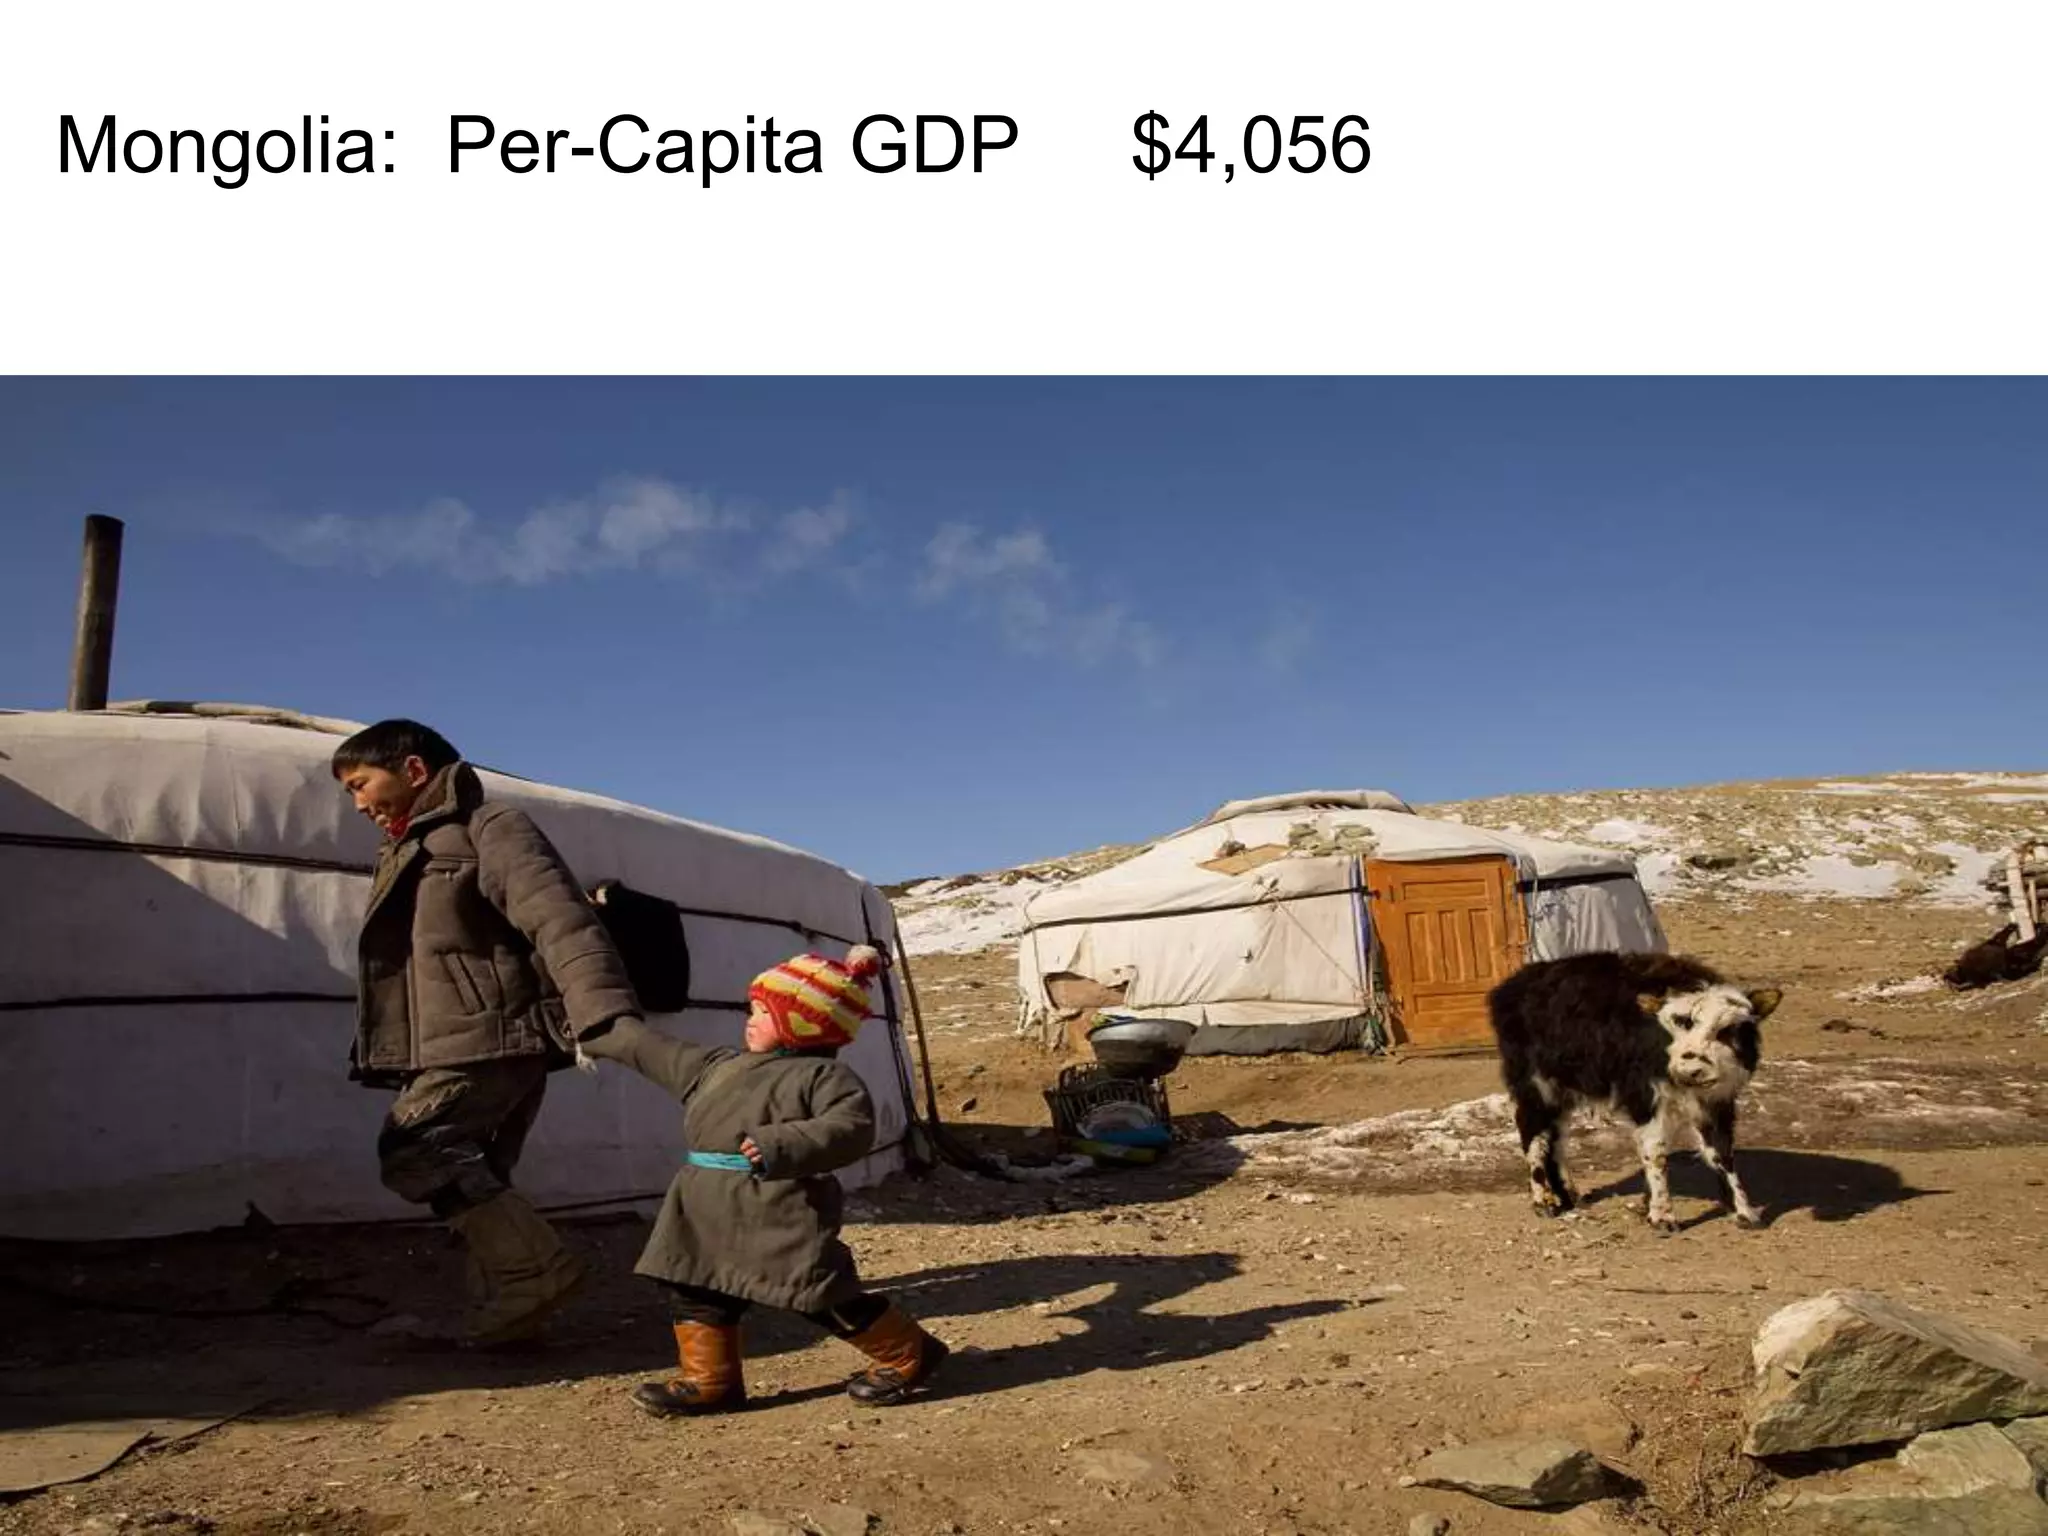
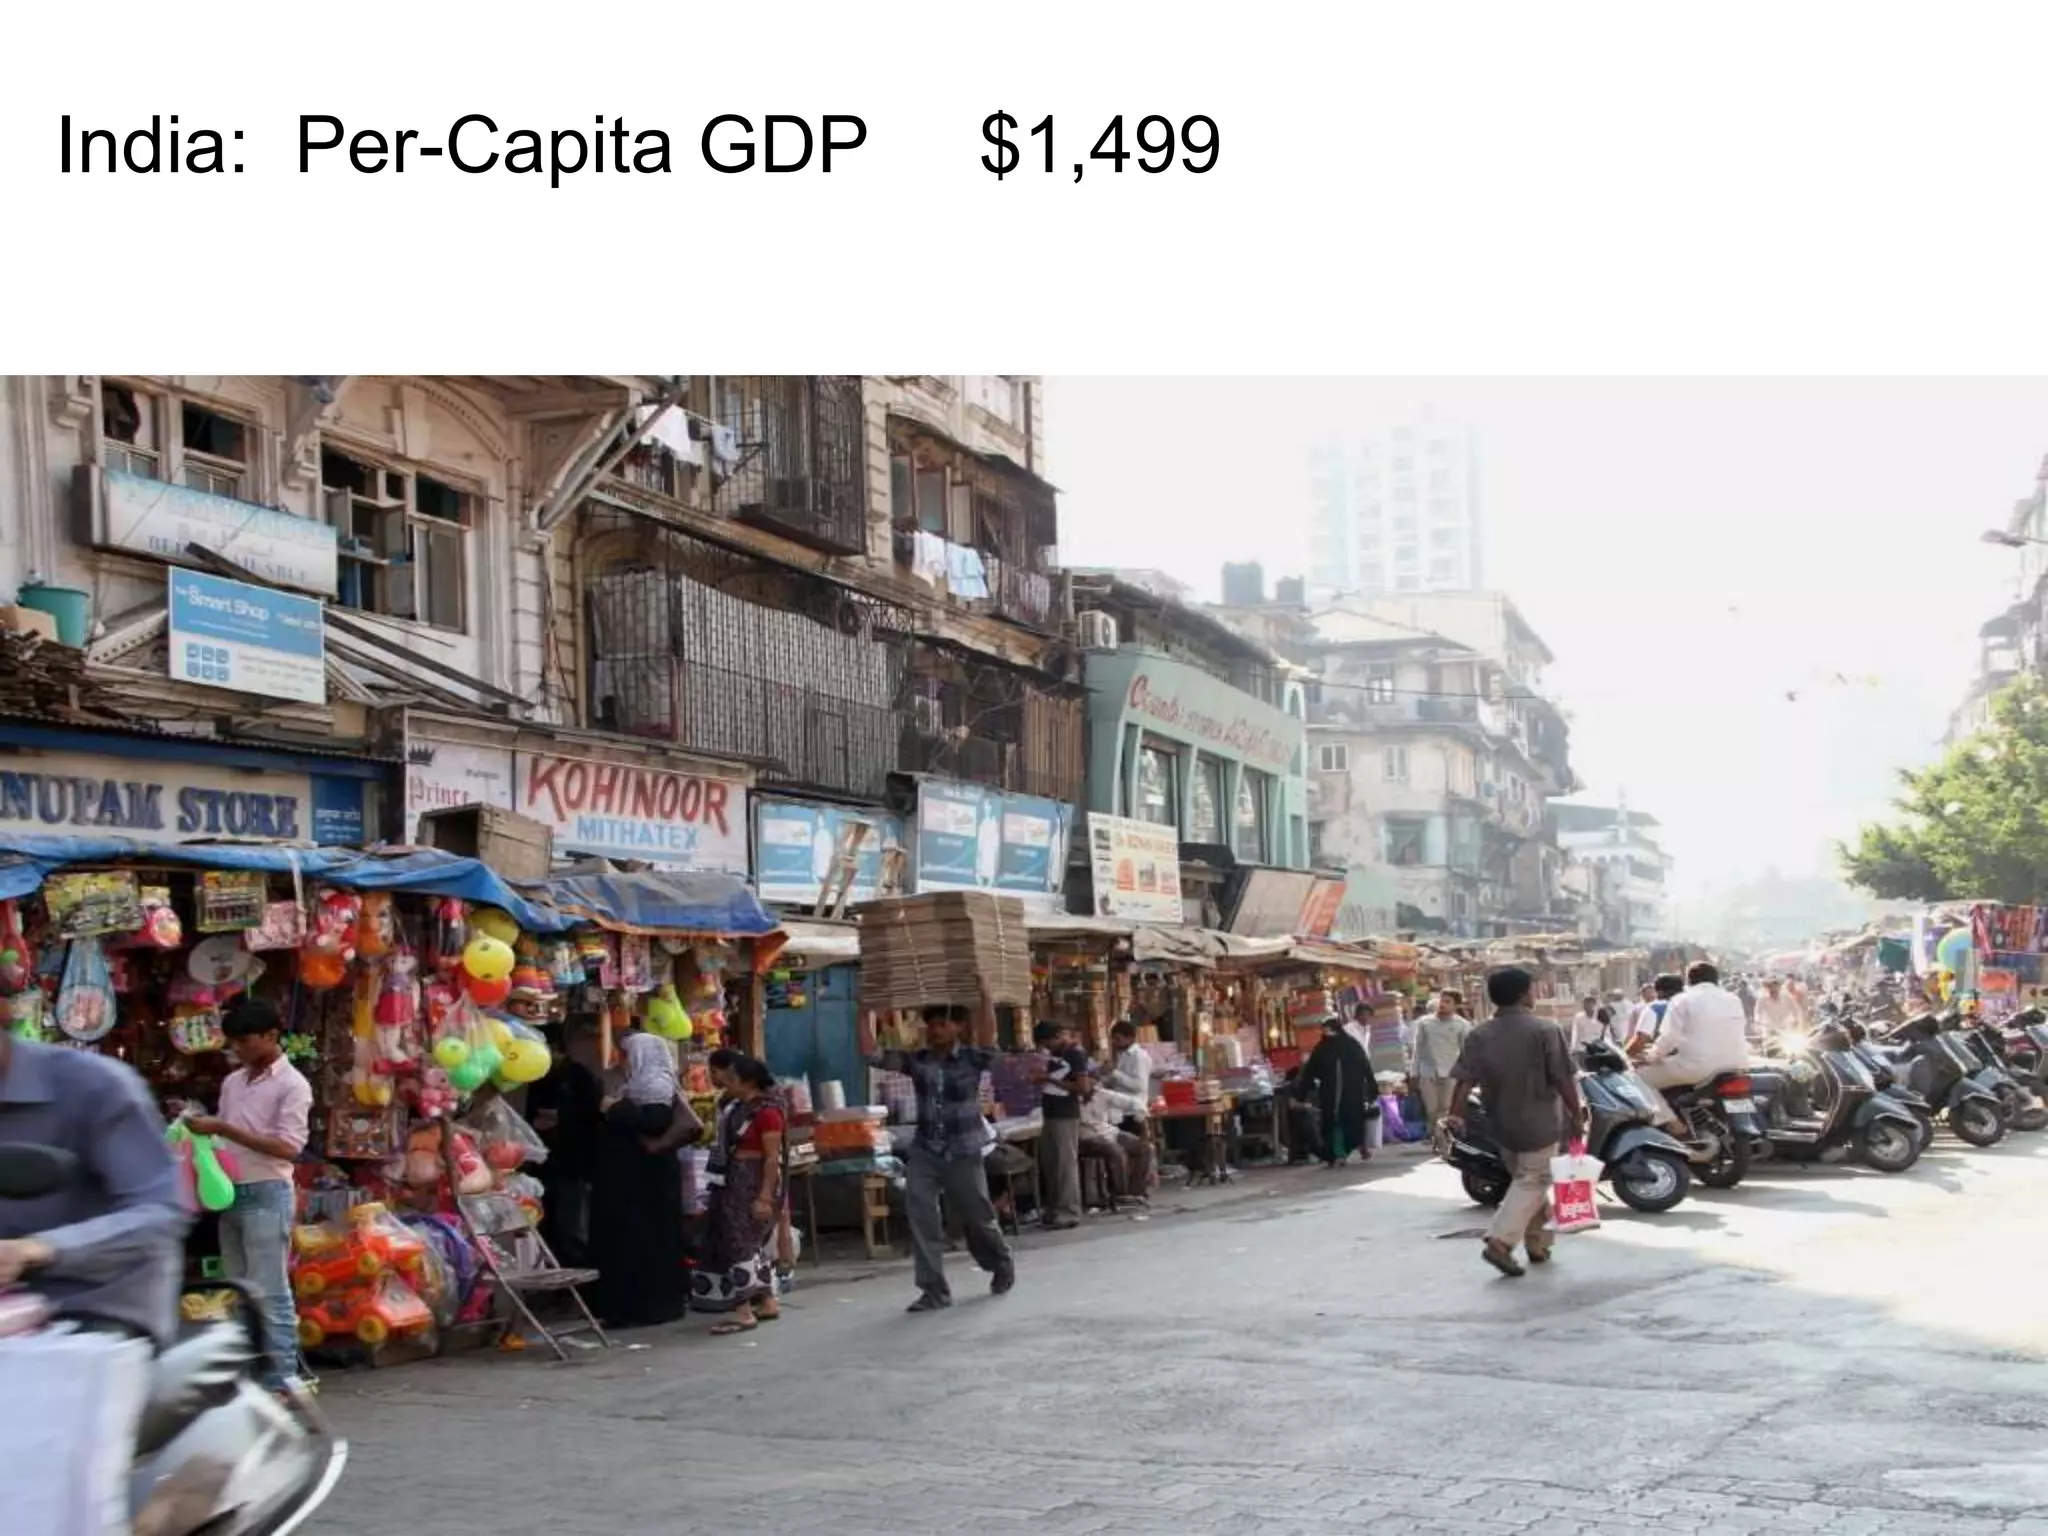
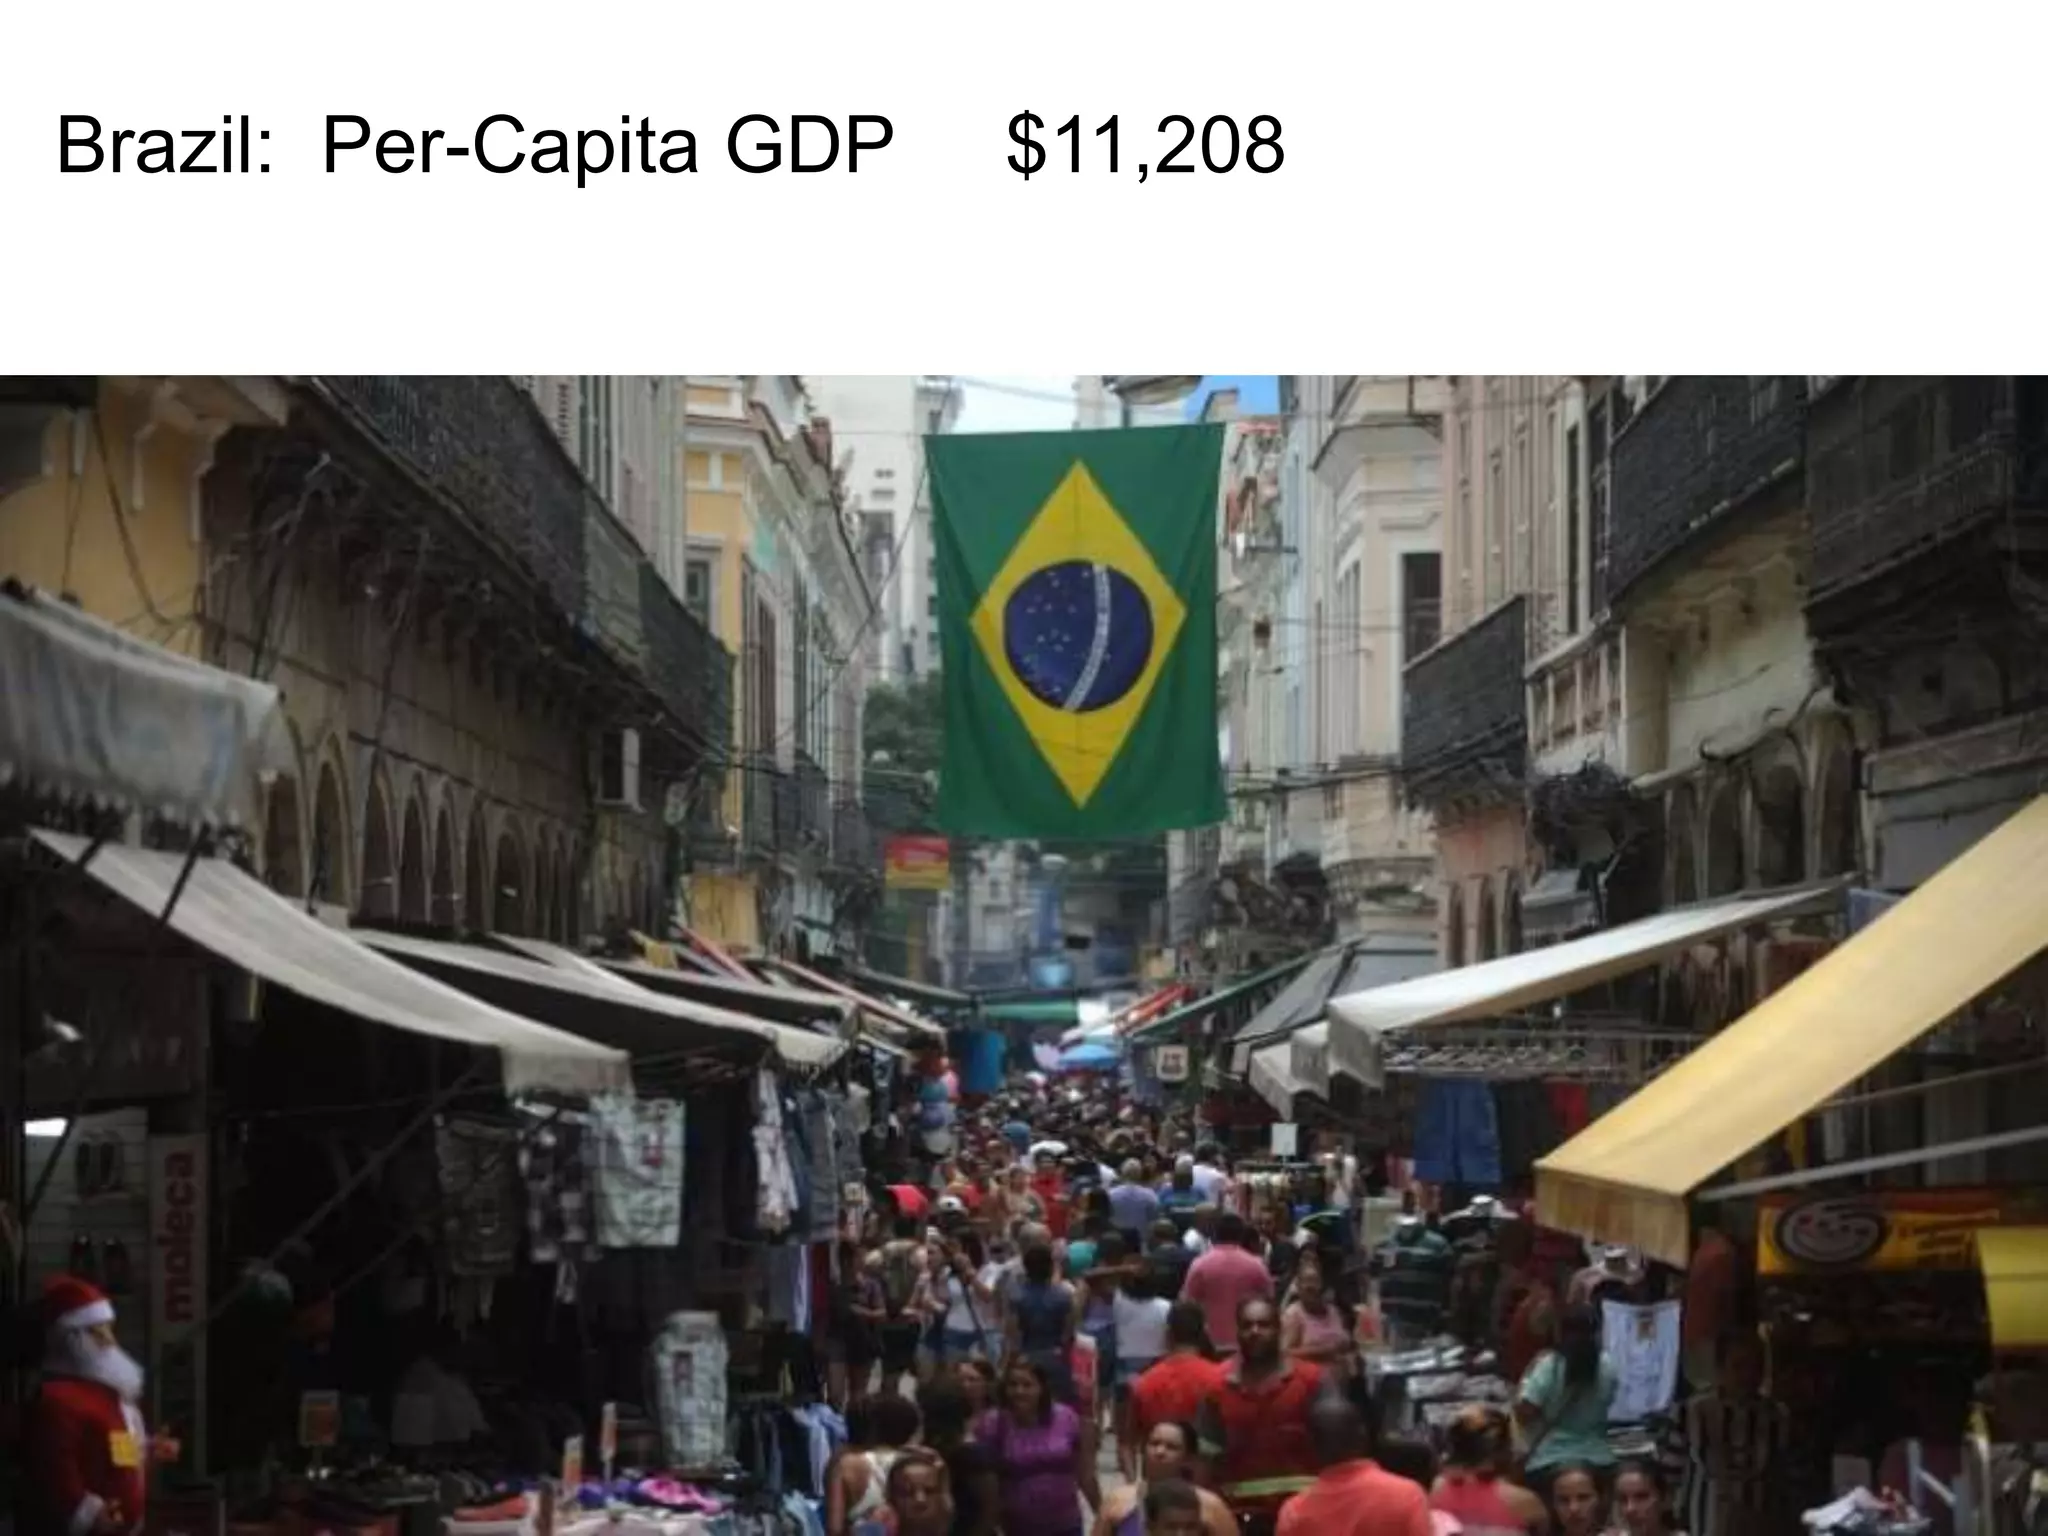
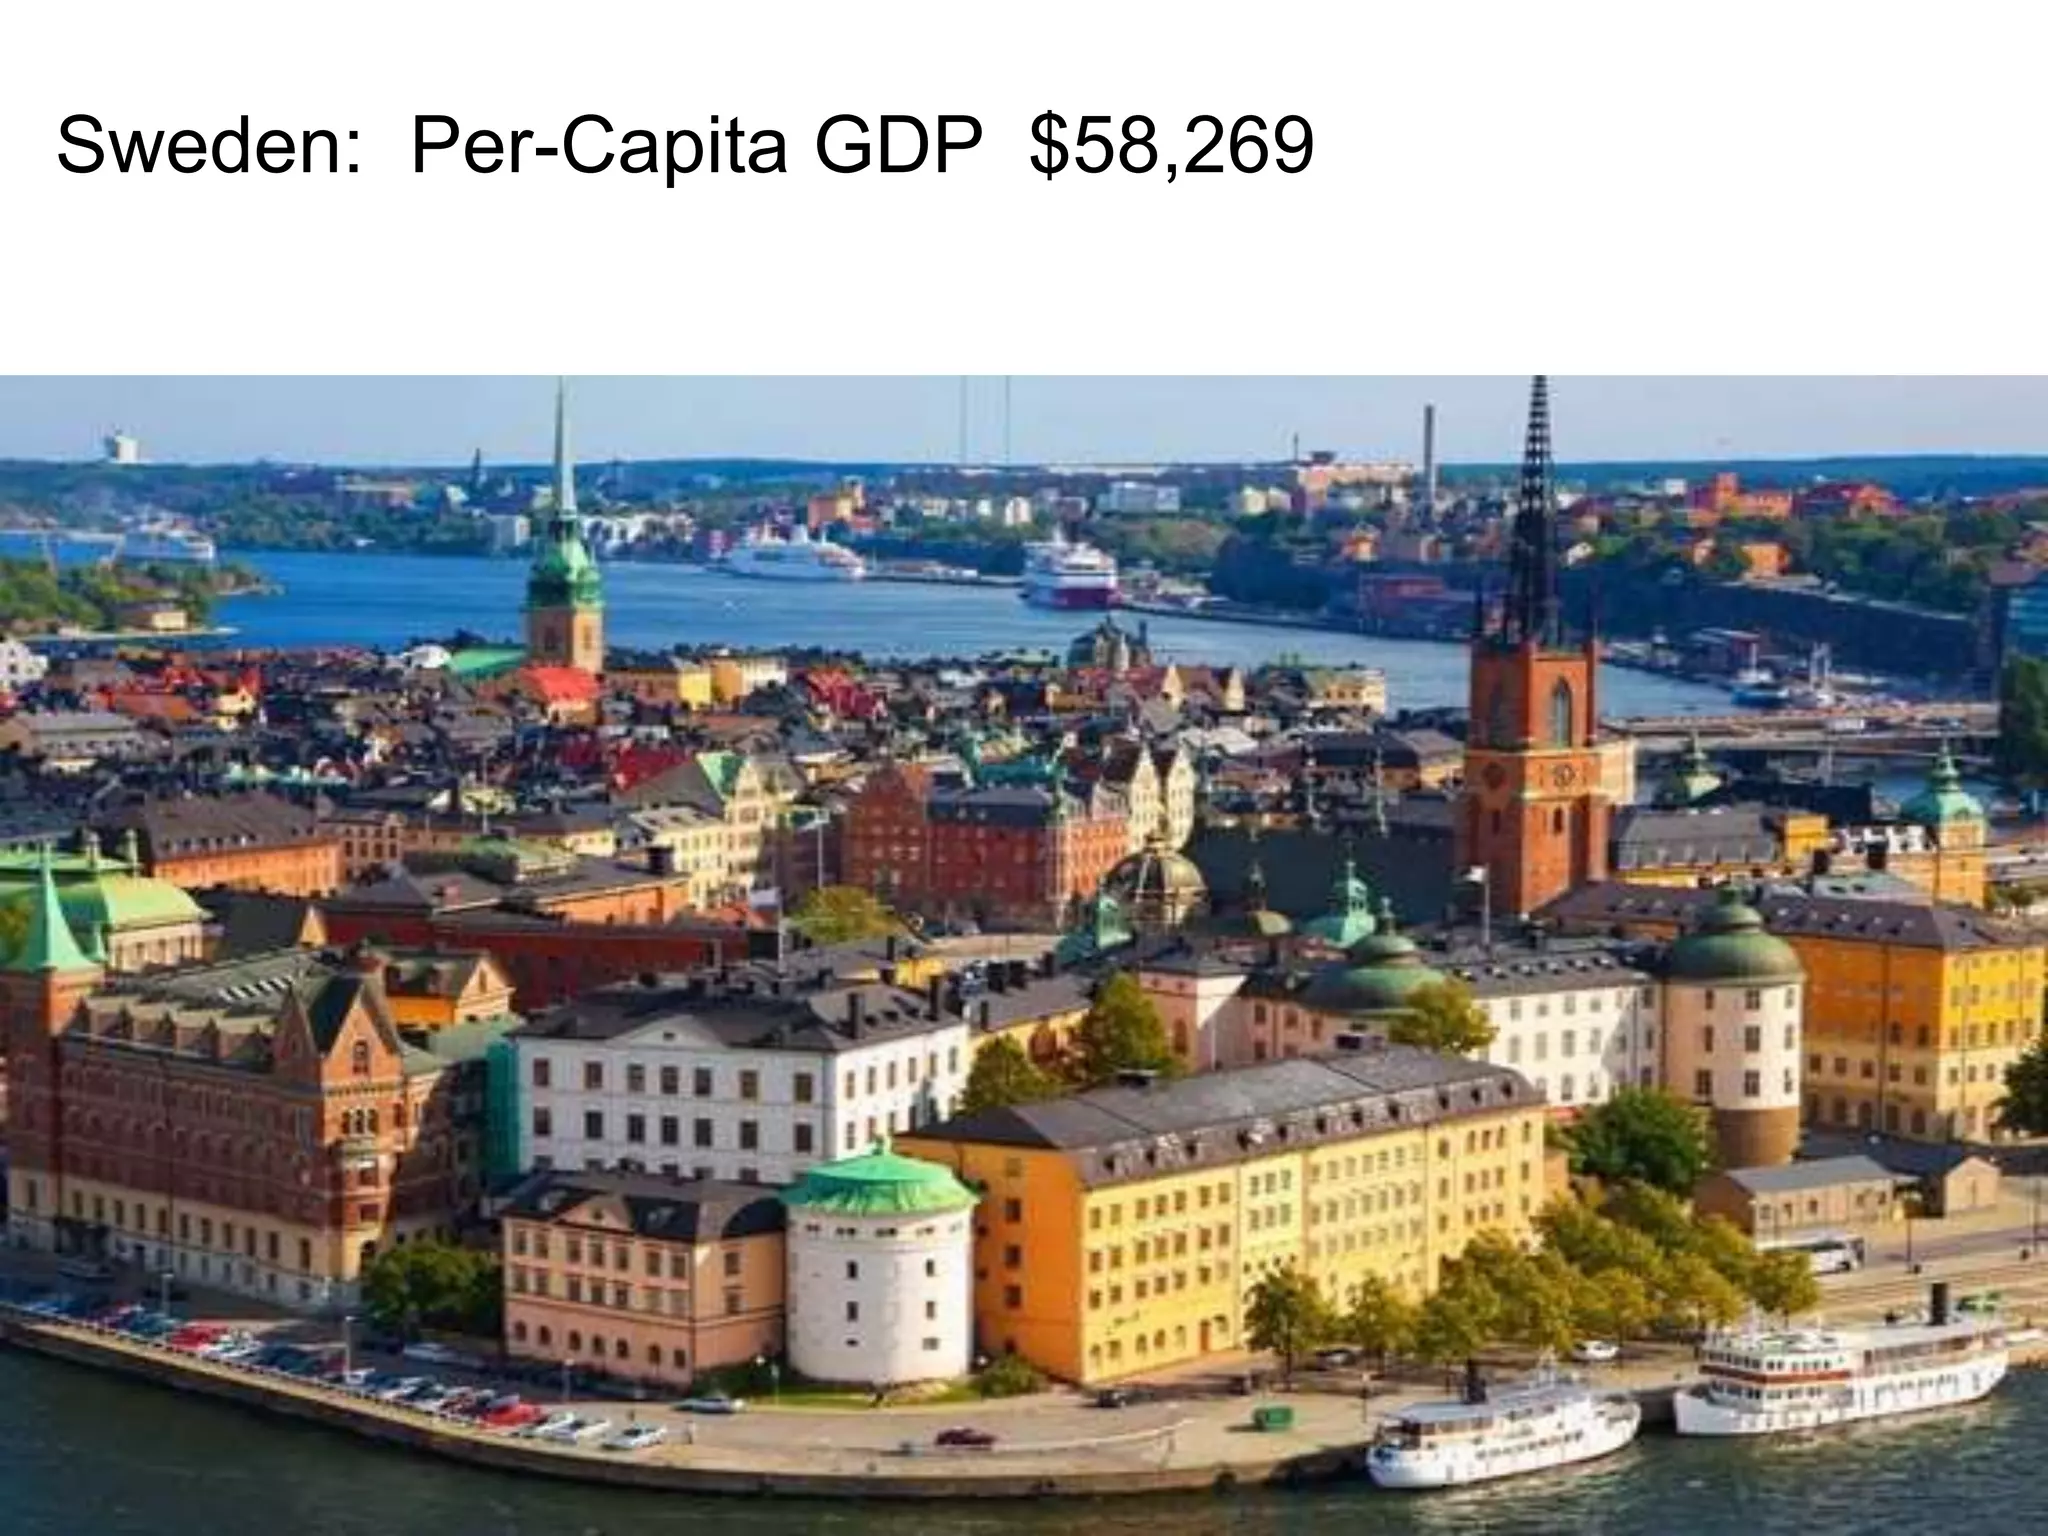
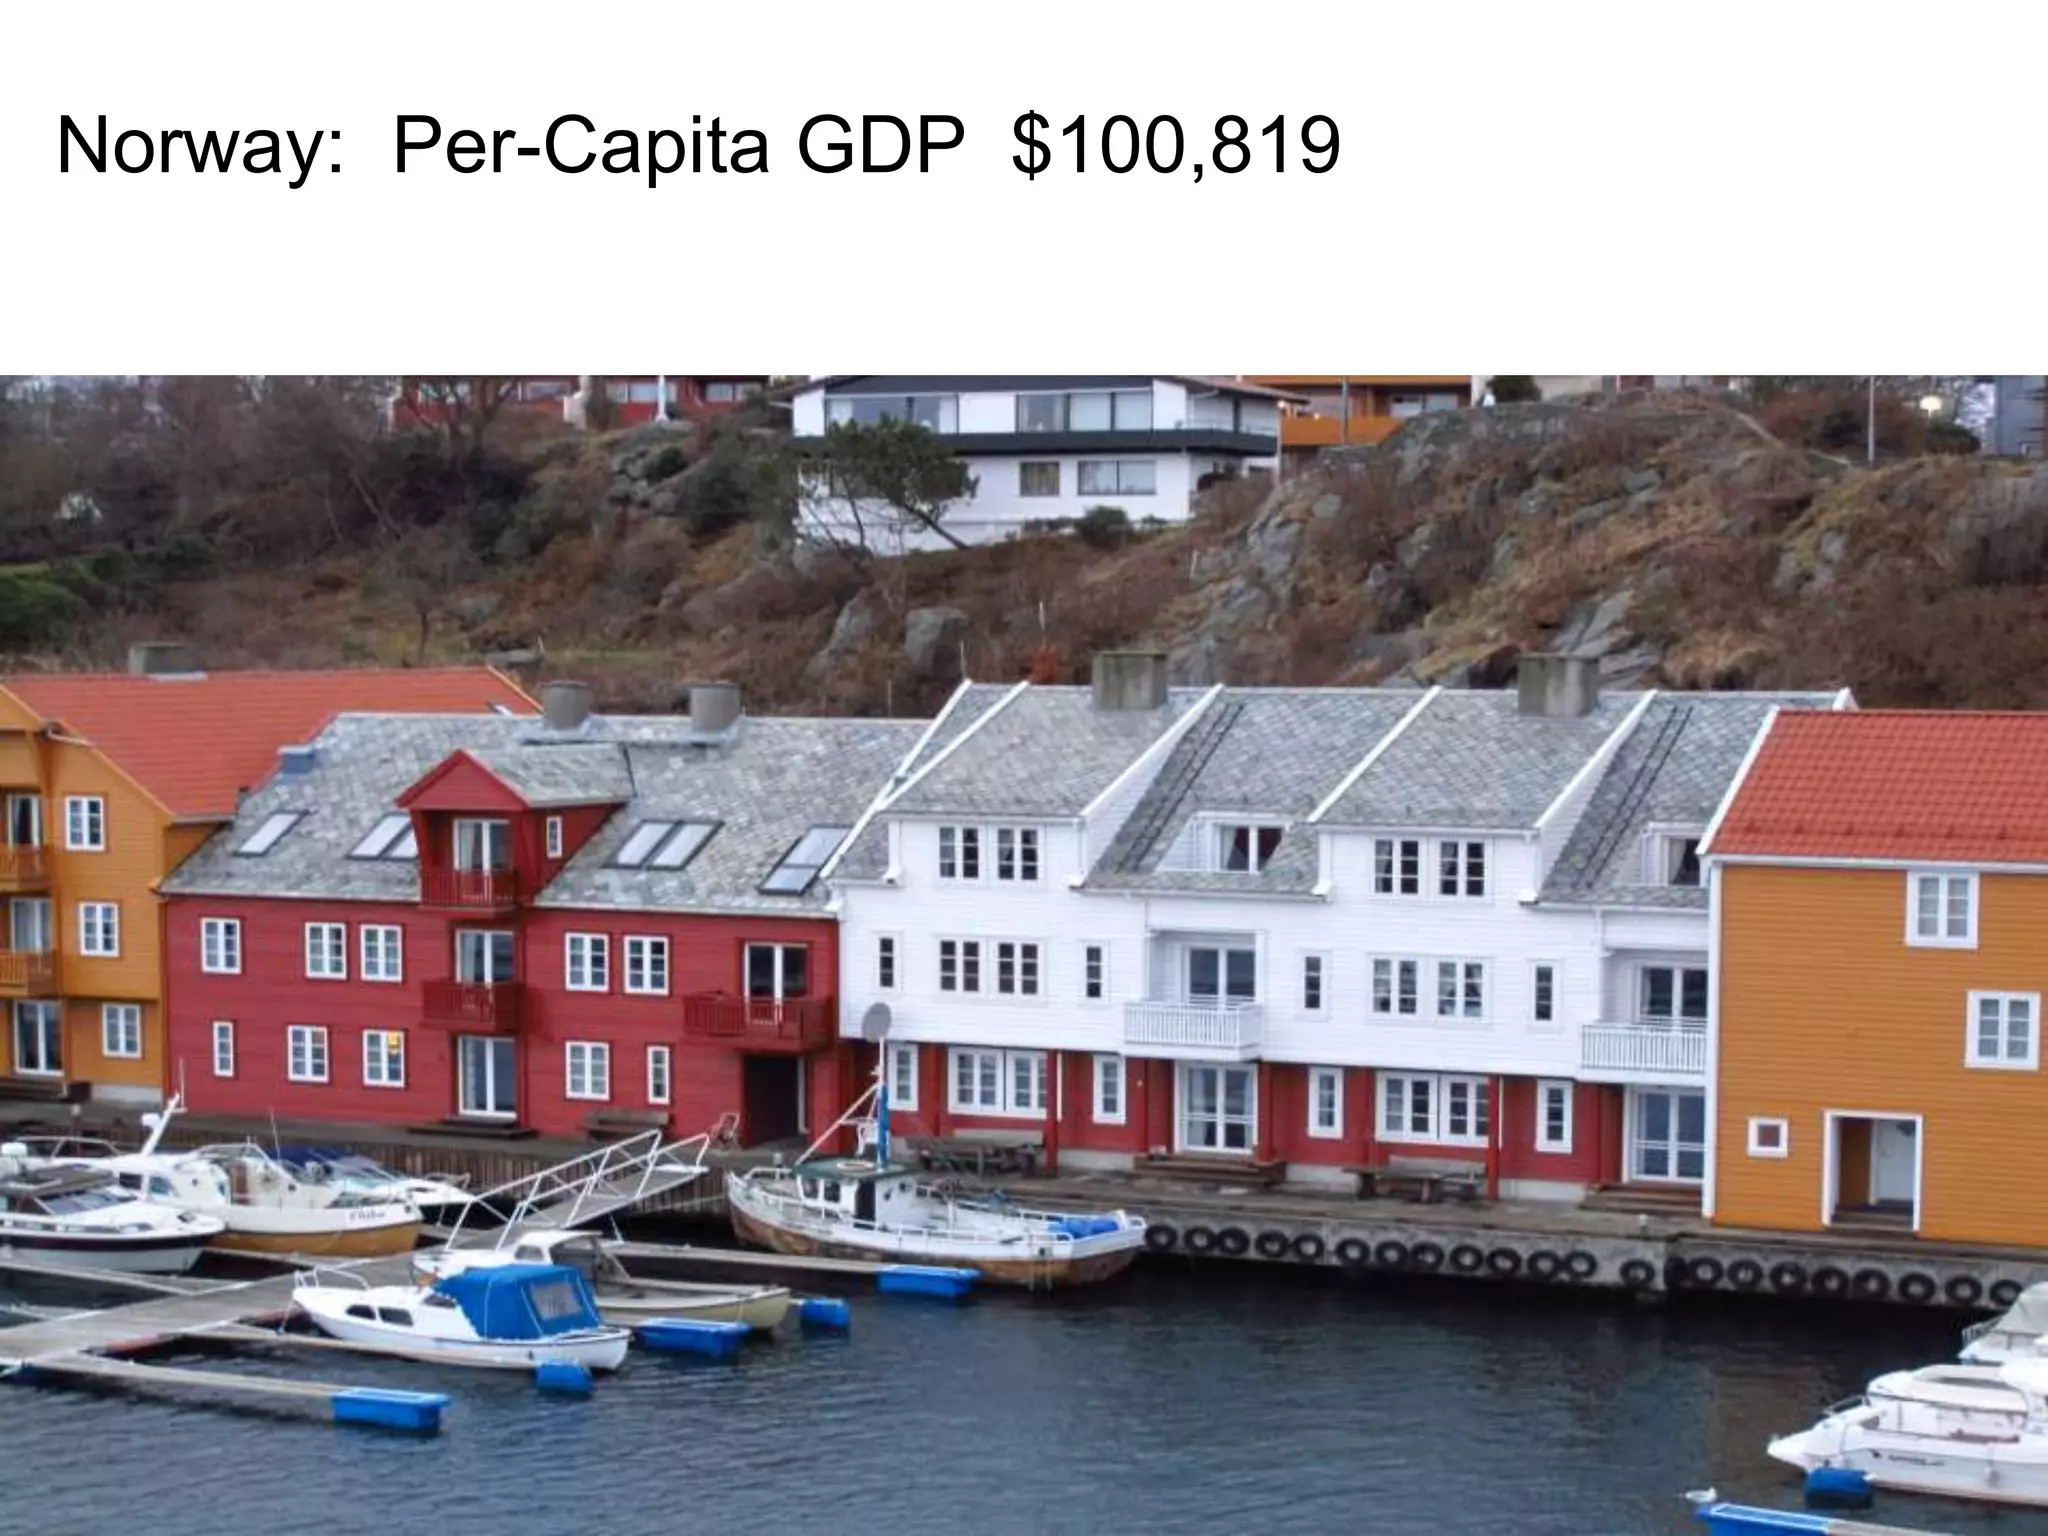
Real per-capita GDP allows comparisons of standards of living between nations by calculating real GDP per person, adjusting for differences in population size and inflation. While China has a larger total GDP than the US due to its much larger population, the US has a higher standard of living as evidenced by its higher per-capita GDP. Per-capita GDP figures provided show developing nations like Afghanistan and Zimbabwe have much lower standards of living than advanced nations like the US, UK, Japan, and Norway based on their per-capita GDPs.


![Economics presentation1[1]](https://cdn.slidesharecdn.com/ss_thumbnails/economicspresentation11-131216075459-phpapp01-thumbnail.jpg?width=640&height=640&fit=bounds)


![[SARMIENTO] Development and Wealth POERPOINT PRESENTATION.pptx](https://cdn.slidesharecdn.com/ss_thumbnails/sarmientodevelopmentandwealth-250619220032-2382b709-thumbnail.jpg?width=640&height=640&fit=bounds)


