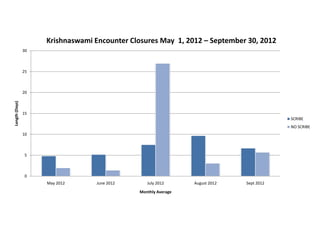
Pediatric Surgery Clinic
Data Analysis
Are medical scribes effective in the
outpatient setting?
Scribe Impact for providers:
Sanjay Krishnaswami, MD, Mark
Silen, MD and Garret Zallen, MD
Analysis & Methods
Utilizing financial data, the analysis pulls from five months of visit/billing data at the Doernbecher
Pediatric Surgery clinic when the scribe was in the office and out of the office. We considered
both new and established patients, and divided the date per provider based on their varying
methods for closing encounters and utilizing the scribe.
• Period of analysis: May 1, 2012 – September 30, 2012
We considered the following questions:
• Are encounters closed faster with a scribe?
• Is the clinic billing at a higher CPT code with a
scribe?
• Has patient volume increased with the scribe?
Closing Encounters
0
5
10
15
20
25
30
May 2012 June 2012 July 2012 August 2012 Sept 2012
Length(Days)
Monthly Average
Krishnaswami Encounter Closures May 1, 2012 – September 30, 2012
SCRIBE
NO SCRIBE
0
5
10
15
20
25
May 2012 June 2012 July 2012 August 2012 Sept 2012
Length(Days)
Monthly Average
Silen Encounter Closures May 1, 2012 – September 30, 2012
SCRIBE
NO SCRIBE
0
2
4
6
8
10
12
May 2012 June 2012 July 2012 August 2012 Sept 2012
Length(Days)
Monthly Average
Zallen Encounter Closures May 1, 2012 – September 30, 2012
SCRIBE
NO SCRIBE
CPT Codes
CPT Codes: Jay Krishnaswami
0.0%
10.0%
20.0%
30.0%
40.0%
50.0%
60.0%
70.0%
80.0%
90.0%
100.0%
99201 99202 99203 99204 99212 99213 99214
PatientVisits
CPT Code
May 1, 2012 - September 30, 2012
Scribe
No Scribe
CPT Codes: Mark Silen
0.0%
10.0%
20.0%
30.0%
40.0%
50.0%
60.0%
70.0%
80.0%
90.0%
100.0%
99201 99202 99203 99212 99213 99214
PatientVisits
CPT Code
May 1, 2012 - September 30, 2012
Scribe
No Scribe
CPT Codes: Garret Zallen
0.0%
10.0%
20.0%
30.0%
40.0%
50.0%
60.0%
70.0%
80.0%
90.0%
100.0%
99201 99202 99203 99204 99212 99213 99214
Patientvisits
CPT Code
May 1, 2012 – September 30, 2012
Scribe
No Scribe
Patient Volume
Patient Volume Comparisons
Average daily
patient load with
scribe
Average daily
patient load
without scribe
Outliers /
Considerations
Sanjay Krishnaswami 12.7 patients 3.6 patients
Majority of
Krishnaswami’s patients
seen with the scribe in
clinic, only 9 days of the
five months was he
without the scribe.
Mark Silen 9.3 patients 7.7 patients
Garret Zallen 8.6 patients 8.2 patients
Conclusions
• Encounter closures: On average, Zallen and Krishnaswami closed
encounters sooner on days they did not have a scribe. Silen appears to
benefit from the scribe in this respect, closing encounters much later on
days he did not have the scribe.
• CPT Codes: Comparing clinic days with the scribe and without the scribe, it
is apparent that they lead to greater level 3 and level 4 billing (99213,
99214).
• Patient Volume: Daily patient volume was averaged per provider with and
without the scribe. All providers saw more patients on the days that the
scribe was present.

Pediatric surgery clinic

  • 1.
    Pediatric Surgery Clinic DataAnalysis Are medical scribes effective in the outpatient setting? Scribe Impact for providers: Sanjay Krishnaswami, MD, Mark Silen, MD and Garret Zallen, MD
  • 2.
    Analysis & Methods Utilizingfinancial data, the analysis pulls from five months of visit/billing data at the Doernbecher Pediatric Surgery clinic when the scribe was in the office and out of the office. We considered both new and established patients, and divided the date per provider based on their varying methods for closing encounters and utilizing the scribe. • Period of analysis: May 1, 2012 – September 30, 2012 We considered the following questions: • Are encounters closed faster with a scribe? • Is the clinic billing at a higher CPT code with a scribe? • Has patient volume increased with the scribe?
  • 3.
  • 4.
    0 5 10 15 20 25 30 May 2012 June2012 July 2012 August 2012 Sept 2012 Length(Days) Monthly Average Krishnaswami Encounter Closures May 1, 2012 – September 30, 2012 SCRIBE NO SCRIBE
  • 5.
    0 5 10 15 20 25 May 2012 June2012 July 2012 August 2012 Sept 2012 Length(Days) Monthly Average Silen Encounter Closures May 1, 2012 – September 30, 2012 SCRIBE NO SCRIBE
  • 6.
    0 2 4 6 8 10 12 May 2012 June2012 July 2012 August 2012 Sept 2012 Length(Days) Monthly Average Zallen Encounter Closures May 1, 2012 – September 30, 2012 SCRIBE NO SCRIBE
  • 7.
  • 8.
    CPT Codes: JayKrishnaswami 0.0% 10.0% 20.0% 30.0% 40.0% 50.0% 60.0% 70.0% 80.0% 90.0% 100.0% 99201 99202 99203 99204 99212 99213 99214 PatientVisits CPT Code May 1, 2012 - September 30, 2012 Scribe No Scribe
  • 9.
    CPT Codes: MarkSilen 0.0% 10.0% 20.0% 30.0% 40.0% 50.0% 60.0% 70.0% 80.0% 90.0% 100.0% 99201 99202 99203 99212 99213 99214 PatientVisits CPT Code May 1, 2012 - September 30, 2012 Scribe No Scribe
  • 10.
    CPT Codes: GarretZallen 0.0% 10.0% 20.0% 30.0% 40.0% 50.0% 60.0% 70.0% 80.0% 90.0% 100.0% 99201 99202 99203 99204 99212 99213 99214 Patientvisits CPT Code May 1, 2012 – September 30, 2012 Scribe No Scribe
  • 11.
  • 12.
    Patient Volume Comparisons Averagedaily patient load with scribe Average daily patient load without scribe Outliers / Considerations Sanjay Krishnaswami 12.7 patients 3.6 patients Majority of Krishnaswami’s patients seen with the scribe in clinic, only 9 days of the five months was he without the scribe. Mark Silen 9.3 patients 7.7 patients Garret Zallen 8.6 patients 8.2 patients
  • 13.
    Conclusions • Encounter closures:On average, Zallen and Krishnaswami closed encounters sooner on days they did not have a scribe. Silen appears to benefit from the scribe in this respect, closing encounters much later on days he did not have the scribe. • CPT Codes: Comparing clinic days with the scribe and without the scribe, it is apparent that they lead to greater level 3 and level 4 billing (99213, 99214). • Patient Volume: Daily patient volume was averaged per provider with and without the scribe. All providers saw more patients on the days that the scribe was present.