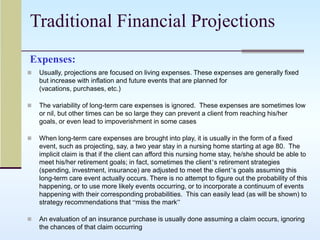
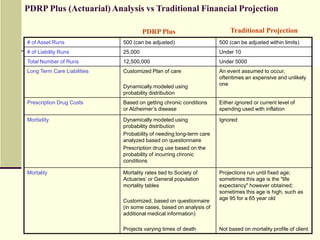
An Actuarial Analysis of Retirement Goals and RisksProbability Distributions for Retirement PlanningA New Tool For Comprehensive Financial Planning ProfessionalsCOPYRIGHT 2009 JACK P PAUL ACTUARY LLC
Developed by Jack P Paul, FSA, MAAA, CLU, ChFC, CASLPresident, Jack P Paul Actuary LLC101 Mill Creek Road Suite CArdmore, PA 19003610-649-2358Website: JackPaulCASL.comJack@Jackpaulcasl.comCopyright 2009 Jack P Paul Actuary
IntroductionThis new tool is a Probability Distribution Of Your Client’s Major Unknown Expense Risks Faced at RetirementLong – term Care Costs
Prescription Drugs
LongevityWhich can be Combined with your Client’sAsset Portfolio
Investment Strategy
Living and Other Expenses (Planned Spending)To Compute the Probabilities of Successfully Meeting the Client’s Goals, including having the Client’s Assets Last For Life.
What can PDRP Plus do for you?PDRP Plus can help you compute the chance that the client will meet his/her goals more accurately and comprehensively than is currently done by financial planning software.PDRP Plus increases the knowledge given to your clients.BECAUSE OF THIS:PDRP Plus will allow you to attract more business, as it will give you an advantage over other financial planners.PDRP Plus can bring in more income per client.
What is Currently Done in Financial Projections To Project the Chances of Meeting Clients’ Goals?
Traditional Financial ProjectionsExpenses:Usually, projections are focused on living expenses. These expenses are generally fixed but increase with inflation and future events that are planned for (vacations, purchases, etc.)
The variability of long-term care expenses is ignored.  These expenses are sometimes low or nil, but other times can be so large they can prevent a client from reaching his/her goals, or even lead to impoverishment in some cases
When long-term care expenses are brought into play, it is usually in the form of a fixed event, such as projecting, say, a two year stay in a nursing home starting at age 80.  The implicit claim is that if the client can afford this nursing home stay, he/she should be able to meet his/her retirement goals; in fact, sometimes the client’s retirement strategies (spending, investment, insurance) are adjusted to meet the client’s goals assuming this long-term care event actually occurs. There is no attempt to figure out the probability of this happening, or to use more likely events occurring, or to incorporate a continuum of events happening with their corresponding probabilities.  This can easily lead (as will be shown) to strategy recommendations that “miss the mark”
An evaluation of an insurance purchase is usually done assuming a claim occurs, ignoring the chances of that claim occurring  Traditional Financial Projections(cont)Time Horizon:The retirement planning time horizon is usually either: until the life expectancy of the client; or a fixed advanced age (say, age 95 for an age 65 client).  This life expectancy of the client is based on general averages, and not on any evaluation of the client’s future mortality possibilities
Note, however, that recently, some software programs now allow a “randomization” of the client’s date of death.  This allows the effects of mortality to enter into the computation of the client’s chances of meeting his goals.  However, it is not customized to the mortality profile of the client; it is based on general averagesPrescription Drugs:Prescription drugs, if modeled, are usually modeled based on the current prescription drug use (with inflation) and not on possible future increased use
Prescription drug use can cost a significant amount of money (even with Medicare Part D), and can have a major impact on the client’s goalsTraditional Financial Projections(cont)Monte Carlo Testing:Asset “Monte Carlo” testing is often done on the client’s asset portfolio to see if the amount of assets, along with the investment strategy, will allow the client to meet his/her goals
This testing is done with one or two expense scenarios, not with a comprehensive analysis of the client’s long-term care, mortality and prescription drug risksTraditional Financial Projections (cont)What are the implications of performing testing this way?By not correctly analyzing the client’s long-term care, mortality and prescription drug risks, recommendations are made that miscalculate the chance of the client’s success in meeting his/her goalsIf that chance is understated, the financial planner often recommends strategies to increase the chance of success.  That would possibly unnecessarily require the client to cut back his/her spending in retirement, which would be a disservice to the client If that chance is overstated, it would lead to some clients failing to have enough money to meet their goals, even though the recommendations of the financial plan were followed
SMARTER PLANNING:These problems are addressed in this new product!
A Probability Distribution of Your Client’s Major Unknown Expense Risks Long Term Care Costs and Prescription Drug CostsCOPYRIGHT 2009 JACK P PAUL ACTUARY LLC
Sample Chart of Client’s Projected Range of Long-Term Care CostsChart displays the Probabilities that the Future Long-Term Care Costs of the Client Will Be Met By Setting Aside Certain Levels of Assets (displayed before tax)Sample 65 year old single male who is insurable at standard rates for long-term care insurance.
He has chosen a plan of long-term care that costs well above the national average, should he need it.COPYRIGHT 2009 JACK P PAUL ACTUARY LLC
Here is a sample graphic of the chart in the previous slide.  The bottom line (X-axis) shows the chances out of 10,000 that the costs will be at or below the level of the blue line.  For instance, for this client, there is, as you can see by the chart in the previous slide, (approximately) a 90% chance that the amount of assets need to provide future long-term costs will be no more than $160,000.COPYRIGHT 2009 JACK P PAUL ACTUARY LLC
The above chart does not display the total dollar costs that may be spent over the client’s lifetime!Those costs are higher than the ones in the chart. Those costs ignore the time value of money  For comparison, the following chart displays the probabilities that the total costs do not exceed the amounts shown:COPYRIGHT 2009 JACK P PAUL ACTUARY LLC
Total dollar costs over the client’s lifetimeCOPYRIGHT 2009 JACK P PAUL ACTUARY LLC
What Makes This Information about Long-Term Care Costs Unique?The long-term care costs for the remaining lifetime of an insurable person can vary very widely, from zero to over a half a million dollars or more (on a present value basis).Those costs are dependent on many things, including:The medical condition of the personThe chances of needing long-term careThe length of time long-term care is needed, and the location where services are receivedThe chances of dyingThe level of comfort and care the person desires, and whether there are unpaid providers availableThe rate of earnings of the client’s assetsThe rate of inflation, and The provisions and features of existing and future long-term care insurance that the person owns or will own. No where else are all these factors combined into one analysis to examine the range of costs, and (as you’ll see later) the effect of an insurance purchase on the range of costs. COPYRIGHT 2009 JACK P PAUL ACTUARY LLC
This Information Is Customized To The ClientCLIENT PROFILE:Appropriate for singles or couples - currently my product handles those 65 and over; soon the ages will be expanded to 55 and overMy product is currently suitable for insurable individuals; soon uninsurable individuals will be addedPLAN OF CARE:A plan of care, in which, after discussions between the client and the financial planning professional, will identify the cost of care and the caretakers (i.e., actual home caretakers, assisted living/nursing home facilities, etc.) in the event home care, assisted living or nursing home  care is needed.  This will include a decision as to whether the spouse or other unpaid person will take care of the client before  paid care is needed.  Note that average costs can always be substituted if desired for the plan of care.  The costs of this plan of care will be incorporated into the projectionCOPYRIGHT 2009 JACK P PAUL ACTUARY LLC
This Information Is Customized To The Client(Cont.)RATES & INSURANCE:The appropriate rate to use to discount long-term care costs in future years, which depends on the client's comfort level as to the future performance of the client's assetsVarious inflation rates chosen in consultation with the clientThe appropriate insurance policy to purchase, if any.  This will be done through comparison of insurance policies and features within policies to see the effect each one has on the total probability distributionCOPYRIGHT 2009 JACK P PAUL ACTUARY LLC
This Information Is Customized To The Client (Cont.)MORBIDITY AND MORTALITY ASSESSMENTSA morbidity screener (a questionnaire, with optional telephone interview and attending physician statements in certain cases) assigns the client to a level of morbidity.  The questionnaire is completed and evaluated by either Jack P Paul Actuary LLC or an outside service  A mortality screener (a questionnaire) is used to assign the client to a level of mortality and a mortality table, which gives the average rate of a person dying  each year, which is used to compute information for the projections.  The questionnaire is completed and (sometimes) sent to an outside firm for evaluation.  These mortality rates are expressed either in terms of the Relative Risk tables of the Society of Actuaries (modified by Jack P Paul Actuary LLC), or, in some cases, on general population mortality tables.  The mortality levels are different depending on smoking status.  A chart of the mortality table, as well as the table itself, are included in the report that is provided.  This information is valuable, as it gives the client a perspective from which to view his financial planThe levels of morbidity and mortality are combined to compute the average time a client can expect to be healthy, needing home care, in an assisted living facility and in a nursing home
This Information Is Customized To The Client (Cont.)For the sample case above, the client will spend, on average, 20.20 years in a healthy state, .85 years needing home care, .51 years in an assisted living facility and .46 years in a nursing homePrescription drug use is based on having/obtaining one or more of six chronic conditions, along with the current levels of prescription drug costs.  Additional costs are incurred with the chances of getting Alzheimer’s disease.  The costs are adjusted if the client has a Medicare Part D type (or other) prescription drug plan
How Long-Term Care Costs are Affected by the Purchase of a Long-Term Care Insurance PolicyThe long-term care insurance policy:Has a four-year benefit period
Has a daily benefit amount of $200/day
Is a comprehensive policy covering both home care (at 100%) as well as facility care
An inflation provision of 5% compound
An annual premium of $4,961 (paid monthly)COPYRIGHT 2009 JACK P PAUL ACTUARY LLC
Comparison of Long-Term Care Costs and Purchase of Long-Term Care Policy (cont.) As you can see from the chart, the insurance “blunts” the higher costs.  For example, there is an 90% chance that the total long-term care costs without insurance will be no more than $160,000.  With the insurance, this amount goes down to $112,000
 This “blunting” has a cost of premiums of $4,961 per year.  In fact, for 81.14% of the time, the present value of long-term care costs with insurance will be higher than the costs without it.  (This calculation will be included in the reports I produce)
 The average percent of premiums paid out in benefits, taking into account this client’s morbidity and mortality profiles and the personalized plan of care was 51.4%.  That means that the insurance company kept 48.6% of the premiums for benefits, expenses and profit.  (This can be interpreted as the company “loss ratio” – the higher the better for the client)COPYRIGHT 2009 JACK P PAUL ACTUARY LLC
Combining the Probability Distribution with the Client’s:Asset Portfolio,Investment Strategy, andExpenses:COPYRIGHT 2009 JACK P PAUL ACTUARY LLC
Computing the Probabilities of  Successfully Meeting the Client’s GoalsIncludes the Client’s Assets lasting throughout lifeThe expenses, investment strategies, assets and other aspects of the client’s plan can be combined with the probability distributions computed to measure the probability of success of the client’s goals:
Having assets last throughout life
Other goals (vacations, education, leaving a specified inheritance, etc.)COPYRIGHT 2009 JACK P PAUL ACTUARY LLC
        How Does the Combining Take Place?Exclusive software created by Jack P Paul Actuary LLC COPYRIGHT 2009 JACK P PAUL ACTUARY LLC
How Does the Combining Take Place? (Cont.)PDRP Plus, to compute the probabilities of successfully meeting the client’s goals,  performs “Monte Carlo” testing on the client’s financial goals. PDRP Plus’s Monte Carlo testing involves simulations of the client’s future financial and health outcomes.  For each simulation, PDRP Plus steps through a possible way the client’s financial situation and health play out, month by month from the client’s current age until death.  Some scenarios last for as little as one month; others can last 50 years or more.  The simulation’s outcome is dependent on the probabilities of different financial and health outcomes occurring.    A simulation is considered successful for a goal if there is enough money to fund that goal at the proper time.  For the goal of having enough money to last the client’s lifetime, the simulation counts that goal as successful if the amount of assets is above a certain client-selected tolerance at death.  The number of scenarios that are successful, divided by the number of runs (often 12,500,000) gives the chance that the client will meet his/her goals.The chances of success are computed by goal.
How Does the Combining Take Place? (Cont.)If the client’s chances for success are too low (as determined by the financial planner and client):Investment, insurance, long-term care plans and non-variable spending strategies can be modified and re-projected if any goals are not met; iterations can be performed until the client is satisfied (or the chances of success maximized)
How Does the Combining Take Place? (Cont.)PDRP Plus:To measure the long-term care and prescription drug expenses, 25,000 random scenarios (Monte Carlo scenarios) are createdThese 25,000 scenarios each give year by year expenses (net of insurance, where applicable) from the start age until deathThe scenarios vary from each other significantly because:Death can occur at any timeThe need for long-term care can occur at any timeThe setting for long term care variesThe amount of prescription drug cost variesCOPYRIGHT 2009 JACK P PAUL ACTUARY LLC
How Does the Combining Take Place?  (cont.)PDRP Plus (cont.):These runs are combined with the other living expenses of the client.  These expenses will increase each year by inflation. These include day-to-day living expenses and other expenses not associated with long-term care and prescription drug expenseAdditional expenses are input for other goals the client may have, such as vacation or the purchase of new cars500 Asset scenarios are created  These 500 Asset scenarios are combined with the fixed expenses and the 25,000 liability scenarios, to produce a total of 12,500,000 “tests” of whether the client’s goals will be reached. Each test that reaches the client’s goals is marked successfulThe number of the “tests” that are marked successful, divided by 12,500,000, gives the chances that the client will meet his/her goals (as previously stated, the number of scenarios can be changed if desired)COPYRIGHT 2009 JACK P PAUL ACTUARY LLC
Asset modeling in PDRP PLUSPDRP Plus works best when the assets, investment strategy and disinvestment strategy of the client are each categorized into one or more of 12 fixed asset classes:Money marketIntermediate-term bondsLong-term bondsInternational Government bondsHigh-yield bondsCommoditiesLarge-cap equityMid-cap equitySmall-cap equityInternational established equityInternational emerging equityREITs
Asset modeling in PDRP PLUS (Cont.)For each asset class, means and variances, along with the covariances between asset classes, are used to project returns on each asset class for the simulations  The information is based on historical data for the asset classes, analyzed using the Capital Asset Pricing Model, and adjusted for future inflation expectationsThese returns can be considered “average” returns for the each class in total.  Within each class, some assets will perform better than the average and some worse than the average The planner can input an additional amount to be added to the mean each year, without changing the variances or covariances, to reflect the additional returns that can be provided by the financial planner over and above the average, less the amount of charges by the planner for advice and administrationThe planner can also “override” means, to grade from current values into historical values; Other overrides can be made if desiredAssets are also classified by tax-qualified statusAdditional information is obtained to compute taxes for the various asset classes.
Other Modeling Considerations in PDRP PLUS Certain assets, such as health savings account balances, insurance policies, and others are treated separatelyIncome of the client is incorporated into the projectionLiabilities of the client are incorporated into the projection
Comparison of a Traditional Projection and an Actuarial AnalysisFor a given client (described on the next slide), here is a computation of the probabilities for meeting the goal of not running out of money before death.Actuarial AnalysisTraditional Projection500 asset runs are performed
 Each run with 25,000 liability runs
500 asset runs are performed
  Each using same liability projectionCOPYRIGHT 2009 JACK P PAUL ACTUARY LLC
Comparison of a Traditional Projection and an Actuarial AnalysisCASE STUDY/CLIENT: Age 65 male, single, no dependents Standard, insurable LTC risk Measured to have expected future mortality similar to the mortality underlying the RR100 	Society of Actuaries Mortality Table (as modified by Jack P Paul Actuary LLC) Has $400K of assets, all non-qualified The assets were characterized into the nine asset classes mentioned earlier; only four asset  	classes were relevant to the client’s portfolio – Money market, Intermediate term bonds, 	Large Cap stocks and Small Cap stocks	Taxes are paid on the total gains each year, with carryforward of unused losses. All values 	are tracked at market, so no extra gain or loss occurs at asset sale   Plans to spend down his assets for living expenses at the rate of $1,000 per month in 2010, 	increasing after that by 3% per year (over and above income)Goal: That his money will last the rest of the client’s life.COPYRIGHT 2009 JACK P PAUL ACTUARY LLC
Comparison of a Traditional Projection and an Actuarial Analysis (cont.)Actuarial AnalysisTraditional ProjectionLTC costs based on customized plan of care
Prescription drugs – normalized to client’s current use
Morbidity and mortality profiles used
500 asset runs combined with 25,000 liability runs
Goal is to have assets last for life
Goal is measured by how many of the 12,500,000 runs have assets greater than zero when client dies
500 Asset runs using one set of spending
Done two ways: Assuming client lives to 85; assuming client lives to 95
LTC event: Client will need a two year stay in a nursing home with higher than average cost at age 80 (same cost level as was used in the actuarial analysis), then recover – the LTC scenario was set this way because it was felt that if there is enough money for the client with this scenario, the client will be in a good financial position.  COPYRIGHT 2009 JACK P PAUL ACTUARY LLC
Comparison of a Traditional Projection and an Actuarial Analysis (cont.)RESULTSActuarial AnalysisTraditional ProjectionChance of meeting goal: 81%
Chance of meeting goal if living expenses are reduced by 10%: 86%

PDRP PLUS DETAILED PRODUCT PRESENTATION

  • 1.
    An Actuarial Analysisof Retirement Goals and RisksProbability Distributions for Retirement PlanningA New Tool For Comprehensive Financial Planning ProfessionalsCOPYRIGHT 2009 JACK P PAUL ACTUARY LLC
  • 2.
    Developed by JackP Paul, FSA, MAAA, CLU, ChFC, CASLPresident, Jack P Paul Actuary LLC101 Mill Creek Road Suite CArdmore, PA 19003610-649-2358Website: JackPaulCASL.comJack@Jackpaulcasl.comCopyright 2009 Jack P Paul Actuary
  • 3.
    IntroductionThis new toolis a Probability Distribution Of Your Client’s Major Unknown Expense Risks Faced at RetirementLong – term Care Costs
  • 4.
  • 5.
    LongevityWhich can beCombined with your Client’sAsset Portfolio
  • 6.
  • 7.
    Living and OtherExpenses (Planned Spending)To Compute the Probabilities of Successfully Meeting the Client’s Goals, including having the Client’s Assets Last For Life.
  • 8.
    What can PDRPPlus do for you?PDRP Plus can help you compute the chance that the client will meet his/her goals more accurately and comprehensively than is currently done by financial planning software.PDRP Plus increases the knowledge given to your clients.BECAUSE OF THIS:PDRP Plus will allow you to attract more business, as it will give you an advantage over other financial planners.PDRP Plus can bring in more income per client.
  • 9.
    What is CurrentlyDone in Financial Projections To Project the Chances of Meeting Clients’ Goals?
  • 10.
    Traditional Financial ProjectionsExpenses:Usually,projections are focused on living expenses. These expenses are generally fixed but increase with inflation and future events that are planned for (vacations, purchases, etc.)
  • 11.
    The variability oflong-term care expenses is ignored. These expenses are sometimes low or nil, but other times can be so large they can prevent a client from reaching his/her goals, or even lead to impoverishment in some cases
  • 12.
    When long-term careexpenses are brought into play, it is usually in the form of a fixed event, such as projecting, say, a two year stay in a nursing home starting at age 80. The implicit claim is that if the client can afford this nursing home stay, he/she should be able to meet his/her retirement goals; in fact, sometimes the client’s retirement strategies (spending, investment, insurance) are adjusted to meet the client’s goals assuming this long-term care event actually occurs. There is no attempt to figure out the probability of this happening, or to use more likely events occurring, or to incorporate a continuum of events happening with their corresponding probabilities. This can easily lead (as will be shown) to strategy recommendations that “miss the mark”
  • 13.
    An evaluation ofan insurance purchase is usually done assuming a claim occurs, ignoring the chances of that claim occurring Traditional Financial Projections(cont)Time Horizon:The retirement planning time horizon is usually either: until the life expectancy of the client; or a fixed advanced age (say, age 95 for an age 65 client). This life expectancy of the client is based on general averages, and not on any evaluation of the client’s future mortality possibilities
  • 14.
    Note, however, thatrecently, some software programs now allow a “randomization” of the client’s date of death. This allows the effects of mortality to enter into the computation of the client’s chances of meeting his goals. However, it is not customized to the mortality profile of the client; it is based on general averagesPrescription Drugs:Prescription drugs, if modeled, are usually modeled based on the current prescription drug use (with inflation) and not on possible future increased use
  • 15.
    Prescription drug usecan cost a significant amount of money (even with Medicare Part D), and can have a major impact on the client’s goalsTraditional Financial Projections(cont)Monte Carlo Testing:Asset “Monte Carlo” testing is often done on the client’s asset portfolio to see if the amount of assets, along with the investment strategy, will allow the client to meet his/her goals
  • 16.
    This testing isdone with one or two expense scenarios, not with a comprehensive analysis of the client’s long-term care, mortality and prescription drug risksTraditional Financial Projections (cont)What are the implications of performing testing this way?By not correctly analyzing the client’s long-term care, mortality and prescription drug risks, recommendations are made that miscalculate the chance of the client’s success in meeting his/her goalsIf that chance is understated, the financial planner often recommends strategies to increase the chance of success. That would possibly unnecessarily require the client to cut back his/her spending in retirement, which would be a disservice to the client If that chance is overstated, it would lead to some clients failing to have enough money to meet their goals, even though the recommendations of the financial plan were followed
  • 17.
    SMARTER PLANNING:These problemsare addressed in this new product!
  • 18.
    A Probability Distributionof Your Client’s Major Unknown Expense Risks Long Term Care Costs and Prescription Drug CostsCOPYRIGHT 2009 JACK P PAUL ACTUARY LLC
  • 19.
    Sample Chart ofClient’s Projected Range of Long-Term Care CostsChart displays the Probabilities that the Future Long-Term Care Costs of the Client Will Be Met By Setting Aside Certain Levels of Assets (displayed before tax)Sample 65 year old single male who is insurable at standard rates for long-term care insurance.
  • 20.
    He has chosena plan of long-term care that costs well above the national average, should he need it.COPYRIGHT 2009 JACK P PAUL ACTUARY LLC
  • 21.
    Here is asample graphic of the chart in the previous slide. The bottom line (X-axis) shows the chances out of 10,000 that the costs will be at or below the level of the blue line. For instance, for this client, there is, as you can see by the chart in the previous slide, (approximately) a 90% chance that the amount of assets need to provide future long-term costs will be no more than $160,000.COPYRIGHT 2009 JACK P PAUL ACTUARY LLC
  • 22.
    The above chartdoes not display the total dollar costs that may be spent over the client’s lifetime!Those costs are higher than the ones in the chart. Those costs ignore the time value of money For comparison, the following chart displays the probabilities that the total costs do not exceed the amounts shown:COPYRIGHT 2009 JACK P PAUL ACTUARY LLC
  • 23.
    Total dollar costsover the client’s lifetimeCOPYRIGHT 2009 JACK P PAUL ACTUARY LLC
  • 24.
    What Makes ThisInformation about Long-Term Care Costs Unique?The long-term care costs for the remaining lifetime of an insurable person can vary very widely, from zero to over a half a million dollars or more (on a present value basis).Those costs are dependent on many things, including:The medical condition of the personThe chances of needing long-term careThe length of time long-term care is needed, and the location where services are receivedThe chances of dyingThe level of comfort and care the person desires, and whether there are unpaid providers availableThe rate of earnings of the client’s assetsThe rate of inflation, and The provisions and features of existing and future long-term care insurance that the person owns or will own. No where else are all these factors combined into one analysis to examine the range of costs, and (as you’ll see later) the effect of an insurance purchase on the range of costs. COPYRIGHT 2009 JACK P PAUL ACTUARY LLC
  • 25.
    This Information IsCustomized To The ClientCLIENT PROFILE:Appropriate for singles or couples - currently my product handles those 65 and over; soon the ages will be expanded to 55 and overMy product is currently suitable for insurable individuals; soon uninsurable individuals will be addedPLAN OF CARE:A plan of care, in which, after discussions between the client and the financial planning professional, will identify the cost of care and the caretakers (i.e., actual home caretakers, assisted living/nursing home facilities, etc.) in the event home care, assisted living or nursing home care is needed. This will include a decision as to whether the spouse or other unpaid person will take care of the client before paid care is needed. Note that average costs can always be substituted if desired for the plan of care. The costs of this plan of care will be incorporated into the projectionCOPYRIGHT 2009 JACK P PAUL ACTUARY LLC
  • 26.
    This Information IsCustomized To The Client(Cont.)RATES & INSURANCE:The appropriate rate to use to discount long-term care costs in future years, which depends on the client's comfort level as to the future performance of the client's assetsVarious inflation rates chosen in consultation with the clientThe appropriate insurance policy to purchase, if any. This will be done through comparison of insurance policies and features within policies to see the effect each one has on the total probability distributionCOPYRIGHT 2009 JACK P PAUL ACTUARY LLC
  • 27.
    This Information IsCustomized To The Client (Cont.)MORBIDITY AND MORTALITY ASSESSMENTSA morbidity screener (a questionnaire, with optional telephone interview and attending physician statements in certain cases) assigns the client to a level of morbidity. The questionnaire is completed and evaluated by either Jack P Paul Actuary LLC or an outside service A mortality screener (a questionnaire) is used to assign the client to a level of mortality and a mortality table, which gives the average rate of a person dying each year, which is used to compute information for the projections. The questionnaire is completed and (sometimes) sent to an outside firm for evaluation. These mortality rates are expressed either in terms of the Relative Risk tables of the Society of Actuaries (modified by Jack P Paul Actuary LLC), or, in some cases, on general population mortality tables. The mortality levels are different depending on smoking status. A chart of the mortality table, as well as the table itself, are included in the report that is provided. This information is valuable, as it gives the client a perspective from which to view his financial planThe levels of morbidity and mortality are combined to compute the average time a client can expect to be healthy, needing home care, in an assisted living facility and in a nursing home
  • 28.
    This Information IsCustomized To The Client (Cont.)For the sample case above, the client will spend, on average, 20.20 years in a healthy state, .85 years needing home care, .51 years in an assisted living facility and .46 years in a nursing homePrescription drug use is based on having/obtaining one or more of six chronic conditions, along with the current levels of prescription drug costs. Additional costs are incurred with the chances of getting Alzheimer’s disease. The costs are adjusted if the client has a Medicare Part D type (or other) prescription drug plan
  • 29.
    How Long-Term CareCosts are Affected by the Purchase of a Long-Term Care Insurance PolicyThe long-term care insurance policy:Has a four-year benefit period
  • 30.
    Has a dailybenefit amount of $200/day
  • 31.
    Is a comprehensivepolicy covering both home care (at 100%) as well as facility care
  • 32.
  • 33.
    An annual premiumof $4,961 (paid monthly)COPYRIGHT 2009 JACK P PAUL ACTUARY LLC
  • 34.
    Comparison of Long-TermCare Costs and Purchase of Long-Term Care Policy (cont.) As you can see from the chart, the insurance “blunts” the higher costs. For example, there is an 90% chance that the total long-term care costs without insurance will be no more than $160,000. With the insurance, this amount goes down to $112,000
  • 35.
    This “blunting”has a cost of premiums of $4,961 per year. In fact, for 81.14% of the time, the present value of long-term care costs with insurance will be higher than the costs without it. (This calculation will be included in the reports I produce)
  • 36.
    The averagepercent of premiums paid out in benefits, taking into account this client’s morbidity and mortality profiles and the personalized plan of care was 51.4%. That means that the insurance company kept 48.6% of the premiums for benefits, expenses and profit. (This can be interpreted as the company “loss ratio” – the higher the better for the client)COPYRIGHT 2009 JACK P PAUL ACTUARY LLC
  • 37.
    Combining the ProbabilityDistribution with the Client’s:Asset Portfolio,Investment Strategy, andExpenses:COPYRIGHT 2009 JACK P PAUL ACTUARY LLC
  • 38.
    Computing the Probabilitiesof Successfully Meeting the Client’s GoalsIncludes the Client’s Assets lasting throughout lifeThe expenses, investment strategies, assets and other aspects of the client’s plan can be combined with the probability distributions computed to measure the probability of success of the client’s goals:
  • 39.
    Having assets lastthroughout life
  • 40.
    Other goals (vacations,education, leaving a specified inheritance, etc.)COPYRIGHT 2009 JACK P PAUL ACTUARY LLC
  • 41.
    How Does the Combining Take Place?Exclusive software created by Jack P Paul Actuary LLC COPYRIGHT 2009 JACK P PAUL ACTUARY LLC
  • 42.
    How Does theCombining Take Place? (Cont.)PDRP Plus, to compute the probabilities of successfully meeting the client’s goals, performs “Monte Carlo” testing on the client’s financial goals. PDRP Plus’s Monte Carlo testing involves simulations of the client’s future financial and health outcomes. For each simulation, PDRP Plus steps through a possible way the client’s financial situation and health play out, month by month from the client’s current age until death. Some scenarios last for as little as one month; others can last 50 years or more. The simulation’s outcome is dependent on the probabilities of different financial and health outcomes occurring. A simulation is considered successful for a goal if there is enough money to fund that goal at the proper time. For the goal of having enough money to last the client’s lifetime, the simulation counts that goal as successful if the amount of assets is above a certain client-selected tolerance at death. The number of scenarios that are successful, divided by the number of runs (often 12,500,000) gives the chance that the client will meet his/her goals.The chances of success are computed by goal.
  • 43.
    How Does theCombining Take Place? (Cont.)If the client’s chances for success are too low (as determined by the financial planner and client):Investment, insurance, long-term care plans and non-variable spending strategies can be modified and re-projected if any goals are not met; iterations can be performed until the client is satisfied (or the chances of success maximized)
  • 44.
    How Does theCombining Take Place? (Cont.)PDRP Plus:To measure the long-term care and prescription drug expenses, 25,000 random scenarios (Monte Carlo scenarios) are createdThese 25,000 scenarios each give year by year expenses (net of insurance, where applicable) from the start age until deathThe scenarios vary from each other significantly because:Death can occur at any timeThe need for long-term care can occur at any timeThe setting for long term care variesThe amount of prescription drug cost variesCOPYRIGHT 2009 JACK P PAUL ACTUARY LLC
  • 45.
    How Does theCombining Take Place? (cont.)PDRP Plus (cont.):These runs are combined with the other living expenses of the client. These expenses will increase each year by inflation. These include day-to-day living expenses and other expenses not associated with long-term care and prescription drug expenseAdditional expenses are input for other goals the client may have, such as vacation or the purchase of new cars500 Asset scenarios are created These 500 Asset scenarios are combined with the fixed expenses and the 25,000 liability scenarios, to produce a total of 12,500,000 “tests” of whether the client’s goals will be reached. Each test that reaches the client’s goals is marked successfulThe number of the “tests” that are marked successful, divided by 12,500,000, gives the chances that the client will meet his/her goals (as previously stated, the number of scenarios can be changed if desired)COPYRIGHT 2009 JACK P PAUL ACTUARY LLC
  • 46.
    Asset modeling inPDRP PLUSPDRP Plus works best when the assets, investment strategy and disinvestment strategy of the client are each categorized into one or more of 12 fixed asset classes:Money marketIntermediate-term bondsLong-term bondsInternational Government bondsHigh-yield bondsCommoditiesLarge-cap equityMid-cap equitySmall-cap equityInternational established equityInternational emerging equityREITs
  • 47.
    Asset modeling inPDRP PLUS (Cont.)For each asset class, means and variances, along with the covariances between asset classes, are used to project returns on each asset class for the simulations The information is based on historical data for the asset classes, analyzed using the Capital Asset Pricing Model, and adjusted for future inflation expectationsThese returns can be considered “average” returns for the each class in total. Within each class, some assets will perform better than the average and some worse than the average The planner can input an additional amount to be added to the mean each year, without changing the variances or covariances, to reflect the additional returns that can be provided by the financial planner over and above the average, less the amount of charges by the planner for advice and administrationThe planner can also “override” means, to grade from current values into historical values; Other overrides can be made if desiredAssets are also classified by tax-qualified statusAdditional information is obtained to compute taxes for the various asset classes.
  • 48.
    Other Modeling Considerationsin PDRP PLUS Certain assets, such as health savings account balances, insurance policies, and others are treated separatelyIncome of the client is incorporated into the projectionLiabilities of the client are incorporated into the projection
  • 49.
    Comparison of aTraditional Projection and an Actuarial AnalysisFor a given client (described on the next slide), here is a computation of the probabilities for meeting the goal of not running out of money before death.Actuarial AnalysisTraditional Projection500 asset runs are performed
  • 50.
    Each runwith 25,000 liability runs
  • 51.
    500 asset runsare performed
  • 52.
    Eachusing same liability projectionCOPYRIGHT 2009 JACK P PAUL ACTUARY LLC
  • 53.
    Comparison of aTraditional Projection and an Actuarial AnalysisCASE STUDY/CLIENT: Age 65 male, single, no dependents Standard, insurable LTC risk Measured to have expected future mortality similar to the mortality underlying the RR100 Society of Actuaries Mortality Table (as modified by Jack P Paul Actuary LLC) Has $400K of assets, all non-qualified The assets were characterized into the nine asset classes mentioned earlier; only four asset classes were relevant to the client’s portfolio – Money market, Intermediate term bonds, Large Cap stocks and Small Cap stocks Taxes are paid on the total gains each year, with carryforward of unused losses. All values are tracked at market, so no extra gain or loss occurs at asset sale Plans to spend down his assets for living expenses at the rate of $1,000 per month in 2010, increasing after that by 3% per year (over and above income)Goal: That his money will last the rest of the client’s life.COPYRIGHT 2009 JACK P PAUL ACTUARY LLC
  • 54.
    Comparison of aTraditional Projection and an Actuarial Analysis (cont.)Actuarial AnalysisTraditional ProjectionLTC costs based on customized plan of care
  • 55.
    Prescription drugs –normalized to client’s current use
  • 56.
  • 57.
    500 asset runscombined with 25,000 liability runs
  • 58.
    Goal is tohave assets last for life
  • 59.
    Goal is measuredby how many of the 12,500,000 runs have assets greater than zero when client dies
  • 60.
    500 Asset runsusing one set of spending
  • 61.
    Done two ways:Assuming client lives to 85; assuming client lives to 95
  • 62.
    LTC event: Clientwill need a two year stay in a nursing home with higher than average cost at age 80 (same cost level as was used in the actuarial analysis), then recover – the LTC scenario was set this way because it was felt that if there is enough money for the client with this scenario, the client will be in a good financial position. COPYRIGHT 2009 JACK P PAUL ACTUARY LLC
  • 63.
    Comparison of aTraditional Projection and an Actuarial Analysis (cont.)RESULTSActuarial AnalysisTraditional ProjectionChance of meeting goal: 81%
  • 64.
    Chance of meetinggoal if living expenses are reduced by 10%: 86%