Download to read offline


![3
Unfortunately, rigorous evidence is limited on the effectiveness of different schemes that provide health
insurance to the informal sector, specifically on the potential role of MFIs in marketing and delivering the
insurance products and the schemes’ ability to reduce out-of-pocket (OOP) expenditures and increase
utilization of quality health services. One of the main reasons for this lack of evidence is the difficulty
in making causal inferences from cross-sectional studies. Typically, those who are more likely to be
sick or utilize health services will also be more likely to enroll in voluntary health insurance programs.
Thus comparing outcomes for those with health insurance to those without health insurance is likely to
confound these other factors that are correlated with the choice to purchase insurance and give biased
results.
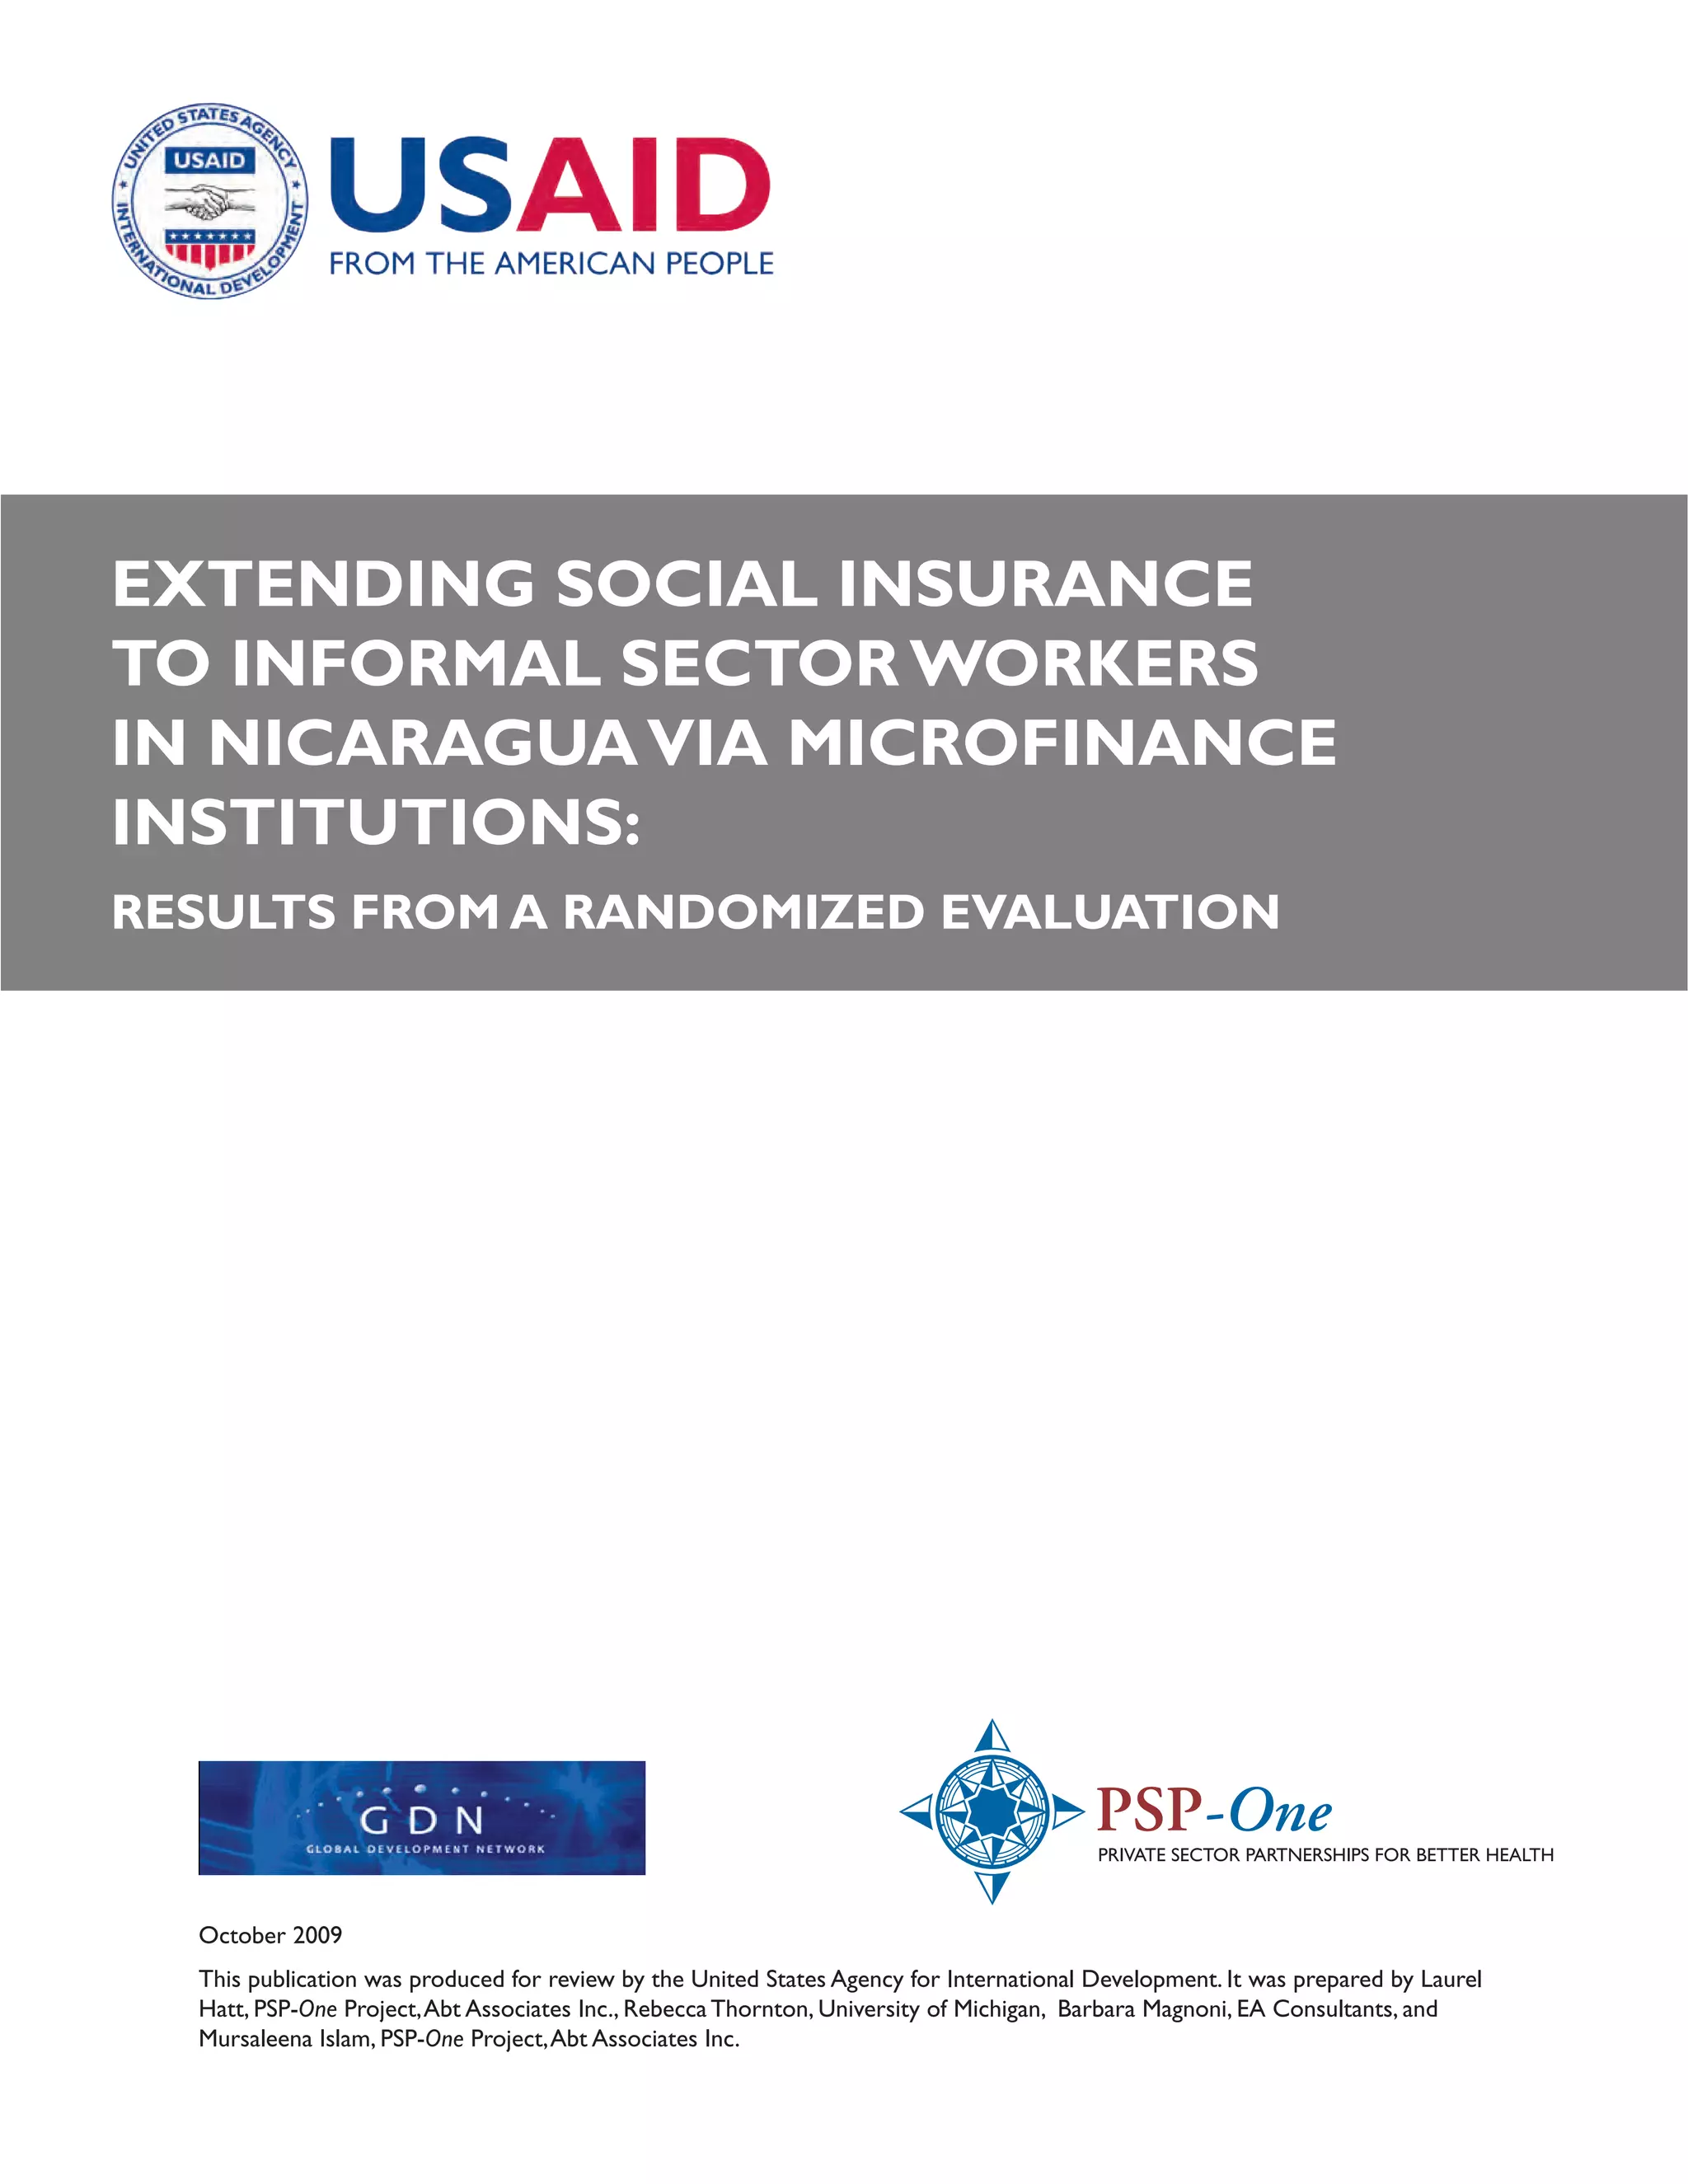
1.2 Summary of evaluation approach and research
questions
The main goals of this evaluation were to assess the effectiveness of offering health insurance to the
informal sector, both with and without the assistance of MFIs, and to measure the impact of insurance
on access to affordable health care, including RH/FP, for this population. The study introduced an
experimental component in which individuals were allocated health insurance subsidies of varying
amounts by a “lottery,” thereby reducing the effects of selection bias by disproportionately encouraging
enrollment among a randomly chosen subset. Individuals were also randomly assigned to sign up for the
insurance either at the main INSS office or at one of three participating MFIs. Our evaluation enables
evidenced-based recommendations with respect to expanding the program within Nicaragua and to
adapting the model to other countries that wish to extend health insurance to the informal sector.
The following are several key research questions for this project:
• What are the determinants of health insurance enrollment among informal sector workers in
Nicaragua?
º Does simply providing information about insurance encourage enrollment?
º How does reducing the cost of insurance premiums affect enrollment?
º How does increasing the convenience of the enrollment process affect enrollment?
º To what extent is adverse selection observed?
º To what extent does using MFIs as insurance intermediaries affect enrollment?
• What is the impact of health insurance on utilization (especially of maternal and child health services
[MCH] and RH/FP) and expenditures within this population?
• What are the determinants of retention in the insurance program?
º How does MFI status affect retention?
1.3 Organization of report
The report continues in section 2 with a brief overview of the Nicaraguan context, background on
the INSS program and pilot demonstration project, and information about implementation challenges
that may affect interpretation of results. Section 3 describes both quantitative and qualitative methods
used for the evaluation. Section 4 details findings, while section 5 interprets these findings and provides
recommendations. Section 6 presents conclusions from this evaluation.](https://image.slidesharecdn.com/pdacp309-140915062303-phpapp01/85/Pdacp309-19-320.jpg)


![15
4. Findings
This section begins by summarizing descriptive results from the baseline and follow-up surveys. Results
are then organized thematically, according to the key research questions addressed in the study.
Qualitative findings are integrated throughout the section according to the relevant themes.
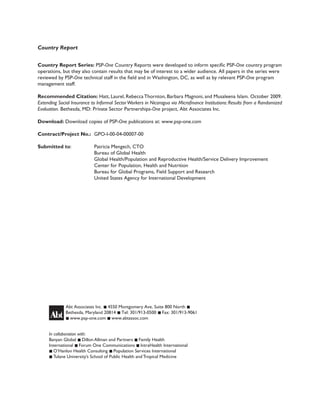
4.1 Sample characteristics at baseline and follow-up
For the analysis of the determinants of health insurance enrollment and the effect of having health
insurance, we included in our analysis the 2,608 respondents who completed interviews at both baseline
and follow-up. In addition to presenting average baseline and follow-up demographic characteristics of
the entire sample, we also present the average baseline statistics separately for MFI clients and non-MFI
clients in Annex A. This allows for understanding the potential effectiveness of targeting MFI clients for
insurance products.
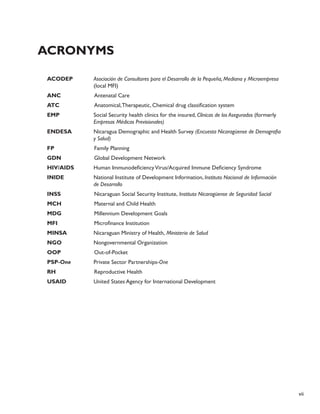
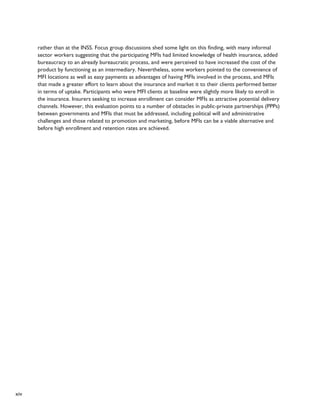
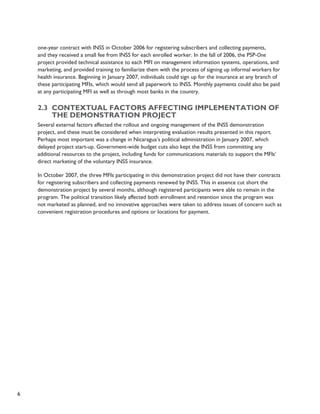
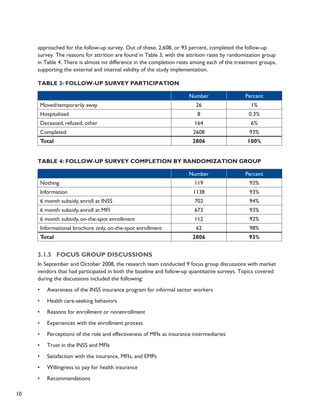
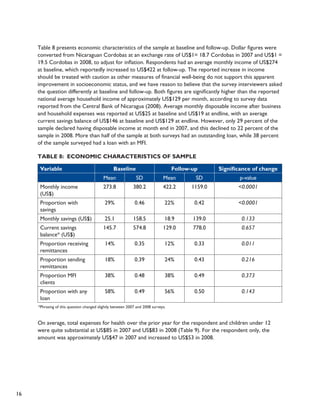
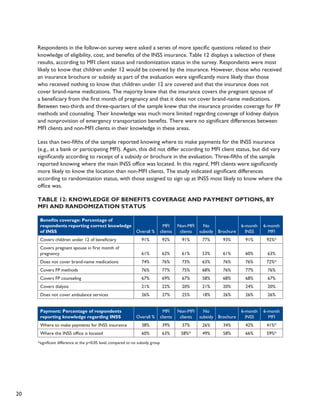
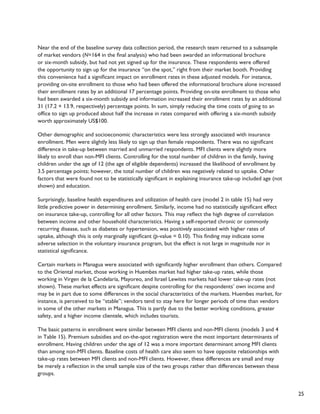
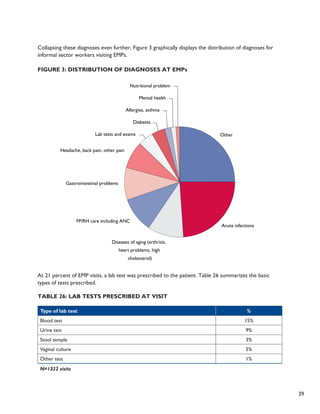
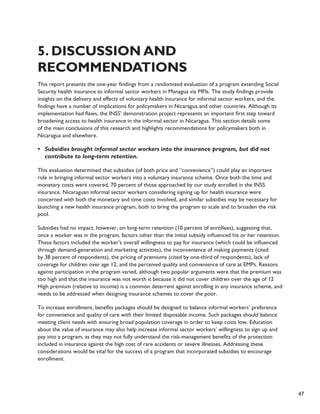
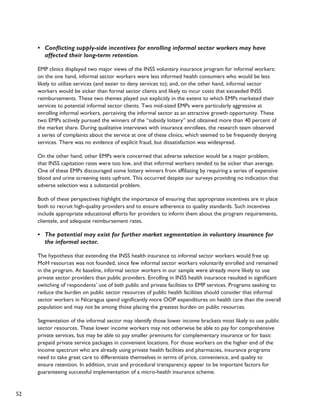
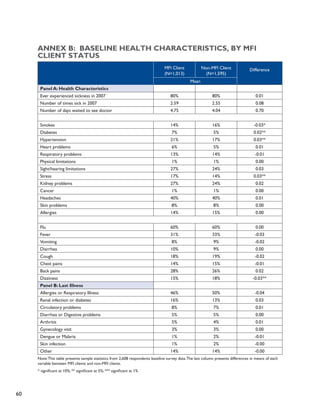
Table 7 presents some key demographic characteristics of the sample [mean and standard deviation
(SD) are shown]. The average age was 38 years at baseline with 35 percent of respondents being male.
These individuals averaged approximately 9.3 years of education, and 70 percent were married or had a
common-law spouse. This is higher than the 2006 countrywide figure of 56 percent (INIDE and MINSA
2007). On average, respondents had two children, while two-thirds had at least one child under age
12—the maximum age for coverage of dependents by the INSS health insurance. Only 3 percent of the
sample was pregnant or had a spouse who was pregnant, either at baseline or follow-up.
Table 7: Demographic Characteristics of Sample
Variable Baseline Follow-up Significance of change
Mean SD Mean SD (where appropriate)
Age 37.8 9.4 38.8 9.4 (NA)
Male 35% 0.48 * (NA)
Years of education 9.3 4.2 * 5 (NA)
Married 70% 0.46 72% 0.45 <0.0001
Number of children 2.04 1.52 * (NA)
Has children under 12 66% 0.47 66% 0.47
Pregnant 3% 0.18 3% 0.17 0.812
Smokes 15% 0.36 14% 0.35 0.007
*Question not repeated at follow-up
There were some differences in basic demographic characteristics between MFI clients and non-MFI
clients (see Annex A, Panel A). In particular, MFI clients were a little more than two years older on
average and were more likely to be female; only 28 percent of the MFI clients were male as opposed to
almost 40 percent of the non-MFI clients. In addition, MFI clients had slightly more children. There were
no differences in years of education or in the likelihood of being married or pregnant.](https://image.slidesharecdn.com/pdacp309-140915062303-phpapp01/85/Pdacp309-31-320.jpg)
![22
We also probed the topic of information and awareness during our focus group discussions with market
vendors. Findings generally aligned with the quantitative survey results. Few participants in focus group
discussions had heard of the INSS insurance program for informal workers prior to the baseline survey.
They were confused about what benefits the insurance covered; specifically, some participants thought
the insurance provided benefits during old age, perhaps confusing the product with INSS’ pension
services. Participants noted difficulties in obtaining clear information about the program, particularly
from the MFIs. Several MFI clients noted that they had never received any information about the
program from their MFI. A few were skeptical of the program and its legitimacy, and worried that they
might get “trapped” into paying for the insurance after the subsidy expired. One individual commented,
“The majority of Nicaraguans…don’t have the level of confidence that other countries have in their
Social Security system.” Among the key recommendations participants suggested were better provision
of information about what benefits were covered, how to enroll, what fees would be charged, and how
to make payments.
“I think that is the reason that most people don’t pay into the insurance; we don’t know where to do it
or with whom to do it. I think there needs to be more publicity…”
–MFI client who won a subsidy but did not enroll [Huembes market]
Eight participants reported that they never received any proof of their insurance enrollment from INSS.
This led to confusion about whether the program was “real,” whether they were indeed covered, and
when they could start using services.2�
“I was told that… they would notify me when I could use the insurance—a thing that never happened.
After a week passed, then two weeks, I said that it was a real joke because they never notified me. Then
eight months later, a statement arrived that I owed two months of insurance payments.”
– Non-MFI client that enrolled [Oriental market]
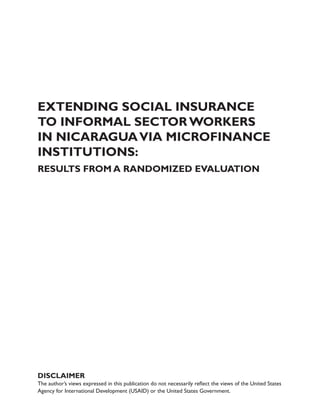
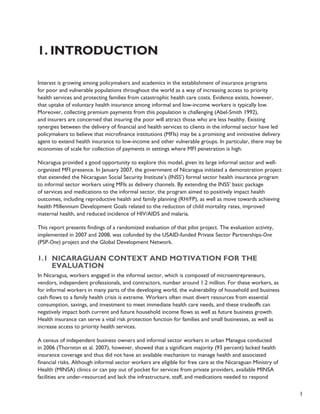
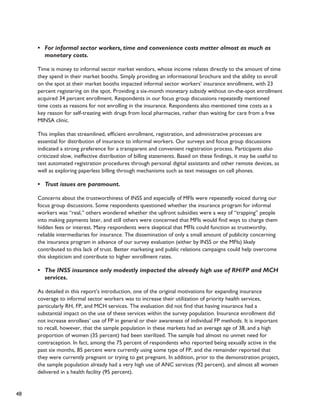
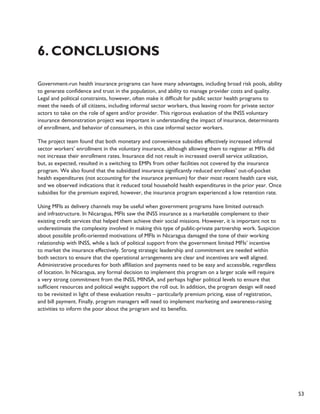
4.3 Determinants of insurance enrollment
A key research question in this study addressed the extent to which providing information on insurance
programs, offering premium subsidies, or increasing the convenience of enrollment would affect rates of
enrollment in the INSS voluntary insurance by informal sector workers. This section details researchers’
findings related to the determinants of enrollment.
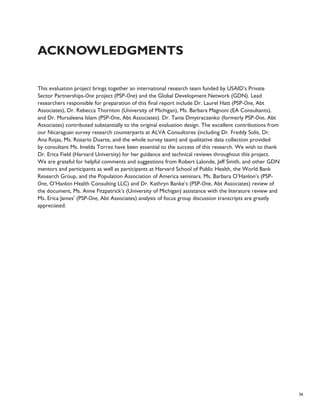
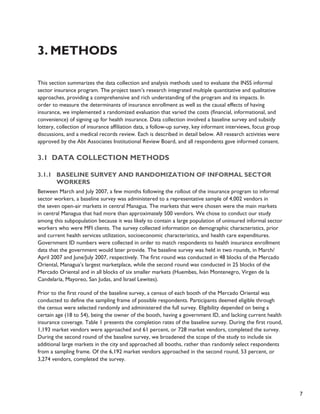
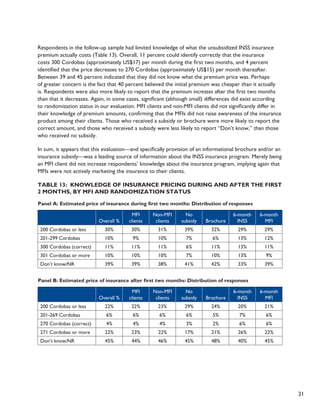
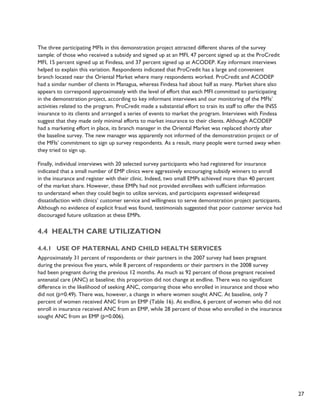
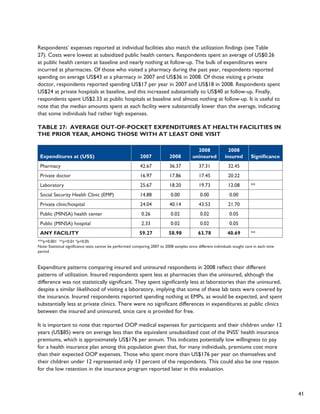
Overall, out of those who were interviewed in both the baseline and the follow-up, we found that 20.3
percent signed up for insurance. Table 14 summarizes enrollment rates according to randomization
group. Among those in the sample who could enroll at the INSS office or an MFI (N=2,446), 18.2
percent enrolled. Almost none of the “pure controls” in this sample (those who received no information
or subsidy) and almost none of those who received only an informational brochure enrolled. Slightly
more than one-third of those who received a six-month subsidy enrolled: 32 percent of those
randomized to enroll at a participating MFI and 37 percent of those assigned to enroll at the main INSS
office. The difference in uptake of insurance between these latter two subsidy groups was marginally
statistically significant (p=0.08).
2 Another potential source of confusion about enrollment derived from the failure of INSS to deliver monthly billing statements. Under the tra-ditional
INSS (formal sector) insurance scheme, couriers on motorbikes hand deliver monthly statements to each employer’s office; this system
was administratively burdensome for the dispersed informal sector workers, and an alternate system was not developed. Although some work-ers
received their statements, this was not always reliable and this may have caused more confusion.](https://image.slidesharecdn.com/pdacp309-140915062303-phpapp01/85/Pdacp309-38-320.jpg)
![26
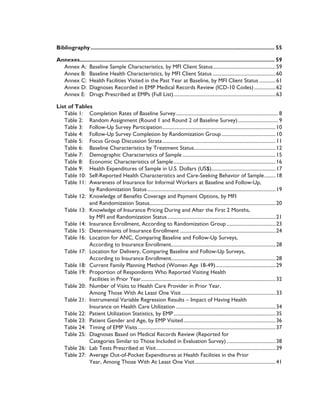
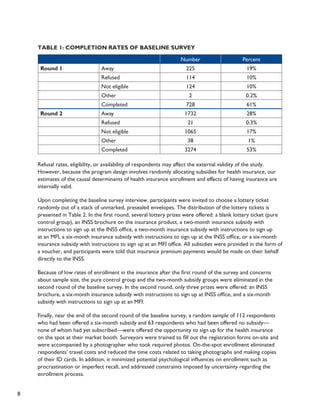
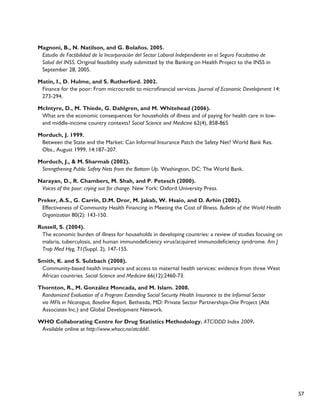
Overall, individuals adhered to their randomly assigned location for enrollment. Of those who were
offered six-month subsidies to sign up at INSS, almost all who signed up (98 percent) did so at the INSS.
Similarly, of those who were offered six-month subsidies to sign up at a participating MFI, 99 percent of
those who signed up did so at an MFI. Among the 17 who received the informational brochure only and
enrolled, 15 signed up at the INSS office (88 percent).
In general, focus group discussions elicited similar themes regarding reasons for enrolling or not
enrolling in the insurance, although they also provided additional context and clarification for
quantitative results related to the role of MFIs as insurance intermediaries. The main reasons
respondents gave for enrolling (in addition to receiving a free subsidy) were to secure medical attention
for their children, to have insurance as protection in case of a medical emergency, and to make frequent
check-ups more affordable. Reasons against participation in the program varied, although two popular
arguments were that the premium was too high and that the insurance wasn’t worth it because it did
not cover children over the age of 12. Two respondents mentioned that they did not enroll because
they feared having to continue to pay after the six-month trial period ended, suggesting a lack of trust in
the survey lottery itself.
We explored the finding that respondents assigned to enroll at an MFI were less likely to enroll than
those assigned to enroll at INSS. Focus group participants confirmed a preference for enrolling in the
insurance directly with INSS, rather than through intermediary MFIs. INSS was reportedly perceived to
be a more stable institution, whereas MFIs were potentially vulnerable to bankruptcy and possibly less
trustworthy. Respondents noted that health insurance was the regular “business” of INSS, whereas MFIs
were not experts in health or health insurance.
“INSS knows the benefits, what’s not covered, while the MFI is a lending institution and doesn’t
understand [health]. Health is not its specialty; its thing is money.”
– MFI client that enrolled [Oriental market]
“INSS is more flexible because it is part of the government, it is an institution that will never go
bankrupt…”
– Non-MFI client that enrolled [Oriental market]
Several discussants expressed concern that MFIs were liable to charge hidden fees or interest for
providing insurance services and that MFIs were only concerned with their own business interests. Many
believed that MFIs lacked the stability and transparency that is found in state institutions such as INSS
and that at any point they might dissolve.
“There are MFIs that are here today and gone tomorrow…they take your savings, it is very complicated
and there is no security.”
– Non-MFI client that did not enroll [Oriental market]
However, others expressed a preference to make routine payments at banks and MFIs, noting that
there were long waiting lines at the INSS office. Several people commented on the distance to INSS’
headquarters office as being too far and as such were not impressed with the program’s accessibility.
Three participants suggested that INSS should open more branch offices throughout Managua to make
it easier to register. Multiple respondents reported never receiving documentation of their insurance
enrollment, making it impossible to obtain care from an EMP.](https://image.slidesharecdn.com/pdacp309-140915062303-phpapp01/85/Pdacp309-42-320.jpg)
![34
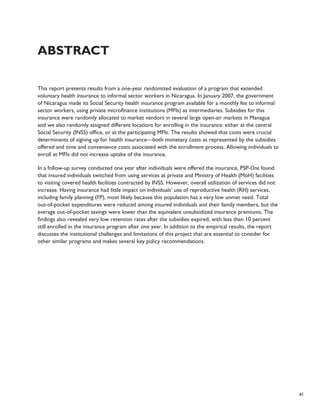
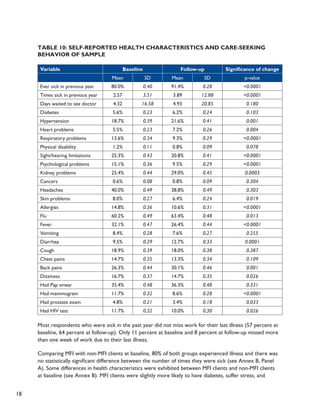
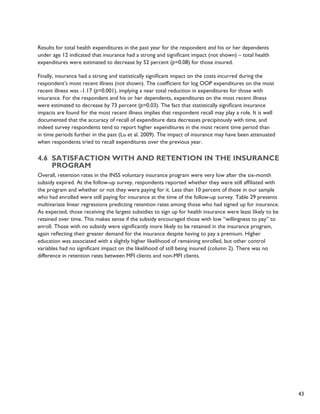
controls for self-selection into the insurance. Specifically, we analyzed the effects of being insured by
instrumenting insurance enrollment with the respondent’s randomization status, that is, having been
randomly offered a six-month subsidy. Table 21 displays the results of these instrumental variables
regressions. Each line in the table reflects a separate regression model. The models also controlled for
age, age squared, gender, education, marital status, MFI client status, total number of children, a binary
indicator for having children under age 12, and market location. For the regressions with “any visit”
as the outcome, the displayed coefficient can be interpreted as the percentage point difference in the
probability of visiting a given health facility, comparing those with insurance to those without insurance
after controlling for selection bias. Likewise, for the regressions with “number of visits” as the outcome,
the coefficient can be interpreted as the difference in the average number of visits per year to a given
health facility, comparing those with insurance to those without insurance and controlling for selection
bias.
Table 21: Instrumental Variable Regression Results – Impact of
Having Health Insurance on Health Care Utilization
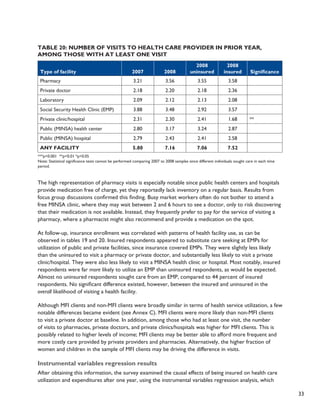
Type of facility
Any visit Number of Visits
Coeff. Std. Err. Coeff. Std. Err.
Pharmacy -0.025 [0.044] 0.406 [0.443]
Private doctor 0.022 [0.038] 0.034 [0.121]
Laboratory -0.076 [0.054] -0.139 [0.207]
EMP 0.428 [0.027]** 1.546 [0.144] **
Private clinic/hospital -0.091 [0.050] -0.483 [0.181] **
Public (MINSA) health center -0.058 [0.047] -0.406 [0.245]
Public (MINSA) hospital -0.119 [0.040]** -0.175 [0.151]
ANY FACILITY 0.003 [0.034] 1.291 [0.990]
Note: This table presents the impact of having health insurance on having visited each provider and the number of visits to that health provider
(unconditional on any visit) at the follow-up survey. Having insurance is instrumented with randomization status. Controls for the baseline visits
are also included. Each coefficient is from a separate regression.
* p<0.05 ** p<0.01
Overall, enrolling in health insurance did not lead to an increase in the probability of respondents
seeking any health care from a provider. There was, however, fairly substantial substitution away from
use of public and private facilities into EMP facilities covered by the INSS insurance. Those who were
insured were 42.8 percent more likely to have attended an EMP in the past year, 9.1 percent less likely
to have visited a private clinic, and 11.9 percent less likely to have visited a public health center than the
uninsured. MFI and non-MFI clients exhibited no difference in this pattern of substitution. Importantly,
although pharmaceuticals were covered under the INSS insurance and could be obtained free of charge
from EMPs, insured respondents did not significantly reduce their visits to pharmacies.
Having health insurance increased the total number of health care visits by about 1.29 visits per
respondent per year, but this result was not statistically significant. The insured also exhibited a similar
pattern of substitution away from visits to public and private providers into free EMP visits. The analysis](https://image.slidesharecdn.com/pdacp309-140915062303-phpapp01/85/Pdacp309-50-320.jpg)
![40
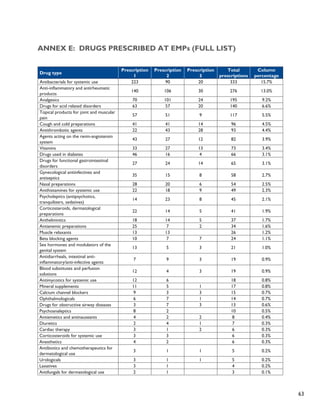
Diagnostic imaging, which is covered by the INSS insurance, was prescribed at 9 percent of visits. The
most common procedure prescribed was an ultrasound (4.3 percent) followed by x-rays (2.1 percent)
and EKGs (0.9 percent). Drugs are also covered by the insurance and were prescribed at 82 percent of
EMP visits. The full list of prescribed drugs (coded according to the ATC classification system [http://
www.whocc.no/atcddd/]) is included in Annex E. Figure 4 summarizes prescribed drugs, listing the top
20 categories, which account for 90 percent of prescribed drugs. Antibiotics, anti-inflammatories, and
analgesics accounted for almost 40 percent of drugs prescribed.
Figure 4: Distribution of Drugs Prescribed
Antibacteri als
Anti-inflammatories
Analgesi cs
Antaci ds
Ointments for joint/mus cle pain
Beta blocking ag ents
Muscle relax ants
Antianemic prepar ations
Anthelmin tics
Corticoster oids
Psycholept ics
Antihistami nes
Nasal preparations
Vaginal antiinfecti ves
Diabetes dr ugs
Vitamins
Blood pressure drugs
Antithrombotic a gents
Cough/cold me dicine
Gastrointestinal d rugs
Othe rs
4.5 Out-of-pocket expenditures
4.5.1 Descriptive results
The baseline and follow-up surveys collected information on both the total OOP health expenditures
over the previous 12 months per individual and family and the amount these participants spent on their
last illness. Respondents reported OOP expenses in both public and private facilities. For the previous
12 months, total expenses for the respondent and his or her dependent children were US$85 at
baseline and decreased slightly to US$83 at follow-up (see Table 9), while expenses for the respondent
alone were US$47 at baseline and increased to US$53 at follow-up. These expenditures are substantially
higher than OOP family health costs in the general population (US$28), according to the 2003 national
Encuesta Nicaragüense de Demografía y Salud (ENDESA) survey, even with considering an additional $12
adjustment for inflation over the period.](https://image.slidesharecdn.com/pdacp309-140915062303-phpapp01/85/Pdacp309-56-320.jpg)
![42
At baseline, MFI clients reported higher health care expenditures (approximately US$7 more) and
laboratory costs were significantly higher among MFI clients. This is likely due to the higher income
levels of MFI clients rather than higher levels of sickness, as the difference in health expenditures is
eliminated after controlling for income.
4.5.2 Instrumental variable regression results
Finally, the research team examined the causal effects that being insured had on the respondent’s OOP
health expenditures after one year, again using the instrumental variables regression analysis, which
controls for self-selection into the insurance. The effects of being insured were instrumented with the
respondent’s randomization status, and the models were adjusted for baseline OOP expenditures, age,
age squared, gender, education, marital status, MFI client status, number of children, children under age
12, and market location (coefficients not shown). We modeled the natural logarithm of expenditures
(adjusted for those with zero expenditures by adding 0.01) to account for the highly skewed distribution
of spending. The coefficients in Table 28 can thus be interpreted as the percentage change in OOP health
expenditures at a given facility, comparing those respondents with insurance to those without insurance
after controlling for selection bias. Each line in the table reflects a separate regression model.
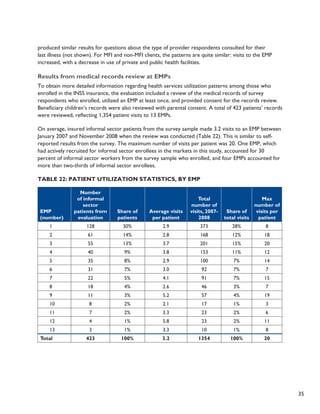
Table 28: Instrumental Variable Regression Results – Effect of
Having Insurance on Respondent’s Log OOP Expenditures During the
Prior Year
Type of facility Coeff. Std. Err. Significance
Pharmacy -0.658 [0.330] *
Private doctor 0.184 [0.244]
Laboratory -0.939 [0.346] **
Private clinic/hospital -0.734 [0.322] *
Public (MINSA) health center 0.012 [0.034]
Public (MINSA) hospital -0.007 [0.030]
ANY FACILITY -0.532 [0.329]
Note: This table presents the impact of having health insurance on log expenditures at each provider (unconditional on having visited) at the
follow-up survey. Having insurance is instrumented with randomization status. Controls for the baseline visits are also included. Each coefficient
is from a separate regression.
* p<0.05; **p<0.01
Overall, we were unable to detect a statistically significant decrease in the respondent’s own total
OOP health expenditures over the prior year due to insurance enrollment. The coefficient on total
expenditures is negative (-0.532), but the decrease is not statistically significant (p=0.11). Expenditures
at some types of facilities, however, did decrease significantly. Having health insurance reduced
respondents’ OOP expenditures at pharmacies by 66 percent. This implies that some reported
pharmacy use may have been at the pharmacies within EMPs and/or that the types of medications
insured respondents purchased at private pharmacies cost less. Health insurance enrollment also
resulted in a large and significant decrease in laboratory expenses (which are covered by the insurance)
and in expenditures at private health clinics and hospitals. There was no impact on expenses at public
sector facilities, where care is typically free.](https://image.slidesharecdn.com/pdacp309-140915062303-phpapp01/85/Pdacp309-58-320.jpg)
![44
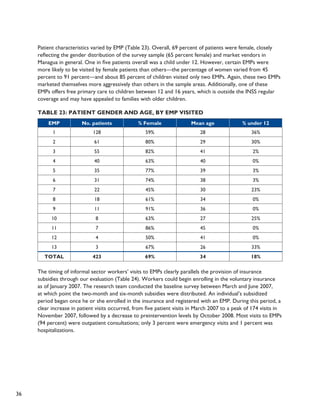
Table 29: Determinants of Insurance Retention, Among Those who
Enrolled
Outcome variable: Still enrolled in
insurance program at follow-up (0/1)
All 6-Month Subsidy Winners Only
(1) (2)
All
(3)
MFI Client
(4)
Non-MFI
Client
(5)
Information -0.632* -0.637*
6-month subsidy, enroll at INSS -0.910** -0.927**
6-month subsidy, enroll at MFI -0.895** -0.924** 0.006 0.058 -0.03
Information only, on-the-spot enrollment -0.267 -0.282
6-month subsidy, on-the-spot enrollment 0.193 0.218
Male 0.001 0.016 0.012 -0.099 0.055
Years of education 0.010** 0.009** 0.007 0.015* 0.001
Married 0.026 0.027 0.031 0.008 0.033
MFI client 0.016 -0.003 -0.007 0 0
Number of children -0.007 -0.006 -0.006 -0.002 -0.005
Has children under 12 -0.018 0.004 -0.018 0.019 -0.038
Log (income) -0.003 0.007 0.036 0.004
Has any savings 0.019 0.014 -0.045 0.047
Smokes -0.035 -0.03 0.101 -0.056
Any chronic disease -0.032
Ever sick 0.002
Log (costs of health care) 0.000
Number of visits to provider 0.002
Any visit to provider 0.038
Constant 1.044 0.922* 0.142 0.369** 0.191
[0.265] [0.142] [0.133] [0.021] [0.218]
Observations 530 470 387 157 230
R-squared 0.07 0.11 0.04 0.14 0.05
Note: This table presents multivariate linear regressions on still paying for health insurance at the follow-up survey. Each column also includes
market dummy variables and baseline survey round dummy variables as well as controls for age and age squared. “Any chronic disease” includes
diabetes, hypertension, cardiac problems, physical disability, psychological problems, kidney problems, and cancer. The sample includes only those
respondents who had enrolled in insurance. * significant at p<0.05; ** significant at p<0.01
We found generally the same pattern of determinants of retention in comparing MFI clients and non-
MFI clients. Given the small sample size of those who signed up for insurance (especially, for example,
among those receiving the informational brochure only), we restricted the sample to those who were
offered six-month subsidies (columns 3–5) in order to test whether differences in retention resulted
from assignment to enroll at MFIs or at the INSS. MFI clients who signed up at an MFI branch were 5.8](https://image.slidesharecdn.com/pdacp309-140915062303-phpapp01/85/Pdacp309-60-320.jpg)
![46
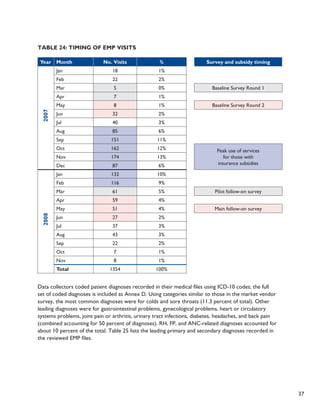
Table 31: Selected Indicators of Satisfaction with EMP Care,
According to Retention in the Insurance Program
Indicator % of total
% of those
no longer
enrolled:
% of those still
paying premiums
EMP could locate respondent in computer system 94% 93% 98%
It was easy for respondent to obtain medicine 88% 86% 100% **
Respondent had no problem obtaining service 80% 78% 87%
Doctor explained respondent’s condition 77% 77% 78%
Respondent’s problem was resolved 76% 74% 84%
Respondent would go back to this EMP in the future 61% 57% 85% ***
EMP reception was “friendly” 61% 62% 58%
**p<0.01 ***p<0.001
Those who were no longer enrolled in the insurance were also asked the main reasons why they were
not paying for continued coverage. The reason respondents most commonly reported (Table 32)
was the inconvenience of having to go to an external location to make payments (equally likely to be
reported both by those assigned to enroll with an MFI and those assigned to enroll with INSS). Expense
was also high on the list of reasons. Respondents less commonly reported problems with quality of care
at the EMPs as a reason.
Table 32: Reasons Given for Not Paying Premiums for Insurance
Indicator %
Too inconvenient to go – time involved 38%
Other 35%
Too expensive 32%
No need for it – don’t often get sick 11%
Did not like the administrative staff 8%
Could not get the medicine I needed 7%
Did not like the doctor/nurse 5%
Doctor was rude 3%
Focus group participants indicated mixed attitudes towards EMPs. When asked about the quality of
service given at local EMPs, an equal number of participants referenced specific negative experiences and
specific positive experiences. The three most heavily enrolled EMPs all received mixed reviews. One
individual commented, “I have seen that there are some EMPs where [service] is deficient; as such, we
have opted on many occasions to take our children to private clinics because the service is of a better
quality.”](https://image.slidesharecdn.com/pdacp309-140915062303-phpapp01/85/Pdacp309-62-320.jpg)
![50
• The INSS insurance did reduce out-of-pocket expenditures for informal sector workers
but not by enough to cover the cost of the premium for most individuals.
Expenditures at pharmacies, laboratories, and private clinics all dropped significantly as a result of
insurance enrollment. These three types of facilities, especially pharmacies, were the main contributors
to OOP spending for the survey sample at baseline, which makes this a critical finding. At follow-up,
total health expenditures in the past year for the respondent and his or her eligible dependents were
52 percent lower (p=0.08) while expenditures related to the respondent and dependents’ most recent
illness episode were 73 percent lower (p=0.03).
It is important to note, however, that the expected value of the benefits covered by the insurance
(e.g., the amount that insured respondents would have spent without insurance) was still less than the
equivalent full cost of INSS premiums, for all but 13 percent of sample respondents. This cost recovery
structure is generally in line with insurance premium pricing in other contexts, but it likely functioned as
a disincentive for respondents to remain enrolled in the insurance once subsidies expired. For informal
sector workers, greater market segmentation in premium pricing according to socioeconomic status
may be needed to encourage lower income workers to purchase insurance. Even with more low-cost
products available, the target population has had limited access to health insurance. Efforts to increase
the public’s awareness of the value of health insurance for risk-management purposes rather than only
as an alternative to OOP expenditures would likely be helpful in the marketing of such products.
• Initial hopes that MFIs could increase insurance enrollment and retention were not
met, and the potential of MFIs could not be rigorously evaluated through this study.
In this evaluation, respondents who received a subsidy and were assigned to enroll at an MFI were
less likely to enroll in the INSS insurance than those who were assigned to enroll at the central INSS
office. This finding is in stark contrast to expectations in advance of the study. We hypothesized that
MFIs would facilitate higher uptake of insurance, given their ongoing relationship with many market
vendors and their convenience to the markets themselves. What occurred instead was that respondents
indicated a preference for interacting with INSS directly for enrollment and insurance payments, rather
than working through intermediary MFIs. Some expressed doubts about the expertise of MFIs in dealing
with health-related issues, and others were suspicious that the MFIs would try to profit from the
arrangement.
“INSS knows the benefits, what’s not covered, while the MFI is a lending institution and doesn’t
understand [health]. Health is not its specialty; its thing is money.”
– MFI client that enrolled [Oriental market]
“INSS is more flexible because it is part of the government, it is an institution that will never go bankrupt …”
– Non-MFI client that enrolled [Oriental market]
However, a variety of factors limited the extent to which the project team could draw broader
conclusions about the potential of MFIs from this study. Specifically, substantial program implementation
problems, many of which were linked to the political transition occurring simultaneously in Nicaragua
when the program was rolled out, constrained the team’s interpretation of results. The change](https://image.slidesharecdn.com/pdacp309-140915062303-phpapp01/85/Pdacp309-66-320.jpg)

![55
Bibliography
Abel-Smith, B. 1992.
Health insurance in developing countries: Lessons from experience. Health Policy and Planning 7(3):
215-226.
Ahuja, R., and J. Jütting. 2004.
Are the poor too poor to demand health insurance? Journal of Microfinance 6:1, 1-20.
Alderman, H., and C.H. Paxson. 1994.
Do the poor insure? A synthesis of the literature on risk and consumption in developing countries.
Economics in a changing world: Proceedings of the Tenth World Congress of the International
Economic Association, Moscow, Volume 4, Development, Trade and the Environment. E. Bacha, New
York: St. Martin’s Press; London: Macmillan Press in association with the International Economic
Association.
Atim, C. 1999.
Social movements and health insurance: A critical evaluation of voluntary, non-profit insurance
schemes with case studies from Ghana and Cameroon. Social Science and Medicine 48, 881–896.
Behrman, J., and J. Knowles. 1999.
The demand for health insurance in Vietnam. Mimeo.
Carrin, G., M.P. Waelkens, and B. Criel. 2005.
Community-based health insurance in developing countries: A study of its contribution to the
performance of health financing systems. Tropical Medicine and International Health 10, 799–811.
Central Bank of Nicaragua. 2008.
Nicaragua en chifras 2007 [Nicaragua in figures 2007]. Available online at http://www.bcn.gob.ni/.
Chankova, S., S. Sulzbach, and F. Diop. 2008.
Impact of mutual health organizations: Evidence from West Africa. Health Policy and Planning, 23(4):
264-276.
Chin-Quee, D., E. Keyes, and B. Janowitz. 2009.
Impact of the Banking on Health intervention to increase the provision of family planning services by
INSS-contracted private health care providers in Nicaragua: Final report. Bethesda, MD: Private Sector
Partnerships-One Project (Abt Associates Inc.).
Churchill, C. 2003.
Insurance work for microfinance institutions: A technical guide to developing and delivering microinsurance.
InFocus Programme for Small Enterprise Development, International Labor Organization, Geneva.
Churchill, C., and M. Cohen. 2006.
Marketing Microinsurance. Churchill, C. (ed.), In Protecting the poor: A microinsurance compendium,
International Labor Organization, Geneva.](https://image.slidesharecdn.com/pdacp309-140915062303-phpapp01/85/Pdacp309-71-320.jpg)
![56
Dercon, S. (2002).
Income risk, coping strategies and safety nets. The World Bank Research Observer 17(2), 141-166.
Dercon, S., M. Kirchberger, J. W. Gunning, and J. Platteau. (2008).
Literature Review on Microinsurance. European Development Research Network.
Dror, D., and A. Preker. 2002.
Social Reinsurance: A New Approach to Sustainable Community Health Financing. Washington, DC: The
World Bank.
Fafchamps, M. 1998.
Risk sharing, quasi-credit, and the enforcement of informal contracts. Mimeograph, Department of
Economics, Stanford University.
Franco, L., F. Diop, C. Burgert, A. Kelley, M. Makinen, and C. Simpara. (2008).
Effects of mutual health organizations on use of priority health-care services in urban and rural Mali: a
case-control study. Bulletin of the World Health Organization 86(11):830-8.
Gine, X., R.M. Tonsend, and J. Vickery. 2007.
Patterns of Rainfall Insurance Participation in Rural India. Policy Research Working Paper Series 4408, The
World Bank.
Gumber, A. and V. Kulkarni. (2000).
Health Insurance for Informal Sector: Case Study of Gujarat. Economic and Political Weekly, 30 Sept
2000.
Hatt, L., R. Thornton, B. Magnoni, and M. Islam. (2009).
Extending Social Security Insurance to Informal Sector Workers in Nicaragua via Microfinance
Institutions: Results from a Randomized Evaluation. DRAFT Final Report for USAID – June 2009.
Bethesda, MD: Private Sector Partnerships-One Project (Abt Associates Inc.) and Global Development
Network.
Instituto Nacional de Información de Desarrollo (INIDE) and Ministerio de Salud (MINSA).
2007.
Encuesta Nicaragüense de Demografía y Salud (ENDESA) 2006/07, Informe Preliminar [Nicaragua
Demographic and Health Survey 2006/07, Preliminary Report]. http://www.inec.gob.ni/endesa/
InformePrel07.pdf.
Jakab, M., and C. Krishnan. 2001.
Community involvement in health care financing: A survey of the literature on the impacts, strengths
and weaknesses. World Bank/CMH Discussion Paper, Washington DC, World Bank.
Jowett, M. 2003.
Do informal risk sharing networks crowd out public voluntary health insurance? Evidence from
Vietnam. Applied Economics 35: 1153-1161.
Lu, C., B. Chin, G. Li, and C.J. Murray. 2009.
Limitations of methods for measuring out-of-pocket and catastrophic private health expenditures.
Bulletin of the World Health Organization 87(3):238-244D.](https://image.slidesharecdn.com/pdacp309-140915062303-phpapp01/85/Pdacp309-72-320.jpg)


This randomized evaluation assessed the impact of extending health insurance to informal sector workers in Nicaragua through microfinance institutions (MFIs). The study randomly assigned subsidies for insurance premiums and locations for enrollment (at MFIs or the Social Security Institute). Insurance increased use of covered health facilities but not overall utilization. It reduced out-of-pocket costs but savings were lower than premiums. Retention rates were very low after subsidies expired. While insurance lowered financial barriers, uptake and continued participation remained challenging due to costs relative to incomes and perceptions of the value of insurance among informal workers.


