1. Design practice on sensors for the new smart media
building for nomadic workers at VEGA Park
As a research assistant for MIT’s Media
Laboratory class, I aided in editing The
VEGA Park Project, which is a forthcoming
book edited by the MIT Mobile Experience
Laboratory that examines design’s interac-
tivity with the community. I developed my
research skills under the tutelage of Profes-
sor Casalegno regarding user experience
design research and design practice on
sensors for the new smart media building
for nomadic workers at VEGA Park. This
project was relevant to my research inter-
ests because it explored social design for
humans.
1. P-case project: Interaction and visualiza-
tion: Twitter sentiment analysis based on
data mining
2. P-case project: Interaction and visualiza-
tion: Visualization based on eco-friendly
sensors
MIT Mobile Experience lab
Designer & Researcher
Advisor Professor Federico Casalegno
- Participated in user-experience design
research and design practice regarding
sensors for the new smart media building
for nomadic workers in VEGA Park.
Portfolio | Helena Hayoun Won | 5
2. Introduction
About Pandora
and addressed the ways buildings and the
built environment, new media and tech-
nologies, and people are evolving.
Pandora is a new building project for VEGA
Park led by Architect Stefano Alonzi of Aqua
Engineering. VEGA Park is located in Mestre,
an old industrial area of Venice, Italy.
Surrounded by buildings of traditional
industry, it will stand as a landmark of smart
design and attract new kinds of businesses
and entrepreneurial ventures to the area.
Pandora is a living organism, producing
energy and breathing through nano- func-
tional membranes that clean the air as it
flows through the building. Pandora is a
green building and is flexible, with dynamic
spaces. Open spaces can be created up to
600m2, as required. Pandora is a smart
building, allowing for remote control of any
system, such as automated temperature
control, a central booking system for
common spaces, and avatars for security
Context
In order to inform the work produced in this
project, we focus on two major trends
occurring in the workplace. The first is the
rise of the nomadic worker. More frequently
than ever, workers will operate from a
variety of locations, and the requirement for
a dedicated workspace is changing. Some
key observations about nomadic workers
are that they maintain flexible hours and are
dispersed between the office and the city.
Working from multiple spaces, they are
tech-savvy and use a variety of technologies
already. They need to be connected with
others and their collaborative work groups
remotely . This user group ties into the
second major trend, which relates to the
environment in which they work.
The non-building theme is a reminder that
workers are moving away from having their
own dedicated workspace and that the goal
of the students is not to design a building.
They are designing connectivity. This is not
an ordinary office—it will address the evolu-
tion of work. Today, there is no distinction
between your personal system and the
system you use for official activity. It is no
longer true that at work you work in a
certain way and at home you work in
another way.
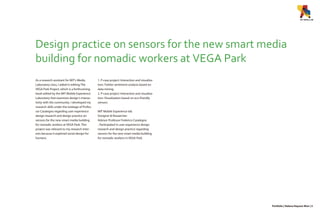
Fig :
Simulation of
Project site :
smart building
of VEGApark,
Venice, Italy,
2011
Portfolio | Helena Hayoun Won | 6
Pre-industrial cities consisted essentially
of skeleton and skin. They provided
shelter and protection, and, through
stacking floors vertically, they enabled
intensification of land use.
Cities of the industrial era acquired
extensive and sophisticated artificial
physiologies: water supply and drainage
systems, energy supply systems, and
mechanized transportation.
Cities of the digital information era are
developing integrated electronic nerv-
ous systems. Cities are starting to oper-
ate as intelligent organisms that make
coordinated responses to changing
conditions and needs.
The MIT Mobile Experience Lab, a
research laboratory at the Massachusetts
Institute of Technology, ran a project on
the topic of New Media Buildings.
This project is in collaboration with VEGA
Park. During the project, they created
visions of the future of media buildings
purposes and infotainment. Finally, Pan-
dora will also have a large LED media
facade to communicate with the city of
Venice and with the building’s occupants.
3. 3. Sensors
4. Sentimental Analysis
Design Pillars
Within the project I focus on four aspects
1. Media Facade
2. Non-Space
Moving away from the notion of a
dedicated work-space then, what is the
future of open-plan, multi-functional
collaborative space?
Pandora will include a media facade
capable of displaying HD video. How
can we design a media facade in an
interesting way, and what will the
experience be?
Sensor networks are becoming increas-
ingly complex, with more and
more capabilities being packed into
smart phones and integrated within the
fabric of cities. How can these open
data be used and how might they
interact with existing structural
networks within Pandora?
Employers are now more sensitive to
the fact that happy workers are good
workers. New technologies can monitor
the mood of different groups of people,
so how might this continuous flow of
data be interpreted to affect personal
and environmental well-being?
Introduction
Designers
Helena Hayoun Won
Hallie Sue Cho
Abstract
P-case
Design Proposals
Interaction / Visualization, and Media
This project encompasses a method for
measuring the mood of the Pandora
community, an activity to engage the
community, and a reward system to
encourage participation. Twitter senti-
ment analysis was used to determine
the mood and represent the result as a
dynamic image that smiles or frowns in
response to real-time Twitter updates.
Community building activities were
designed around the theme of sustain-
ability and represent the impact of
participation as a dynamic image of a
tree that grows and wilts.
The P-case project is mainly concerned
with building a community for Pandora.
In order for Pandora to fully achieve its
mission, it needs a method for measur-
ing the mood of the community, an
activity through which to engage the
community, and a reward system for
being a good member of this commu-
nity.
The P-case is an object that tells the
outside community that the carrier is a
member of the Pandora community-
the P-case is the green badge of honor.
Moreover, the P-case is a tool that
allows communication between mobile
devices and the Pandora cloud comput-
ing system.
Fig :
The Interactive P-case
Portfolio | Helena Hayoun Won | 7
4. Background Research
Visualization & Interaction Proposals
P-case: Twitter sentimental analysis
Fig :
Twitter Sentiment
app analyzes“mit
media lab”
Fig :
Twistori project
displays emotional
tweets in real time
To analyze the mood of the Pandora
community, Twitter was chosen as the
medium because of its wide adoption and
familiarity. Tweets from a community were
analyzed in the context of the community.
The end result is represented as a dynamic
image of a smiling/frowning face that
shows real-time updates from the commu-
nity members and the sentiment behind
them.
There are other existing social networks
where people use status updates to
announce to their community something
that is on their mind. However, Twitter is
unique in the way that it limits status
updates to 140 characters. The by-product
of this limited real estate for expressing
oneself is a set of unusual vocabulary and
sentence structures understood only by
those “in the know.”
Twitter sentiment analysis has been
getting an increasing amount of public
interest of late, and free online tools such
as tweetsentiment1 and tweetfeel2 have
been gaining some traction.
The way these tools work is that, through the
Twitter API, the website is able to search for
all tweets containing the terms a user has
typed into the search box. Using traditional
text analysis—analyzing each word for
positive or negative connotation and analyz-
ing the structure of the sentence to deter-
mine the overall connotation—the website
determines the sentiments of individual
tweets and aggregates them into results
such as 80% smiles and 20% frowns for the
searched subject.
More in-depth Twitter sentiments are being
carried out by media analytics companies,
such as Bluefin Labs. This Cambridge-based
start-up was founded by an MIT Media Lab
professor and specializes in social TV analyt-
ics. Bluefin Labs employs machine learning
to understand the context and meaning of
words to connect the tweets back to events,
people, products, and brands.
Another interesting Twitter sentiment
project is twistori4. Twistori does not analyze
sentiments, but it pulls from the “Twitter-
sphere” all tweets containing the phrases “I
love,”“I hate,” “I think,” “I believe,”and “I wish”
in real time.
Fig :
Highlighted in red
are duplicate words
used in tweets from
a team of 5
Fig :
Red indicates
stress, green for
amused, and yellow
for happy. Highted
in blue are wildcard
words such as no
and not
Design Proposal
Portfolio | Helena Hayoun Won | 8
The result is a pretty powerful live stream
of what people all over the world are
loving, hating, thinking, believing, and
wishing.
As evidenced by Twitter’s ability to capture
an individual group’s unique vocabulary, it
has been shown that any group of people
who spend a significant amount of time
together develop a set of words that has a
certain meaning in the context of the
group. To test this theory, the Twitter API
was used to pull two weeks’ worth of
tweets from a team of five who spend on
average 40 hours per week together.
These tweets were parsed by words, and
any duplicate words, symbols, or phrases
were highlighted. As shown in Figure 95,
more than 90% of the words used in a
tweet are words that have repeat use
within the group. A member from the
team was asked to evaluate a list of key
words pulled from this data set and
categorize them as happy, amused, or
stressed (as shown in Figure 96).
This categorization was determined under
the theory that when people tweet, it is
usually to share something they find
exciting or to announce their current
emotional status. Categorized key words
were used to determine the overall mood
represented by the tweet. Then, the same
person was asked to look at the tweets as a
whole and determine the mood repre-
sented by the aggregate of the tweets
(again, see Figure96). It was found that the
calculated mood was wrong 14% of the
time when the observed mood was
stressed, 8% of the time when the
observed mood was amused, and 6% of
the time when the observed mood was
happy.
Another text analysis was conducted to
see if there was a distinct difference
between the moods behind tweets that
have a work context compared to those
with a personal context. Terms such as
“we,” “our,” “work,” the company’s name,
the product’s name, and a company event
name were used to represent a work
context; and terms such as “I,” “my,” “me,”
“mine,” reference to family, and links to
personal blogs and sites were used to
determine a personal context. With this
5. Fig :
Dynamic image of
the smiling/frowning
face displayed in a
lobby
Fig :
The dynamic image
is displayed in a
lounge
Portfolio | Helena Hayoun Won | 9
information, we found that people in this
team felt positive in a work context 60% of
the time and positive in a personal context
69% of the time.
With this information concerning commu-
nity sentiments, we wanted to create an
impactful display of information such as
twistori . The graphic image of a person’s
head is composed of words highlighted in
color regarding the emotional context, and
this image smiles and frowns depending
on the overall mood of the tweets. As
tweets are pulled from twitter in real time,
people walking by this display will be able
to see how the mood of people in their
community is changing in real time. It will
also display real-time trending topics so
that people are aware of what common
topic people are talking about at that
moment.
This dynamic image can be displayed, for
example, in the lobby or by the elevators
so that, as people are entering and exiting
Pandora, they get real-time updates about
what is happening around them and how
people feel about it. On a smaller scale, the
dynamic image can also be displayed in
the lounge of a particular floor with tweets
limited to workers on that floor only so
that the coworkers get more relevant
updates.
6. Visualization & Interaction Proposals
P-case: Pandora Tree
Background research
Fig :
BMW’s NFC ena-
bled key allows a
user to make pay-
ments with his keys
Fig :
RFID enabled
smartcard trans-
mits information
(as represented by
the green signal
in the upper right
corner)
Fig :
P-case with embed-
ded NFC tag
Fig :
“Checking in”to the
elevator
Fig :
When you check in,
you:“taking the
elevator? try the
stairs next time
please!”and links
to your personal
dashboard
Fig :
Design Proposals
Portfolio | Helena Hayoun Won | 10
As shown in figures 99 and 100, near field
communication (NFC) technology is
currently used to securely transmit infor-
mation wirelessly. When a person pays
with his mobile device, enters a building
with his smart id card, or pays for public
transportation with smartcards, he is using
NFC-enabled devices. NFC uses a tag that
can transmit information over a short
range and a reader that can read the
transmitted information.
NFC is preferred over RFID for cases such as
use of credit cards and identification because
of security issues. RFIDs can be read over long
distances, whereas with NFCs, longer-range
readings are not possible.
As evidenced by the popularity of social
applications such as Foursquare and Face-
book check-in, people are becoming more
comfortable with making certain information
about their activities more readily available to
their social community. Additionally, and
similar to the strategy of stating one’s goals
publicly to further motivate oneself, it is
believed that using social influence can help
motivate people to engage in green activities,
which in terms of this project, would support
Pandora’s mission of sustainability.
Community-building activities were also
designed around the theme of sustainabil-
ity. Pandora encourages its community
members to partake in
green activities, such as taking the stairs
over elevators, recycling, taking public
transportation or cycling, or conserving
resources such as paper, water, and elec-
tricity. As people partake in these green
activities, individuals
gain reward points for green activities and
lose points for wasteful activities.
As a community, this transformation is
represented by a dynamic image of a tree
that will grow or wither depending on the
aggregate points earned over time.
The P-case was designed not only to be a
stylish outward representation of one’s
eco-friendliness—in the likeliness of the
trending upcycled fashion gears—but also
to augment the smartphone’s NFC capabil-
ity. Currently, most smartphones
engaging in NFC-enabled activities use the
phone only as a tag.
But, as more smartphones are released
with an NFC reader, there needs to be a
design that supports the duality of the
phone as a transmitter and a receiver. The
P-case’s NFC tag is strategically placed
away from the reader and is shielded from
the phone to avoid the phone’s reader
from reading its own tag. With this design
(see Figure 101), the phone can act as a
reader and the case as a tag, and the user
can participate in wider range of NFC-
7. Visualization & Interaction Proposals
P-case: Pandora Tree
enabled activities.
With smartphones serving as NFC tags,
users can pay for items such as meals and
transportation and gain access to areas of
the building with their mobile devices.
With smartphones serving as NFC readers,
users can “check in” to an activity. Regard-
ing the case of a user using his P-case to
pay for transportation, while his P-case is
paying the NFC reader, the phone can read
a tag on the pay station and can check him
into a green activity. After each check-in, a
notification will pop up describing the
activity that was engaged in, the amount
of points awarded or lost, and a link to a
personal dashboard where the user can
track his previous history and see how his
actions have impacted the community
tree.
As members of the Pandora community
engage in various activities that do or do
not promote sustainability, the Pandora
tree will grow or wither, respectively. In
addition, flying birds will indicate activity
levels—more birds indicate high levels of
activity, and this imagery can change
seasonally.
The digital tree lives in the cloud, so the
image can be pulled up on a smartphone
or a laptop or can be projected onto
surfaces of varying sizes. During prototyp-
ing, diverse materials, environments, and
scales for the projection were studied to
understand the differences in experience
created by various combinations of these
factors.
Fig :
History of Pandora
tree’s growth
Fig :
Pandora tree
projected onto the
ceiling and your
dashboard lets
you know how you
have contributed
105
Fig :
Various use cases
for tree projection
Fig :
Tree projected to
a clear projectin
glass wall. Note
how the projection
is caught only on
glass
Fig :
tions for projection
set up
8. Links:
1. twittersentiment.appspot.com
2. tweetfeel.com
4. twistori.com
Conclusion:
Fig :
In the future, we
plan on combining
the twitter senti-
ment analysis and
the tree. Using
augmented reality,
when a user scans
can see the tweet
related to this bird
on his phone.
This type of sentiment analysis within teams
and work communities doubled with
community-building activities having a
noble goal, such as sustainability, and can be
applied to any work place that wishes to
develop its own community. Individuals are
not likely to be compelled to engage in
activities that do not have an immediate,
measurable impact, such as recycling or
donating a can of soup.
But as a community, these individual efforts
aggregate into a large measurable impact.
By using strategic data collection and
displaying results in a compelling manner,
individuals can see what part their contribu-
tion played in the larger goal and will have a
more compelling reason to participate.
Visualization & Interaction Proposals
P-case: Pandora Tree
107
Portfolio | Helena Hayoun Won | 12