This document is a financial statement showing collections and revenue sharing between Aptech, an education company, and INDUS CYBER NET, an education center. It details the amounts collected from various courses, the sharing of revenues between Aptech and the center, and payments made. The statement notes that the amounts shown are based on funds available for transfer and are not final customer account statements.
What if I told you that companies are cutting 17.7 percent, on average, from their net annual parcel spends by one person committing 3-4 hours during a 6-8 week period? Contact Transportation Impact to learn more!
This payroll document summarizes Mark Dillon's earnings and deductions for the pay period ending October 15, 2009. It shows he earned $960 for 20 hours of regular work. It lists taxes withheld including social security, Medicare, and federal income taxes totaling $83.04. No pre-tax or after-tax deductions are listed. His current net pay is $876.96.
This document is an e-bill from Citycell for customer MD. Sanoar Hossain. It shows a payment due of 879.00 for the billing period of 05/07/2011 to 04/08/2011. The customer's account number is 810222 and mobile number is 01191018333. It includes charges for pay-per-use, a 5GB ultra 150kbps data plan, on-net outgoing calls, VAT tax, and the total amount due.
Tata Steel ltd calculated its Economic Value Added (EVA) for two periods ending March 2011 and November 2011. Key details:
- NOPAT for period ending March 2011 was Rs. 6,056.61 crore
- Cost of operating capital employed for same period was Rs. 3,671.438 crore
- Resulting EVA for period ending March 2011 was Rs. 2,385.17 crore
- NOPAT for period ending November 2011 was also Rs. 6,056.61 crore
- However, cost of operating capital employed increased to Rs. 6,487.224 crore
- Consequently, EVA for period ending November 2011 was negative at Rs.
The document presents performance data for three banks - Andhra Bank, Union Bank of India, and Allahabad Bank for the fiscal year 2010. It includes key metrics such as total business, total assets, total income, net profit, number of branches, income, expenses, net profit for the year, cash flows, and financial ratios for 2010 and 2011. The performance of the three banks is compared across these various metrics for the years 2010 and 2011.
1. The document provides an overview and financial analysis of Reliance Communications Ltd, an Indian telecommunications company.
2. Key financial details from the profit and loss account and balance sheet for 2012-2009 are presented, including revenues, expenses, assets, liabilities, and profit/loss.
3. Financial ratios like current ratio and quick ratio are calculated for each year to analyze the company's liquidity and ability to meet short-term obligations.
This document provides provisional balance sheet and profit and loss statements for Amber Hospitality Services as of December 31, 2011. It shows total assets of Rs. 54,107,115.38 consisting of fixed assets of Rs. 26,335,914 and current assets of Rs. 29,939,484.38 less current liabilities of Rs. 2,168,283. It reports a net profit of Rs. 5,567,807 for the year ended December 31, 2011. Schedules include details of capital, partners' accounts, unsecured loans, fixed assets, sundry debtors, cash and bank balances, loans and advances, and current liabilities.
This document provides provisional financial statements for Amber Hospitality Services as of December 31, 2011. It includes a balance sheet showing total assets of Rs. 54,107,115.38 including fixed assets of Rs. 26,335,914 and current assets of Rs. 29,939,484.38 less current liabilities of Rs. 2,168,283. It also includes a profit and loss statement for the year ended December 31, 2011 showing total income of Rs. 47,557,320 and net profit of Rs. 5,567,807 which was transferred to partner's current accounts. Various schedules provide additional details on capital, partners' accounts, unsecured loans, fixed assets, debtors and current li
This document provides provisional balance sheet and profit and loss statements for Amber Hospitality Services as of December 31, 2011. It shows total assets of Rs. 54,107,115.38 consisting of fixed assets of Rs. 26,335,914 and current assets of Rs. 29,939,484.38 less current liabilities of Rs. 2,168,283. It reports a net profit of Rs. 5,567,807 for the year ended December 31, 2011. Schedules include details of capital, partners' accounts, unsecured loans, fixed assets, sundry debtors, cash and bank balances, loans and advances, and current liabilities.
This document discusses the business environment and 1Q06 highlights for a company. It saw 23% CAGR in card base expansion in 2006 and competition differentiation through independence. Gross revenue was up 28% YoY in 1Q06 driven by increased market share in profitable segments like CardSystem and MarketSystem. Key strategies for 2006 include expanding market share in cards and markets, implementing a Caixa project, and boosting profits in TeleSystem and Credit&Risk units.
MR Sudhakar Reddy has been billed Rs. 377.08 for telecommunication services provided by Reliance Communications. The bill details recurring charges of Rs. 83.87, voice usage charges of Rs. 258, and taxes of Rs. 35.21. MR Sudhakar Reddy has been asked to pay the total amount due of Rs. 377.08 by September 9th to avoid disconnection of services and late payment charges.
This document provides budget execution details for expenses by cost center and area for the period of January 2010 to May 2010 for the SENA Regional Narino. It shows the budget, obligations, balance, commitments, available budget, balance of commitments, accumulated payments and percentage of payments and execution for various cost centers including contracting of instructors, materials for professional training, student welfare expenses, logistical support, travel expenses for training and certification, curriculum development, and expenses for displaced persons training. The overall percentage of payments was 28.62% and execution was 71.32% across cost centers.
This document provides a budget execution report for expenses by cost center and area for the period of January 2010 to May 2010 for the SENA Regional Narino. It includes budget allocations, obligations incurred, balances, commitments, available budget, and percentages spent for various line items across multiple cost centers, including contracting instructors, materials for professional training, student wellbeing expenses, utilities, rentals, maintenance, and transportation. The overall budget execution rate for the period was 71.32%.
Danaher Corporation announced record first quarter results for 2008. Net earnings increased to $277 million compared to $252 million in the first quarter of 2007. Revenues increased 20% to $3.03 billion. The company saw strong growth in existing businesses but lower demand in some consumer areas. Danaher was encouraged by strong order levels and believes it is well positioned for the rest of 2008.
Time Warner reported financial results for Q4 2008 and full year 2008. Revenue was $12.3 billion for Q4, up 1% for the full year. Adjusted operating income before depreciation and amortization was $3.2 billion for Q4, up 1% for the full year. Free cash flow for 2008 was $6 billion, up 20% from 2007. For 2009, Time Warner expects adjusted EPS excluding Time Warner Cable to be around flat compared to $0.66 in 2008.
TXU Energy Holdings reported strong earnings growth in the first quarter of 2005 compared to the same period last year. Operational earnings from TXU Power drove the majority of the improvement at TXU Energy Holdings. While margins have improved for TXU Power, long-term returns on invested capital still need to be enhanced to meet industry standards. Residential retail gross margins for TXU Energy have remained small, especially compared to other retail sectors. A pending fuel factor adjustment filing aims to balance competitive pressures while maintaining one of the lowest prices to beat in the state.
TXU Energy Holdings reported strong earnings growth in the first quarter of 2005 compared to the same period last year. Operational earnings from TXU Power drove the majority of the improvement at TXU Energy Holdings. While margins have improved for TXU Power, long-term returns on invested capital still need to be enhanced to meet industry standards. Residential retail gross margins for TXU Energy have remained small, especially compared to other retail sectors. A pending fuel factor adjustment filing aims to balance competitive pressures while maintaining one of the lowest fuel factors in the state.
This is an example of a case project we completed in Accounting course where we were given a blank color coded workbook in week one of the course. Each week we were given a packet of required documentation that needed accounted for in the proper areas of record keeping. By week 7 we completed the work book providing closing documents such as bank reconciliations, adj. entries, and closing entries.
(1) The document analyzes the interaction between operating risk and financial risk for Central Equipment Company. It focuses on how operating conditions and risks affect a firm's borrowing decision.
(2) The instructor can illustrate the concepts of operating and financial risk through break-even analysis and examining how changes in sales and profits affect earnings per share under different capital structures.
(3) The analysis shows how operating leverage and financial leverage impact the company's risk as sales and profits fluctuate. It demonstrates the risks of both low and high debt levels for a company with volatile operations.
The document is Britannia's annual report for 2011-12. It provides details of the company's board of directors, auditors, bankers and registered office. It summarizes the company's financial highlights for the year, including an 18% increase in net sales to Rs. 4,947 crores and a 24% rise in profit from operations to Rs. 231.91 crores. On a consolidated basis, net sales grew 19% to Rs. 5,460.75 crores and net profit increased 49% to Rs. 199.55 crores. It also provides an overview of the company's subsidiaries and their financial performance for the year.
Royal Dutch Shell reported their first quarter 2008 results. Key highlights included:
- CCS earnings increased 12% to $7.8 billion compared to the same quarter last year driven by higher oil and gas prices.
- Basic CCS earnings per share grew 15% year-on-year.
- A dividend of $0.40 per share was declared, an 11% increase over the prior year.
- Oil and gas production was relatively flat compared to the first quarter of 2007.
1) This document is a Form 16 issued by HCL Technologies Ltd to Satwinder Singh, detailing salary and tax deductions for the fiscal year 2009-2010.
2) It shows a gross salary of Rs. 3,99,026, deductions of Rs. 88,048 under Section 80C, and taxable income of Rs. 2,35,970.
3) A total of Rs. 8,855 in tax was deducted from Satwinder's salary and deposited with the government. No tax is payable or refundable.
SPICE MODEL of GT10Q301 (Professional+FWDS LTspice Model) in SPICE PARKTsuyoshi Horigome
SPICE MODEL of GT10Q301 (Professional+FWDS LTspice Model) in SPICE PARK. English Version is http://www.spicepark.net. Japanese Version is http://www.spicepark.com by Bee Technologies.
This bill from Qubee provides details of internet usage and charges for Amit Sharafat's account between May 14-31, 2011. It shows the package price of BDT 850 for 512Kbps 6GB usage. Total data used was 2,802MB within the package limit. Previous charges of BDT 2,567.59 were offset by a payment of BDT 2,999.50, resulting in a credit of BDT 431.91. The current month's charges of BDT 850 are discounted by BDT 1,559.50, with a VAT of BDT 127.50, for a payable amount of BDT 1,013.91 (credit).
DTE Energy Company reported financial results for the first quarter of 1999. Operating revenues increased 8.4% to $1.024 billion compared to $945 million in the first quarter of 1998. However, operating expenses rose 13.6% to $809 million, resulting in a 7.7% decline in operating income to $215 million. Net income increased 10.6% to $115 million due to a lower effective tax rate, though earnings per share grew at a slower rate of 9.7% to $0.79 per share. Total sales volumes increased across all customer classes for the first quarter of 1999 compared to the prior year.
The document is DTE Energy Company's condensed consolidated statement of income and balance sheet for the first quarter of 1999 compared to the same period in 1998. Some key points:
- Operating revenues increased 8.4% to $1,024 million, while operating expenses rose 13.6% to $809 million, resulting in a 7.7% decrease in operating income to $215 million.
- Net income increased 10.6% to $115 million due to higher regulated revenues and lower expenses, as well as improved performance from non-regulated subsidiaries.
- As of March 31, 1999, current assets decreased primarily due to lower cash and cash equivalents, while accounts receivable and inventories
Gactel Turnkey Projects Limited is an Indian company that provides cooling towers and systems. It has experienced growth but has faced financial losses in recent years due to high expenses outpacing revenue. Expenses as a percentage of revenue have exceeded 100% for the past three years. Borrowing increased dramatically in 2010, contributing to higher interest payments that have exceeded operating profits. The company has high debt relative to assets, indicating weak solvency. To improve its financial position, the company needs to control expenses, borrowing, and interest costs in order to generate positive cash flow.
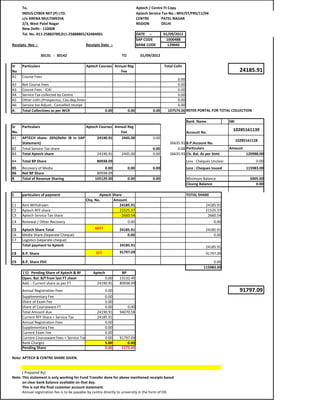
1. To, Aptech / Centre Ft Copy
INDUS CYBER NET (P) LTD. Aptech Service Tax No.:‐MIV/ST/FRS/11/04
c/o ARENA MULTIMEDIA CENTRE PATEL NAGAR
2/3, West Patel Nagar REGION DELHI
New Delhi ‐ 110008
Tel. No.‐011‐25883789,011‐25888801/42484001 DATE :‐ 01/09/2012
SAP CODE 1000488
Receipts Nos :‐ Receipts Date :‐ BANK CODE 129040
30131 ‐ 30142 TO 01/09/2012
Sr Particulars Aptech Courses Annual Reg Total Colln
No Fee 24185.91
A1 Course Fees
0.00
A2 Net Course Fees 0.00
A3 Course Fees ‐ ICAI 0.00
A4 Service Tax collected by Centre 0.00
A5 Other colln.(Prospectus, Cau.dep,fines) 0.00
A6 Service tax Adjust.. Cancelled receipt 0.00
A Total Collections as per WCR 0.00 0.00 0.00 107574.00 REFER PORTAL FOR TOTAL COLLECTION
Bank Name SBI
Sr Particulars Aptech Courses Annual Reg
No. Fee
10285161139
Account No.
B1 APTECH share‐ 20%(Refer IB in SAP 24190.91 2445.00 0.00
10285161128
Statement) 26635.91 B.P.Account No.
B2 Total Service Tax share 0.00 0.00 Particulars Amount
B3 Total Aptech share 24190.91 2445.00 0.00 26635.91 Cls. Bal. As per Stmt 120988.00
B4 Total BP Share 80938.09 Less : Cheques Unclear 0.00
B5 Recovery of Media 0.00 0.00 0.00 Less : Cheques Issued 115983.00
B6 Net BP Share 80938.09
B Total of Revenue Sharing 105129.00 0.00 0.00 Minimum Balance 5005.00
Closing Balance 0.00
C particulars of payment
ti l f t Aptech Share
A t h Sh TOTAL SHARE
TOTAL SHARE
Chq. No. Amount
C1 Amt Withdrawn 24185.91 24185.91
C2 Aptech RFF share 21525.37 21525.37
C3 Aptech Service Tax share 2660.54 2660.54
C4 Renewal / Other Recovery 0.00 0.00
C5 Aptech Share Total NEFT 24185.91 24185.91
C6 Media Share (Separate Cheque) 0.00 0.00
C7 Logistics (separate cheque)
Total payment to Aptech 24185.91 24185.91
C8 B.P. Share EFT 91797.09 91797.09
C9 B.P. Share PDC 0.00
115983.00
( E) Pending Share of Aptech & BP Aptech BP
Open. Bal. B/f from last FT sheet 0.00 13132.49
Add :‐ Current share as per FT 24190.91 80938.09
Annual Registration Fees 0.00 91797.09
Supplementary Fee 0.00
Share of Exam Fee 0.00
Share of Courseware FT 0.00 0.00
Total Amount due 24190.91 94070.58
Current RFF Share + Service Tax 24185.91
Annual Registration Fees 0.00
Supplementary Fee 0.00
Current Exam Fee 0.00
Current Courseware Fees + Service Tax 0.00 91797.09
Bank Charges 5.00 0.00
Pending Share 0.00 2273.49
Note: APTECH & CENTRE SHARE GIVEN.
( Prepared By)
Note: This statement is only working for Fund Transfer done for above mentioned receipts based
on clear bank balance available on that day.
This is not the final customer account statement.
This is not the final customer account statement
Annual registration fee is to be payable by centre directly to university in the form of DD.