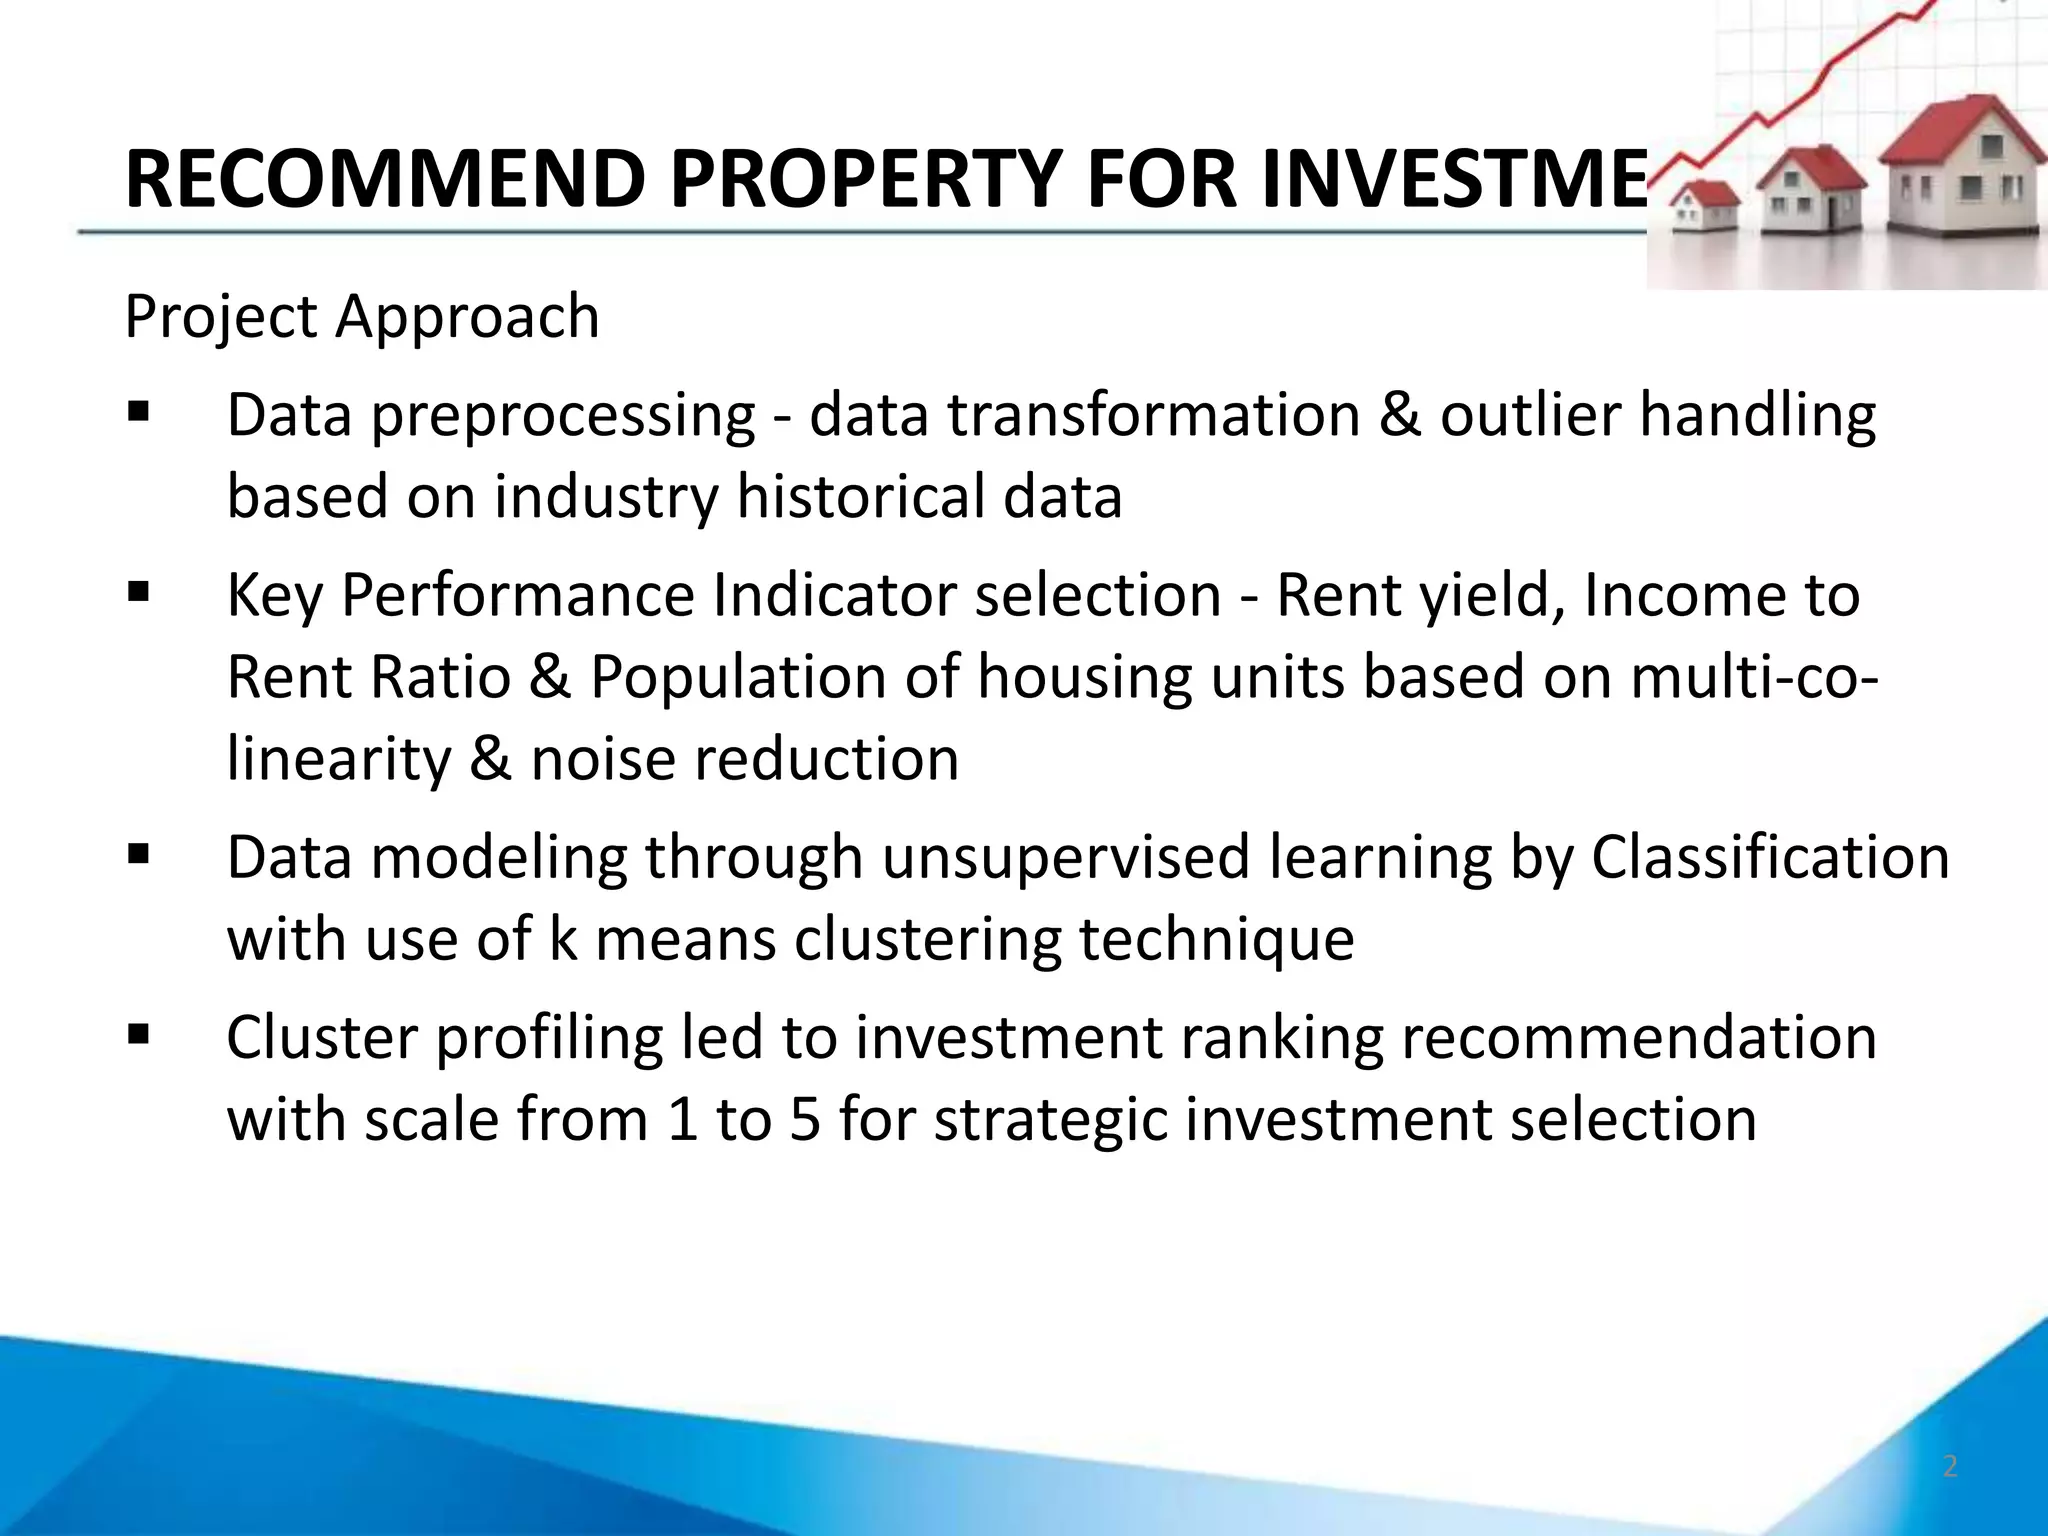
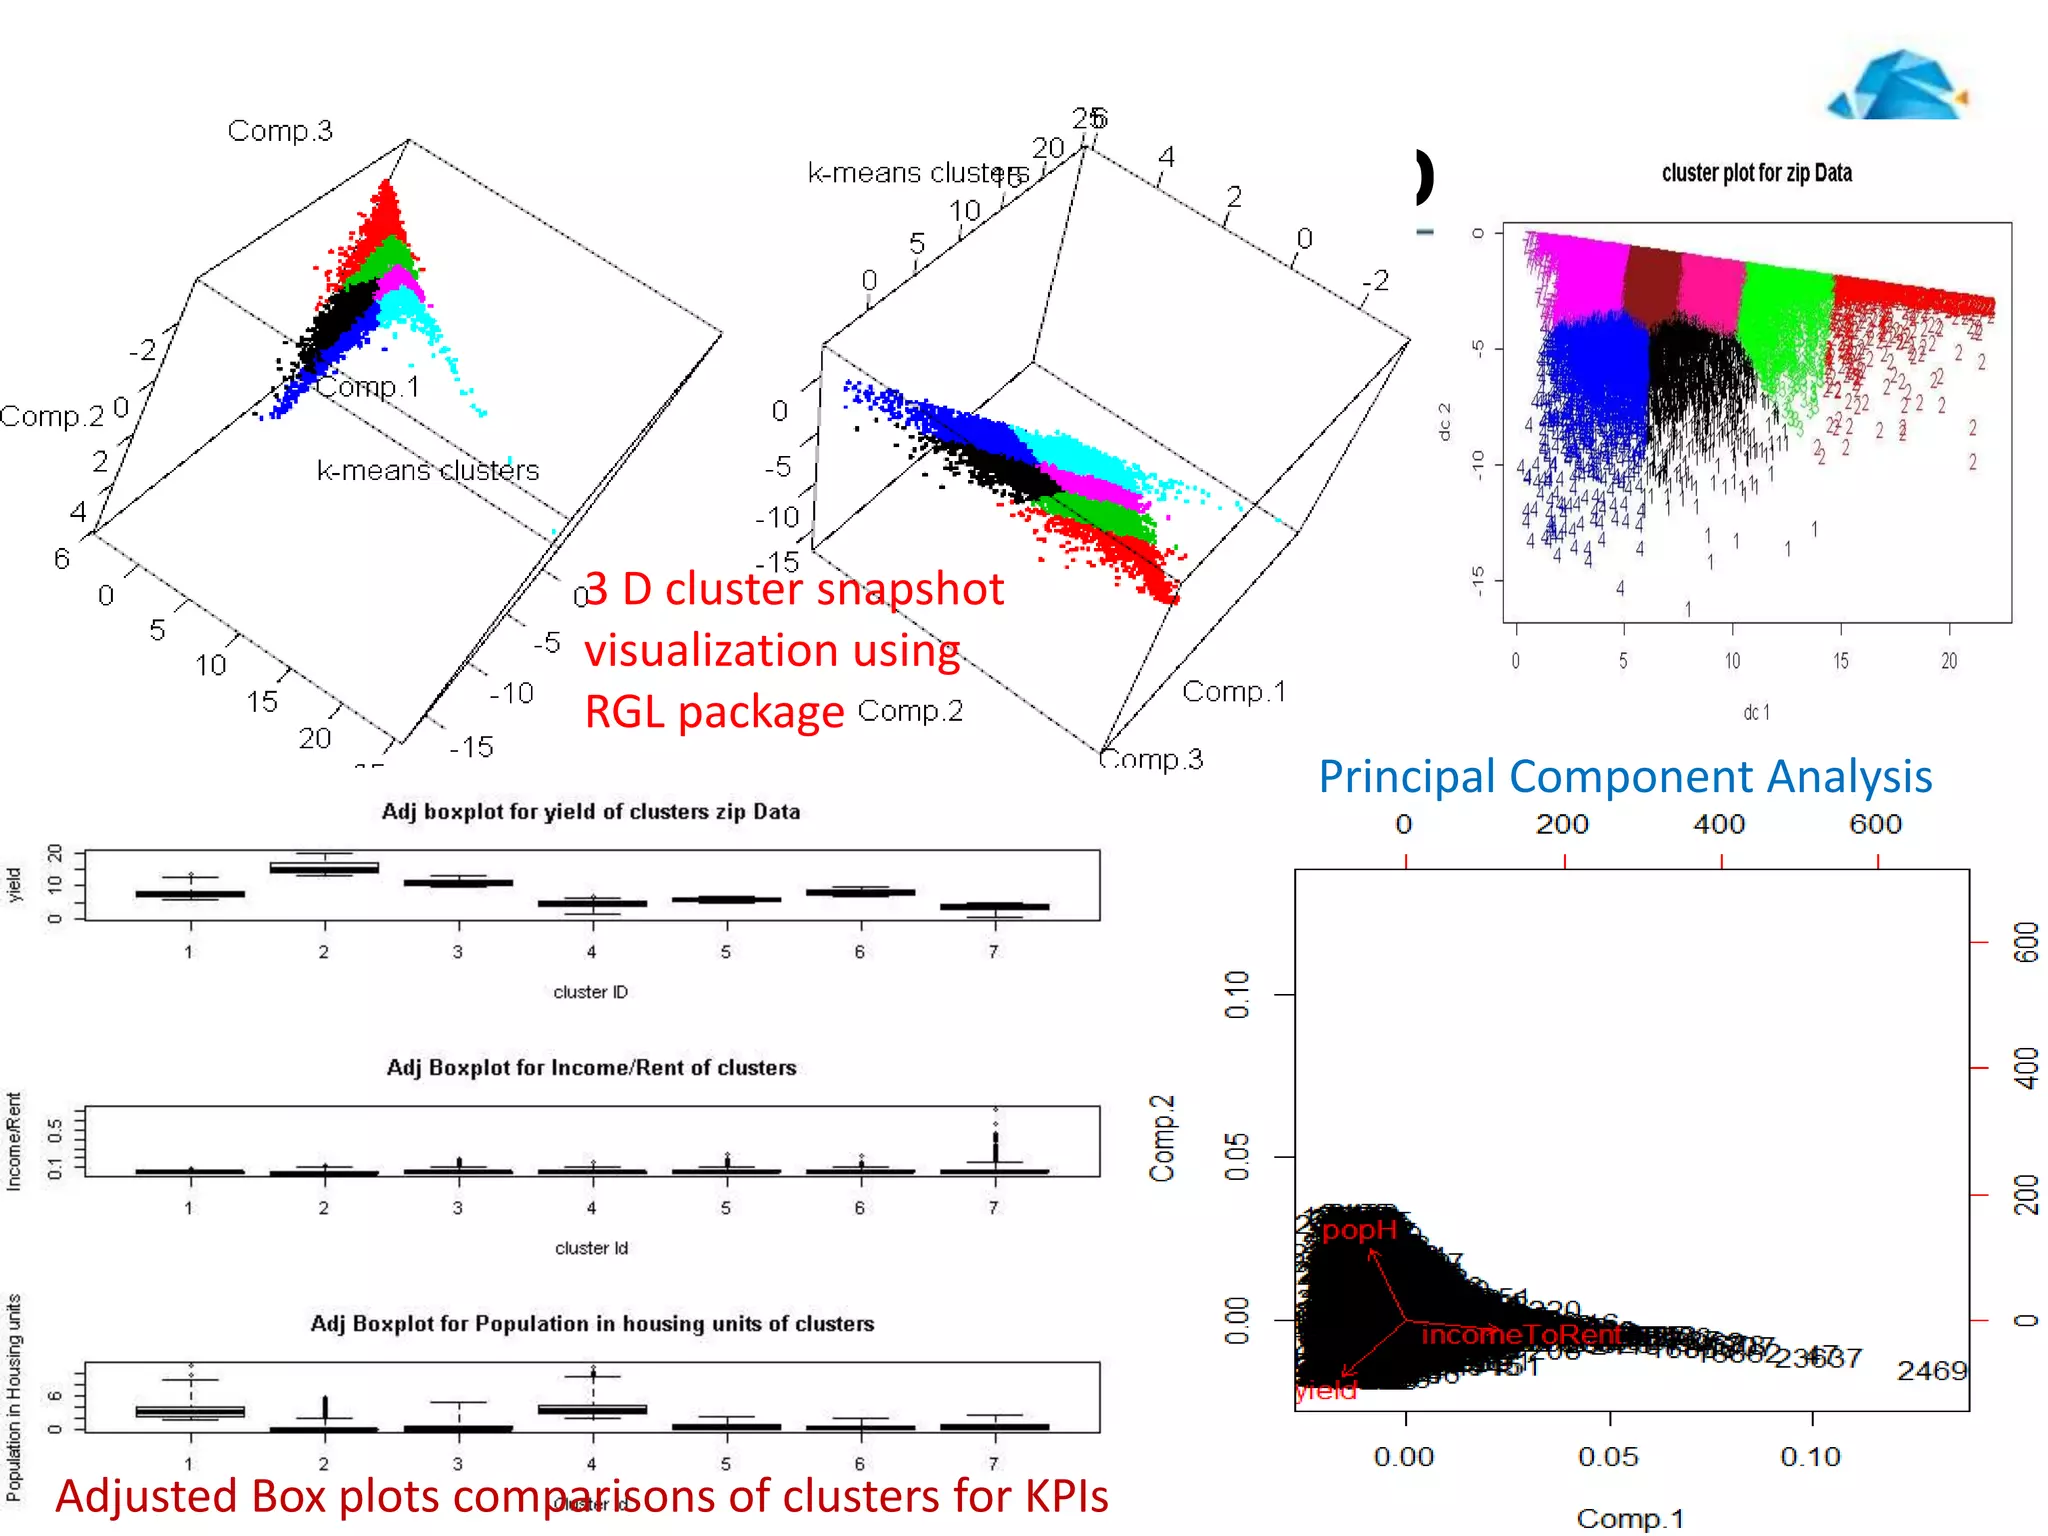
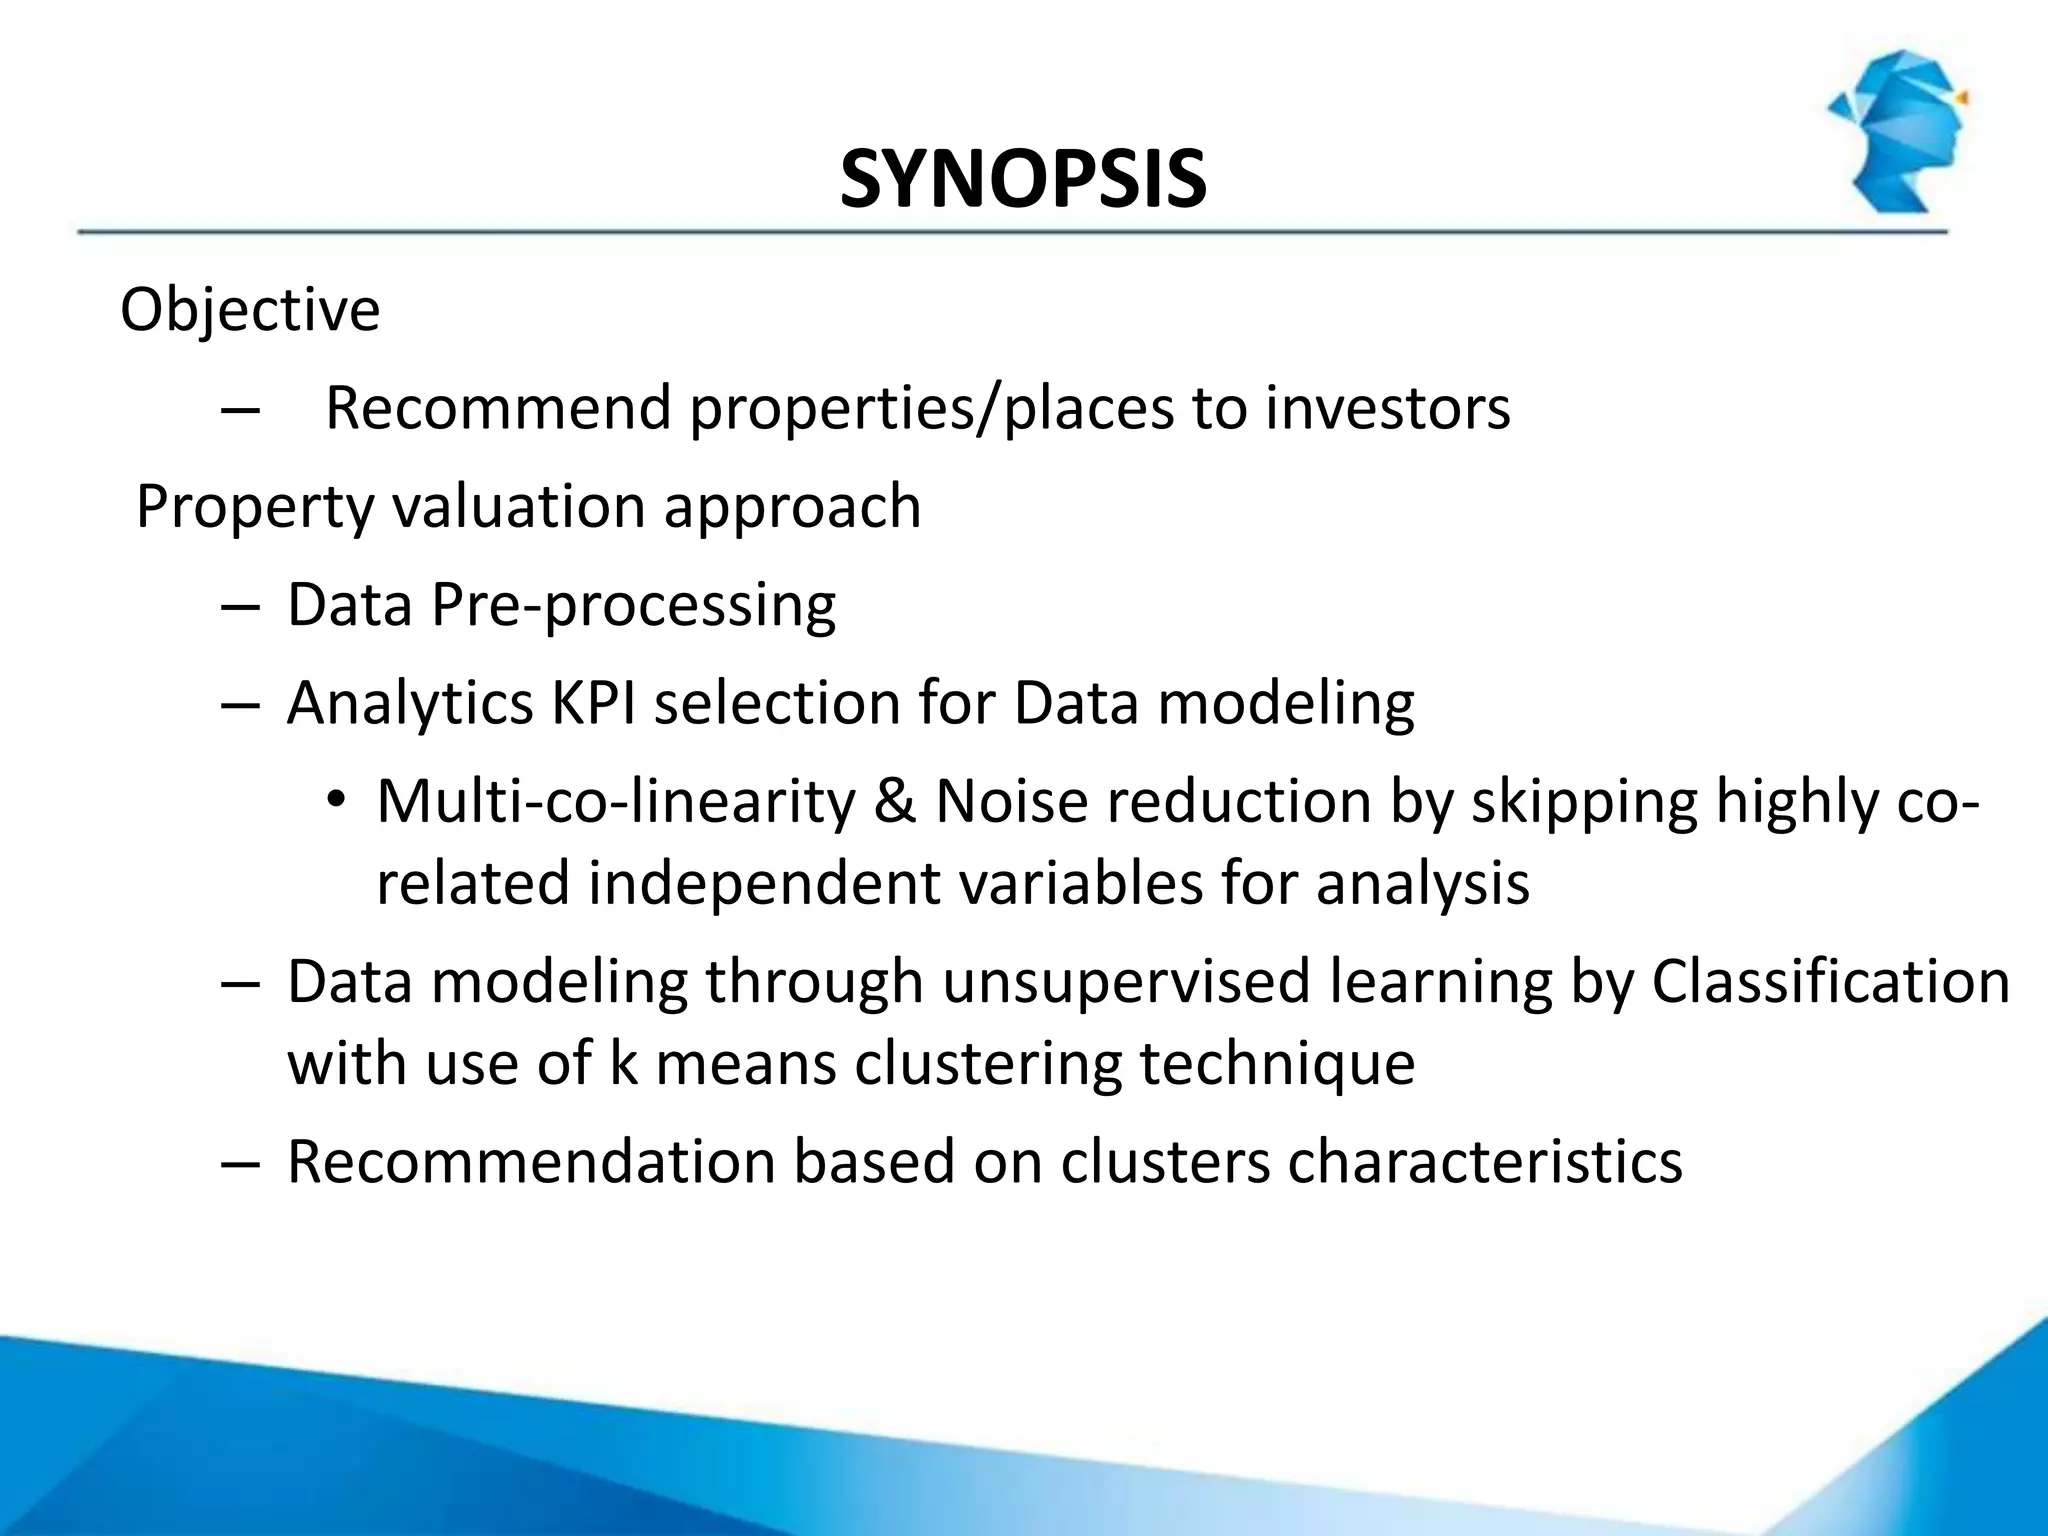
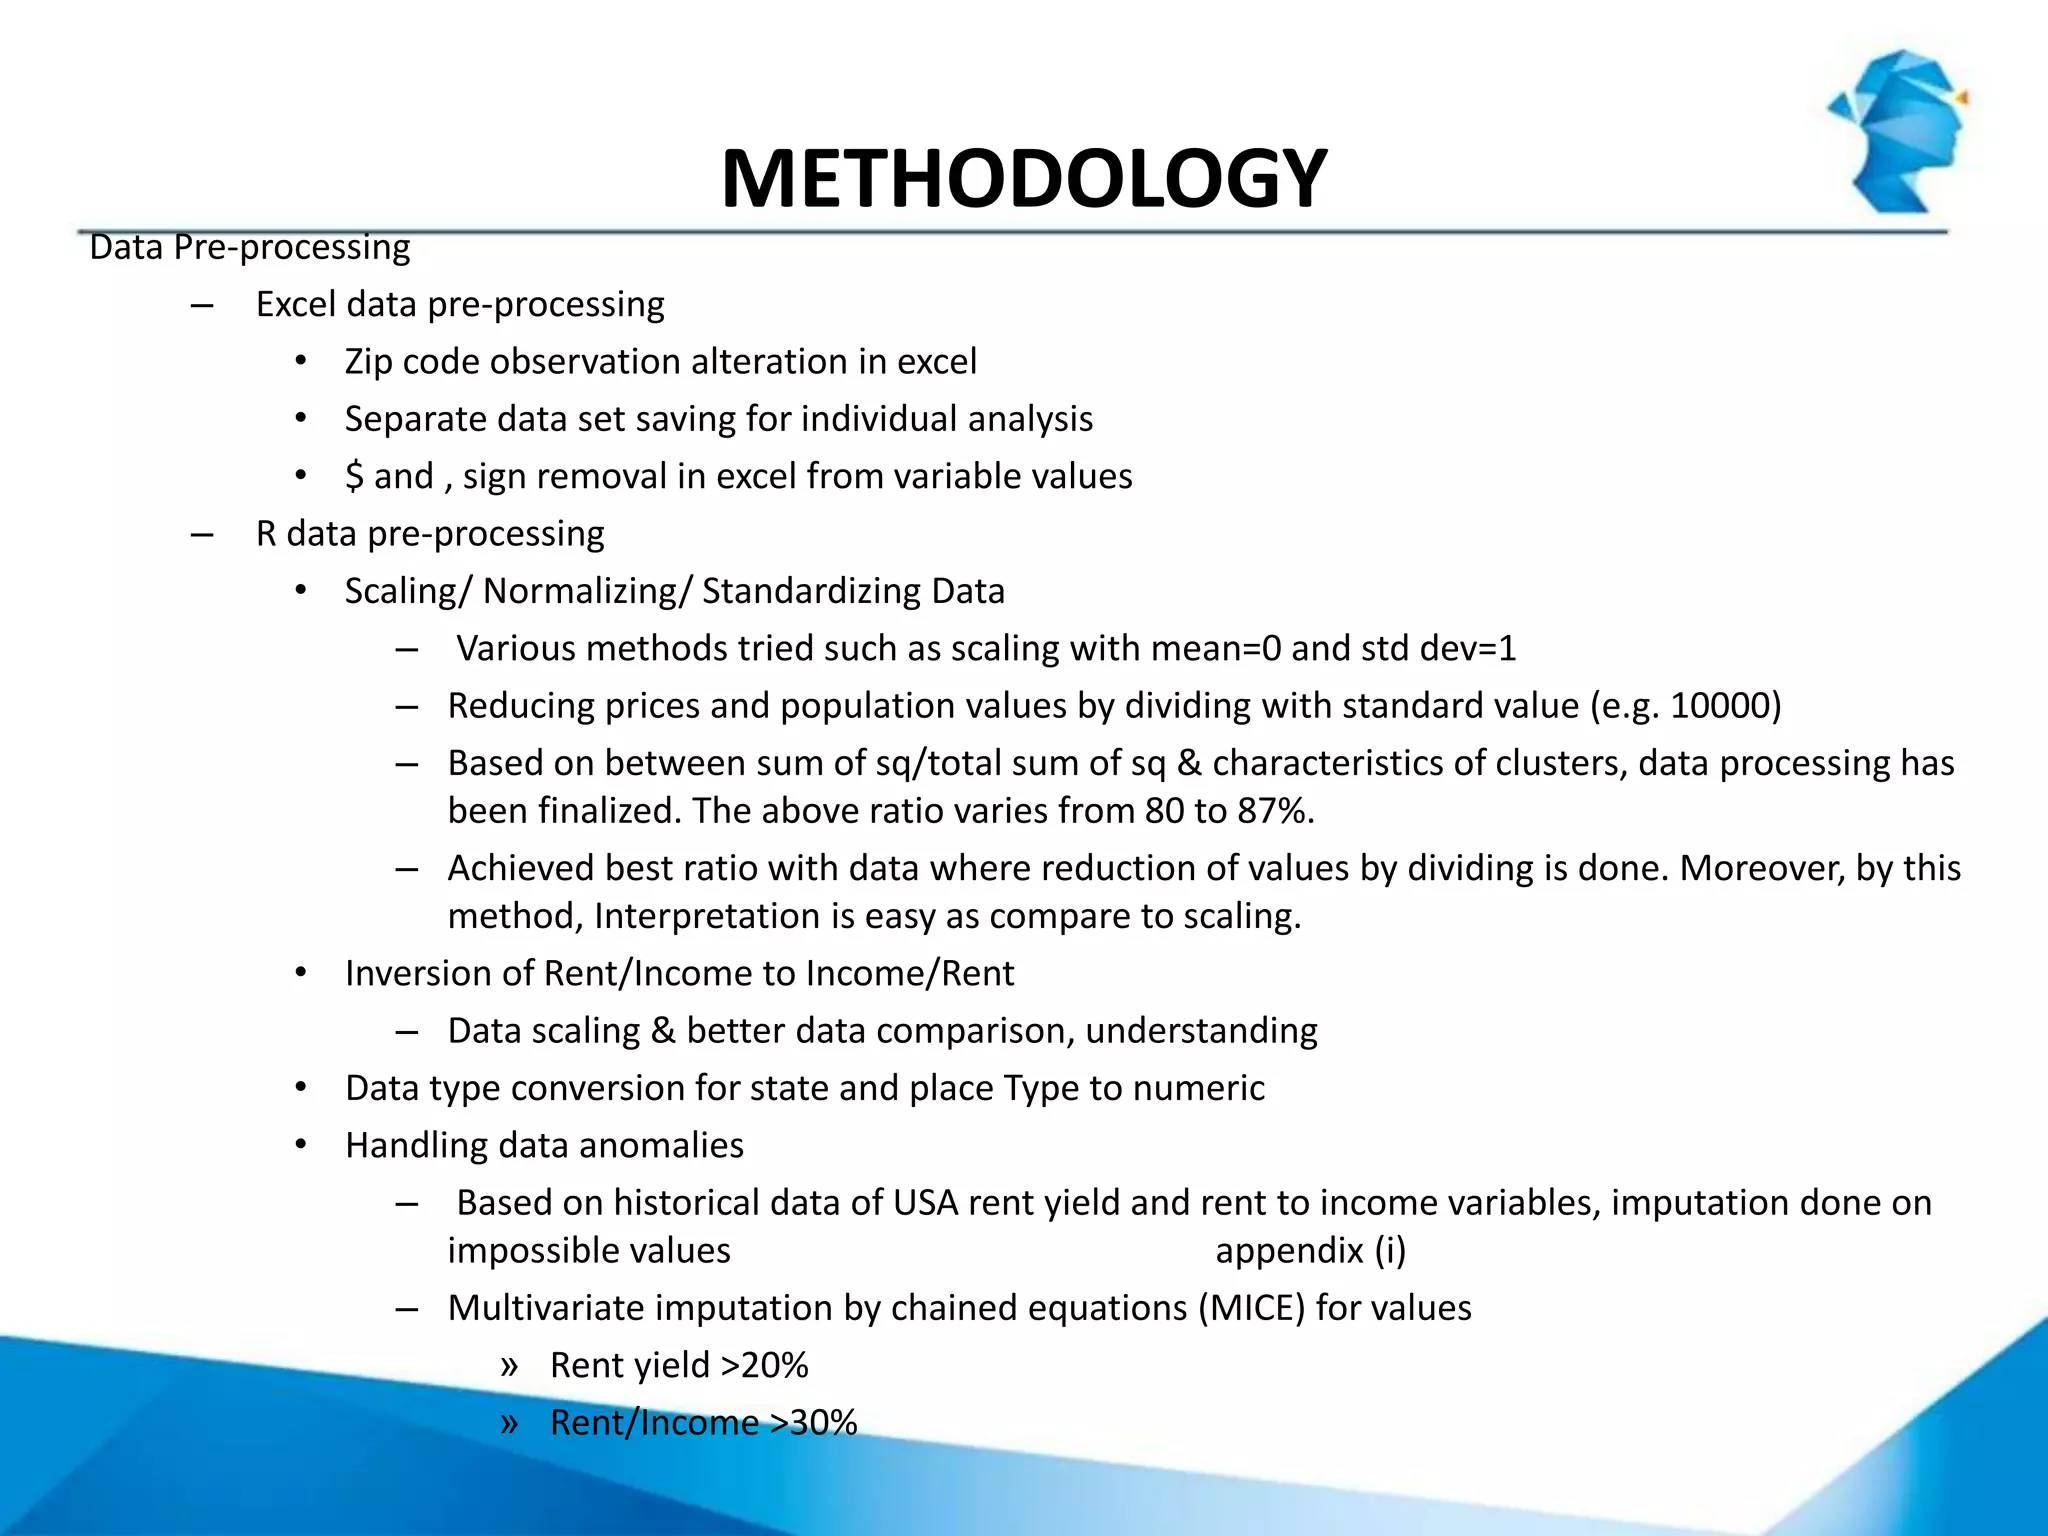
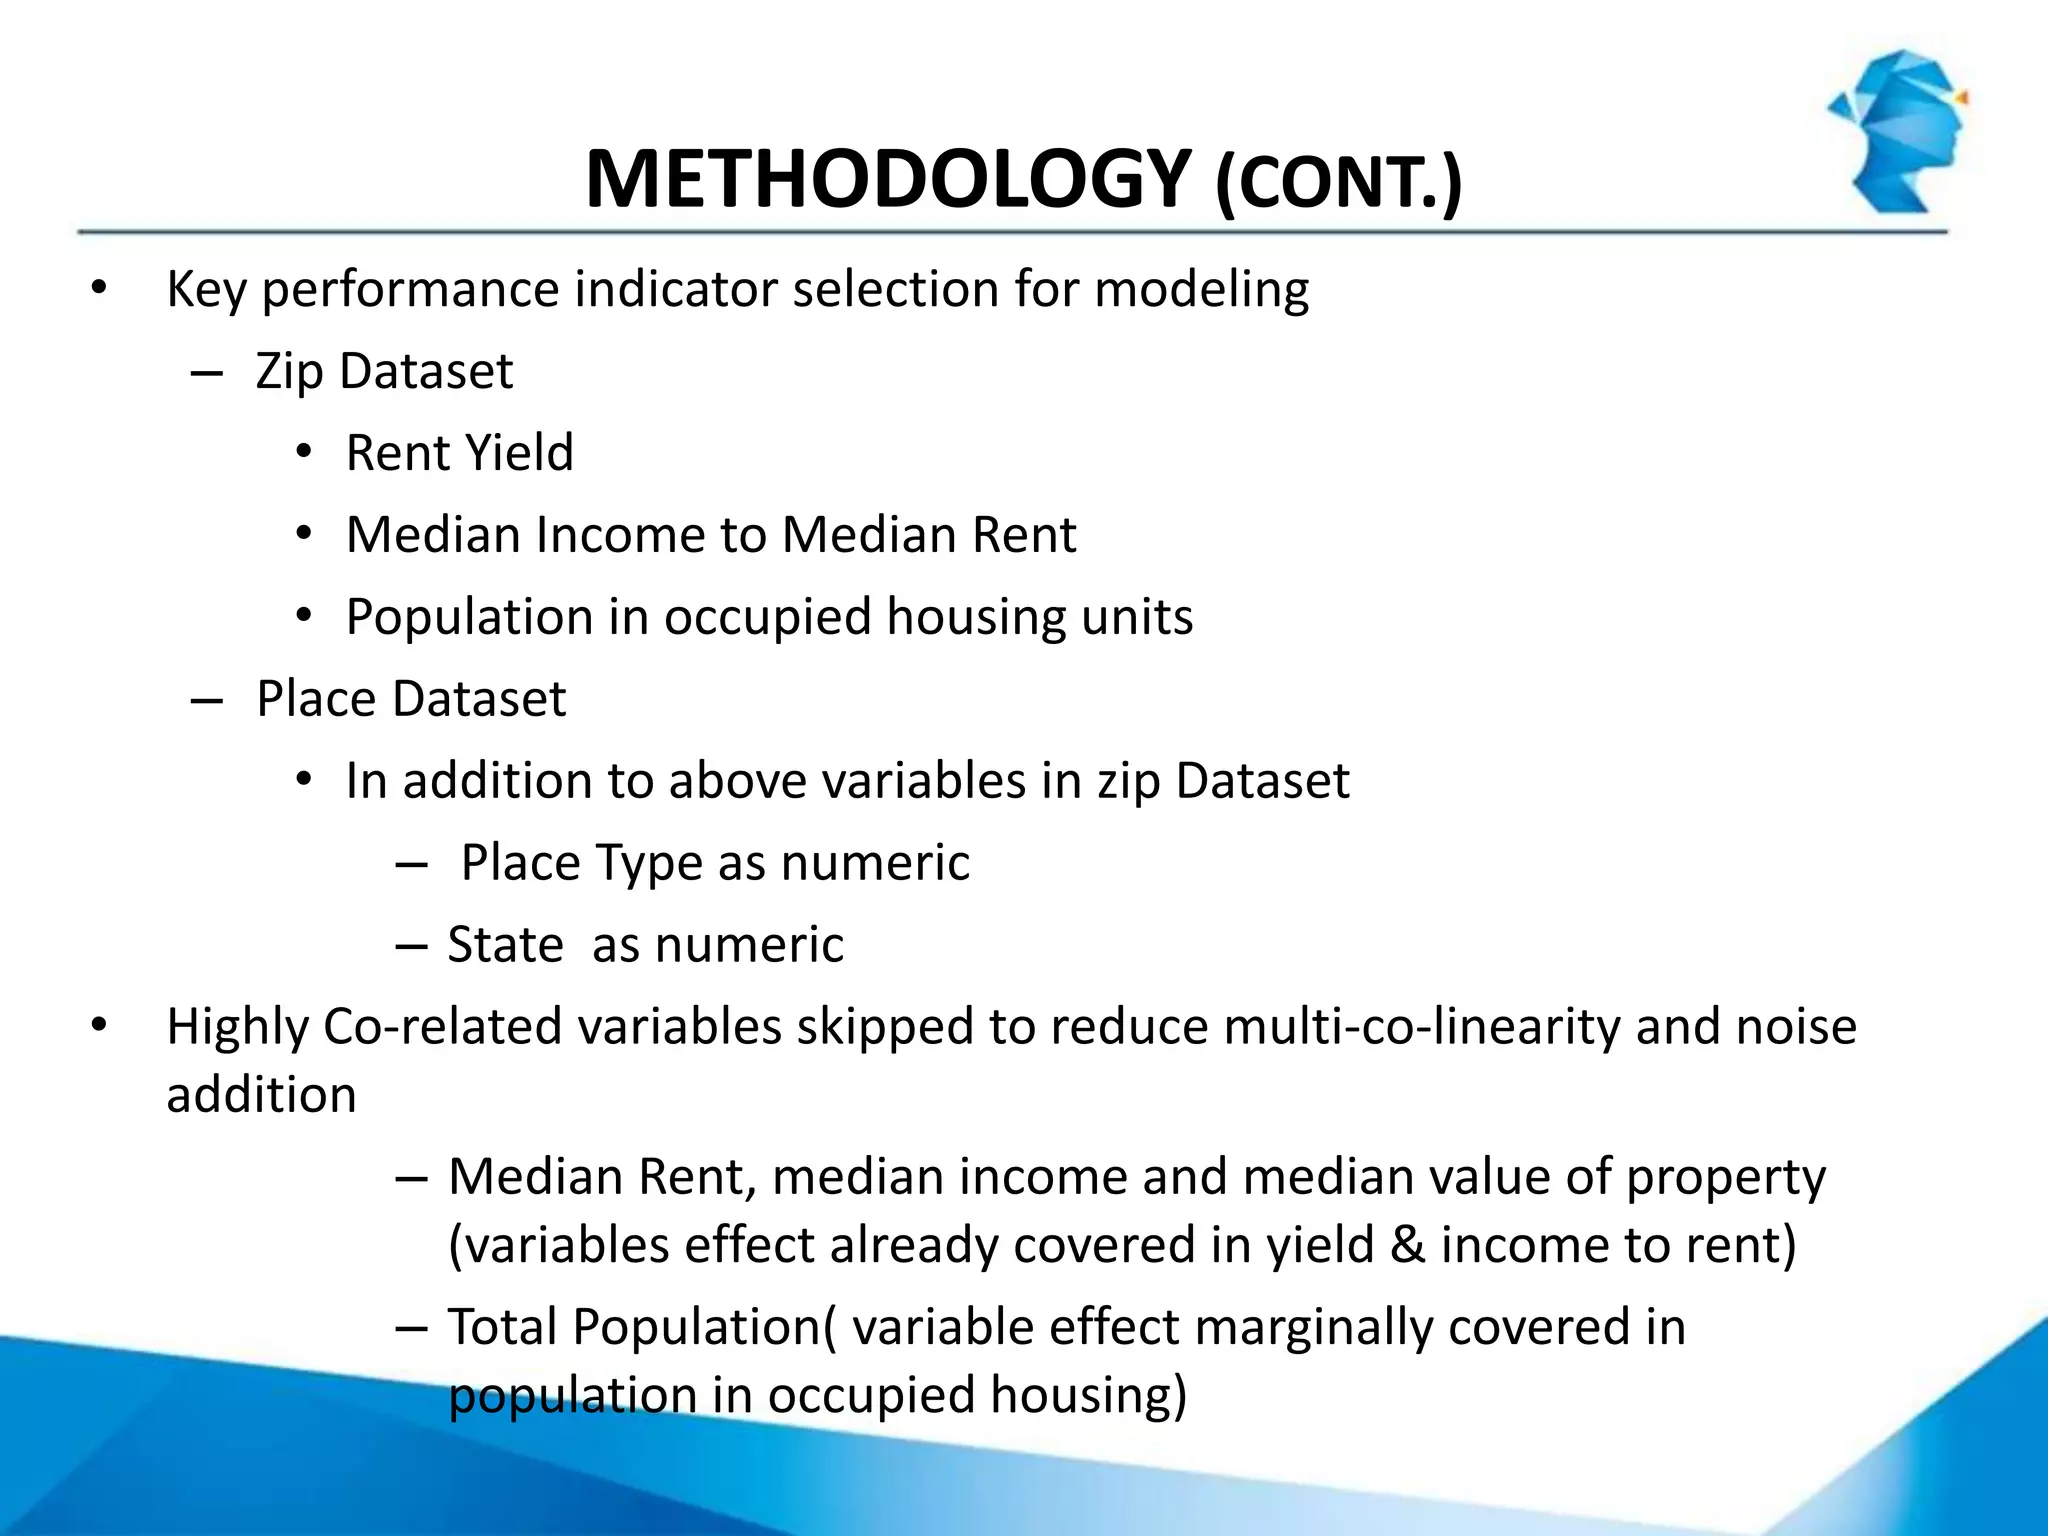
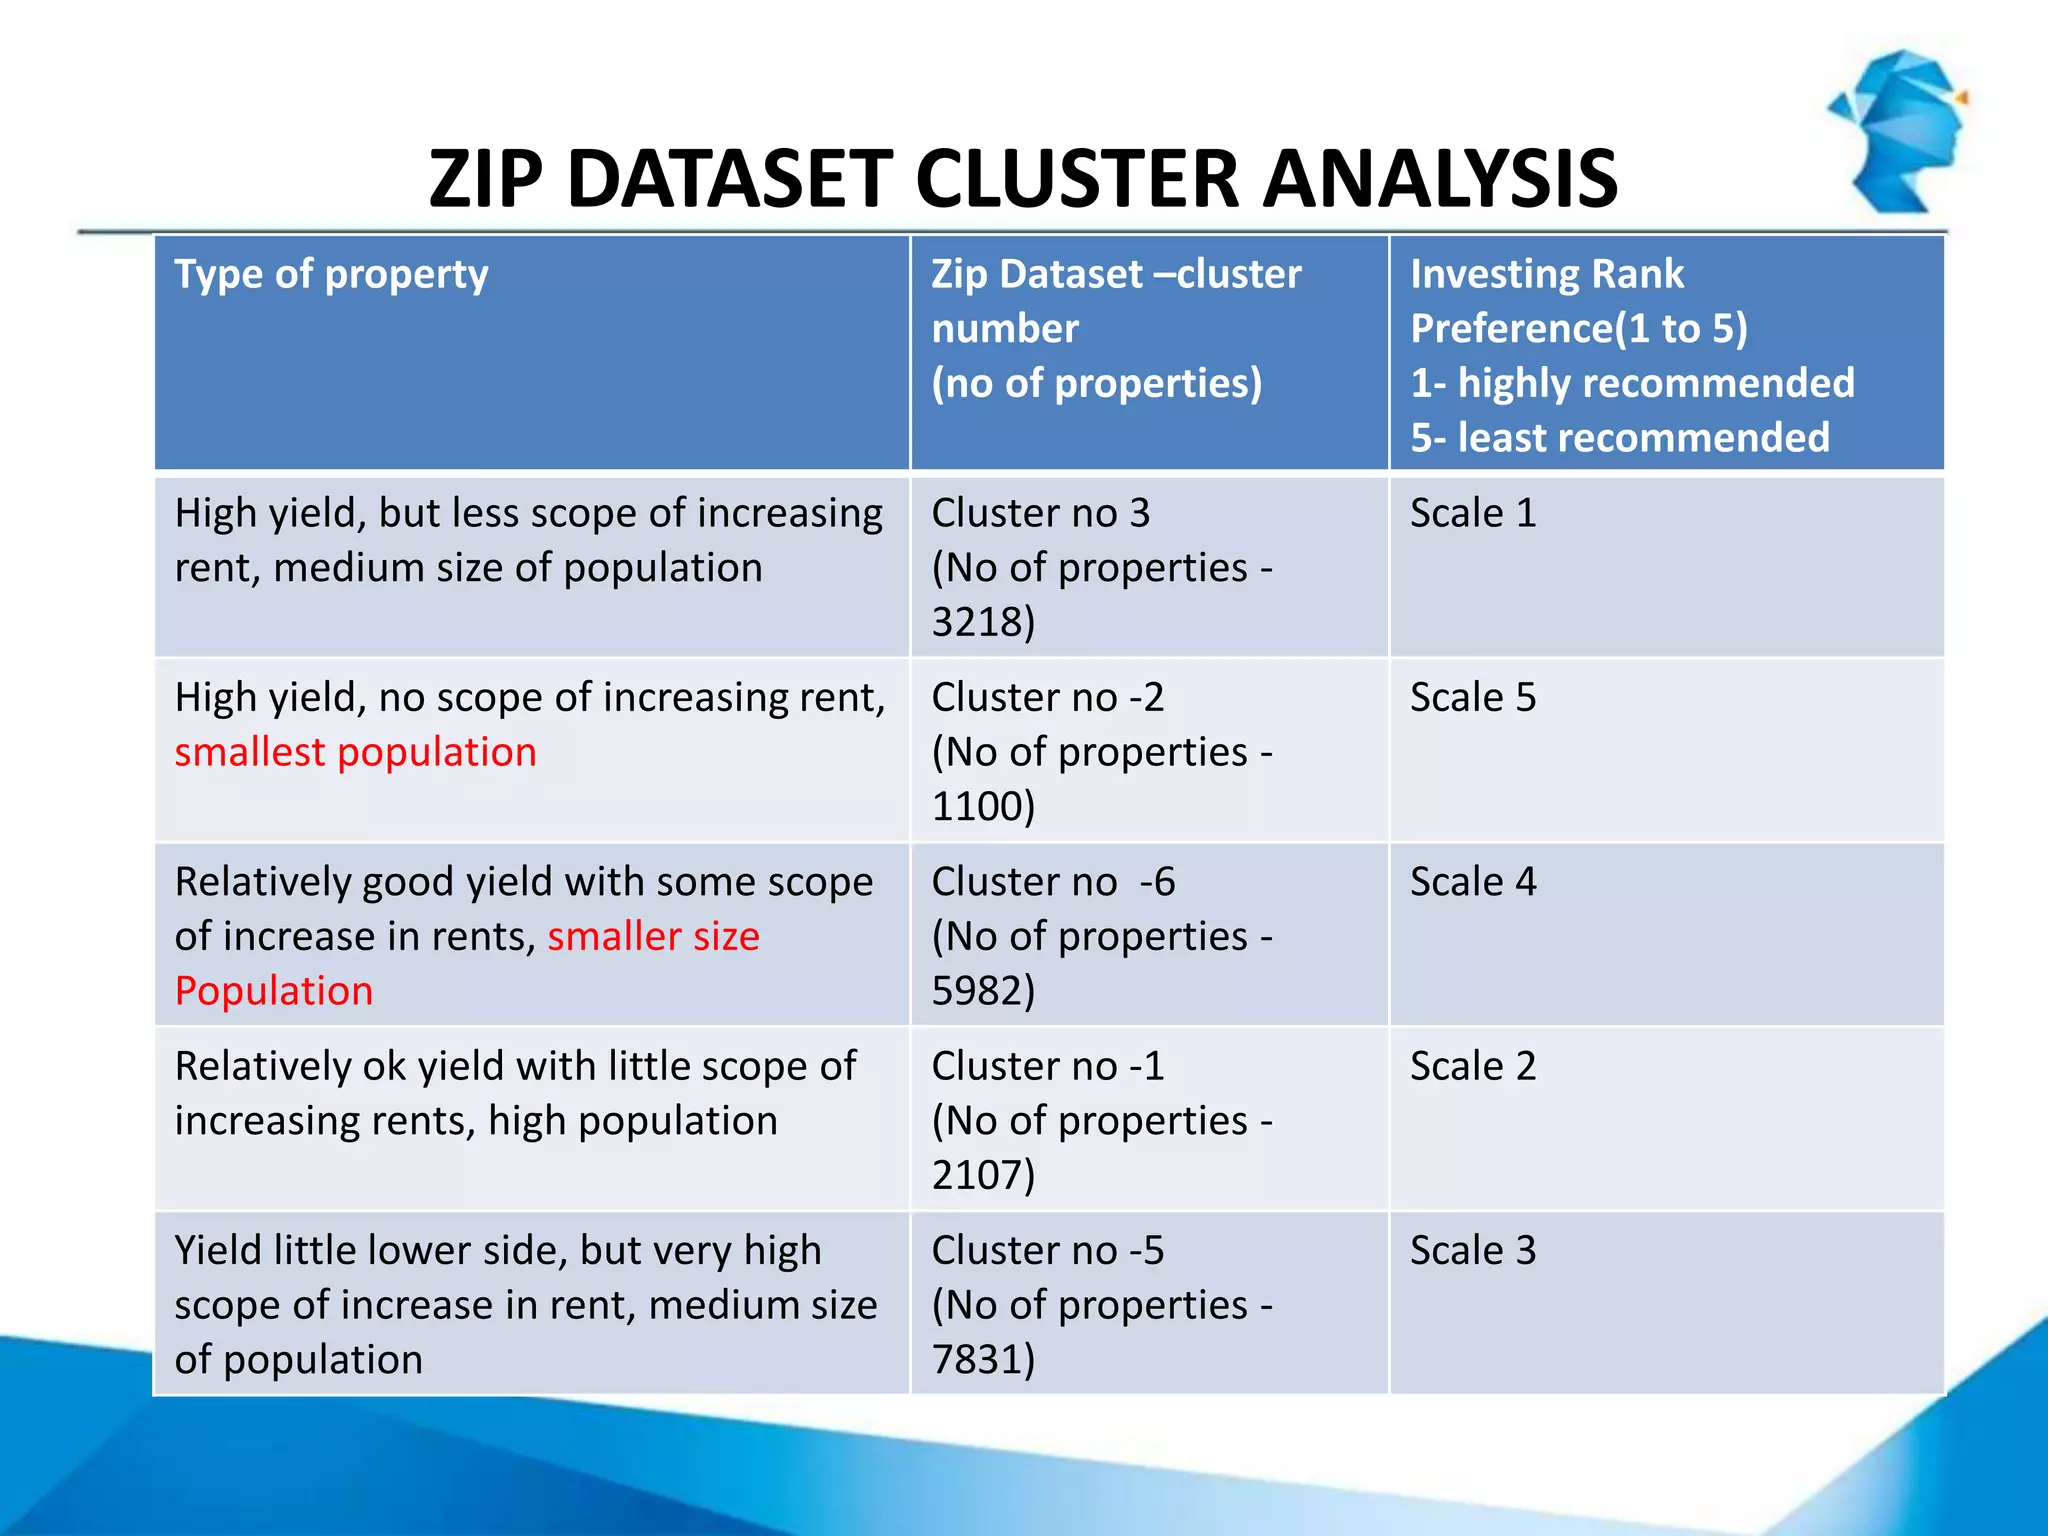
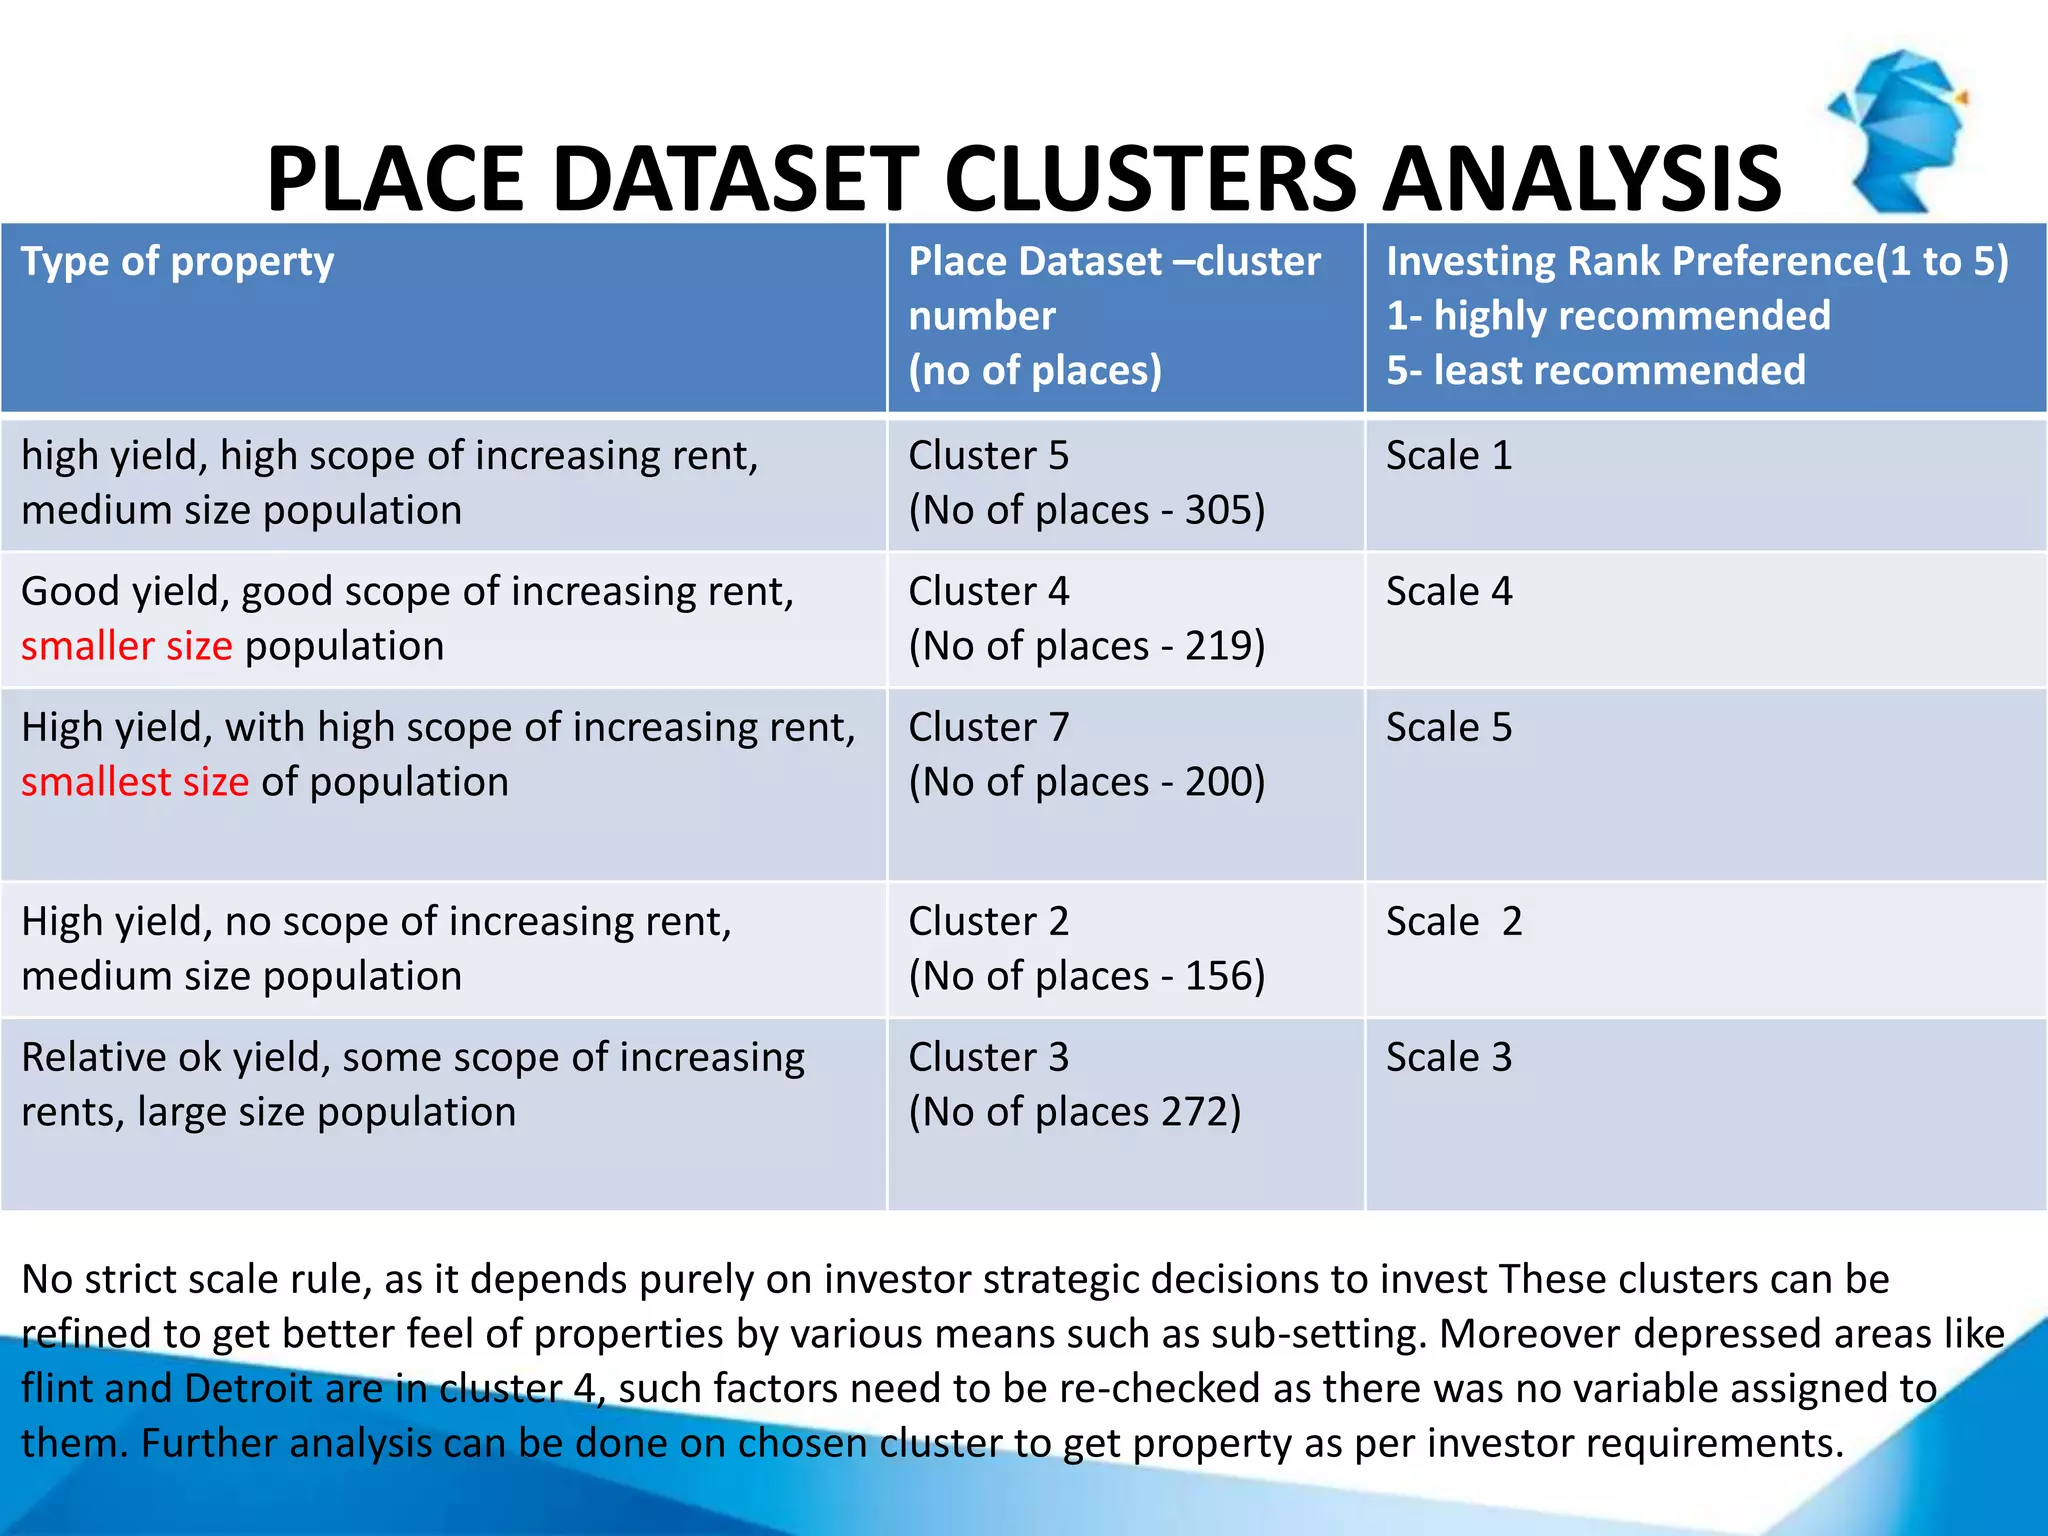
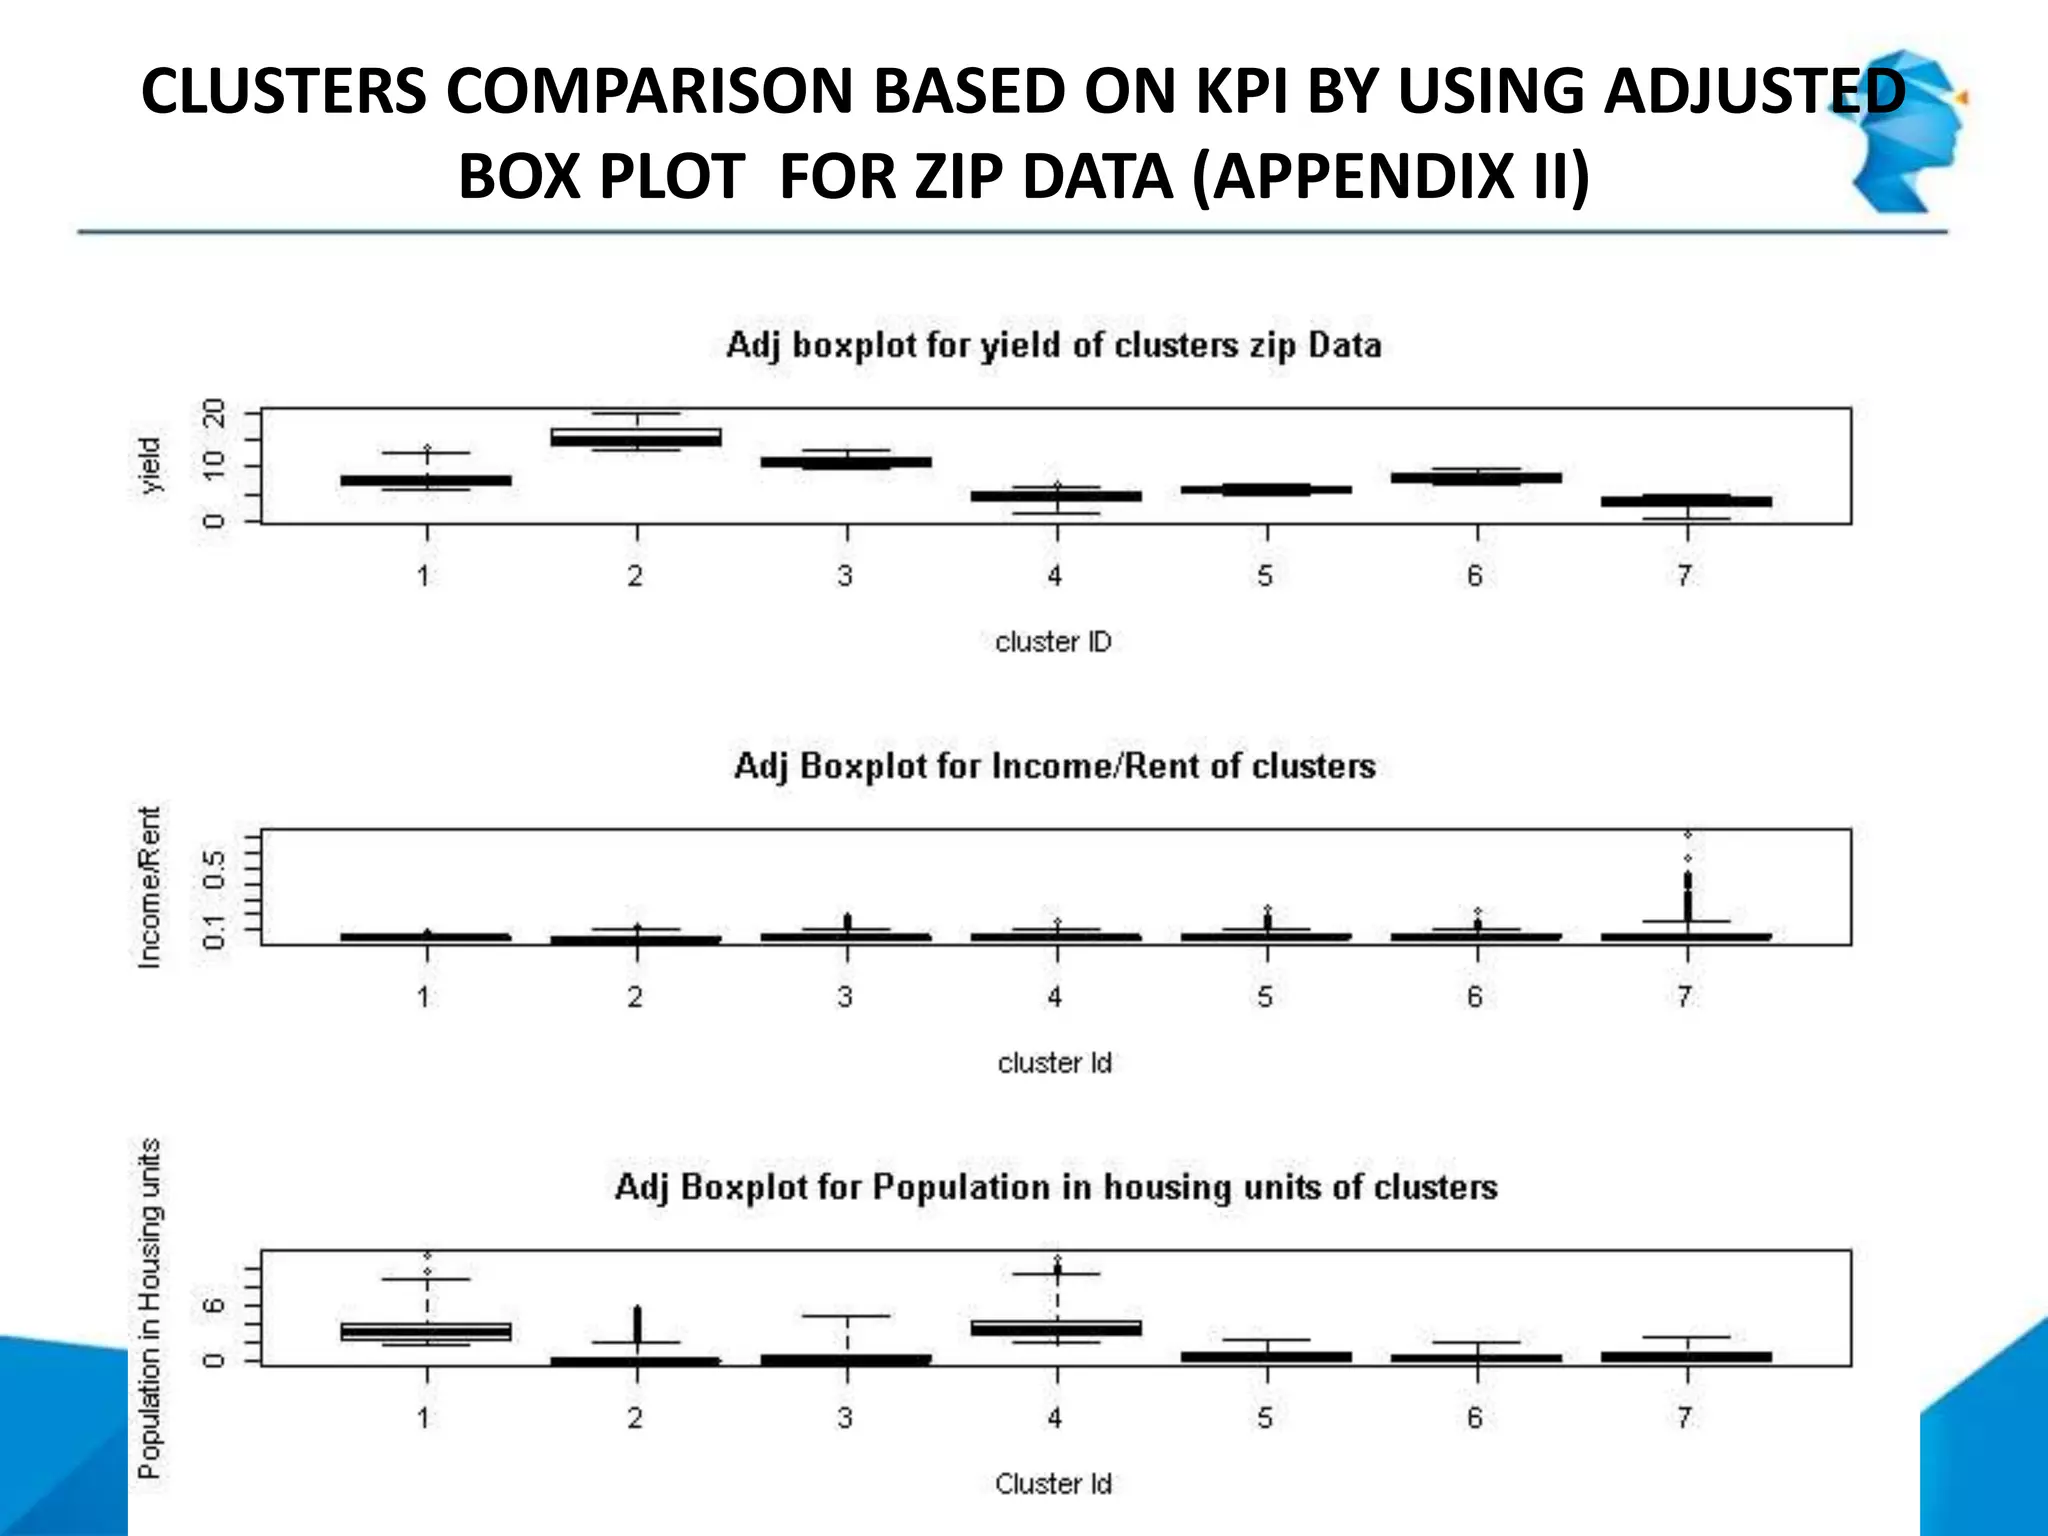
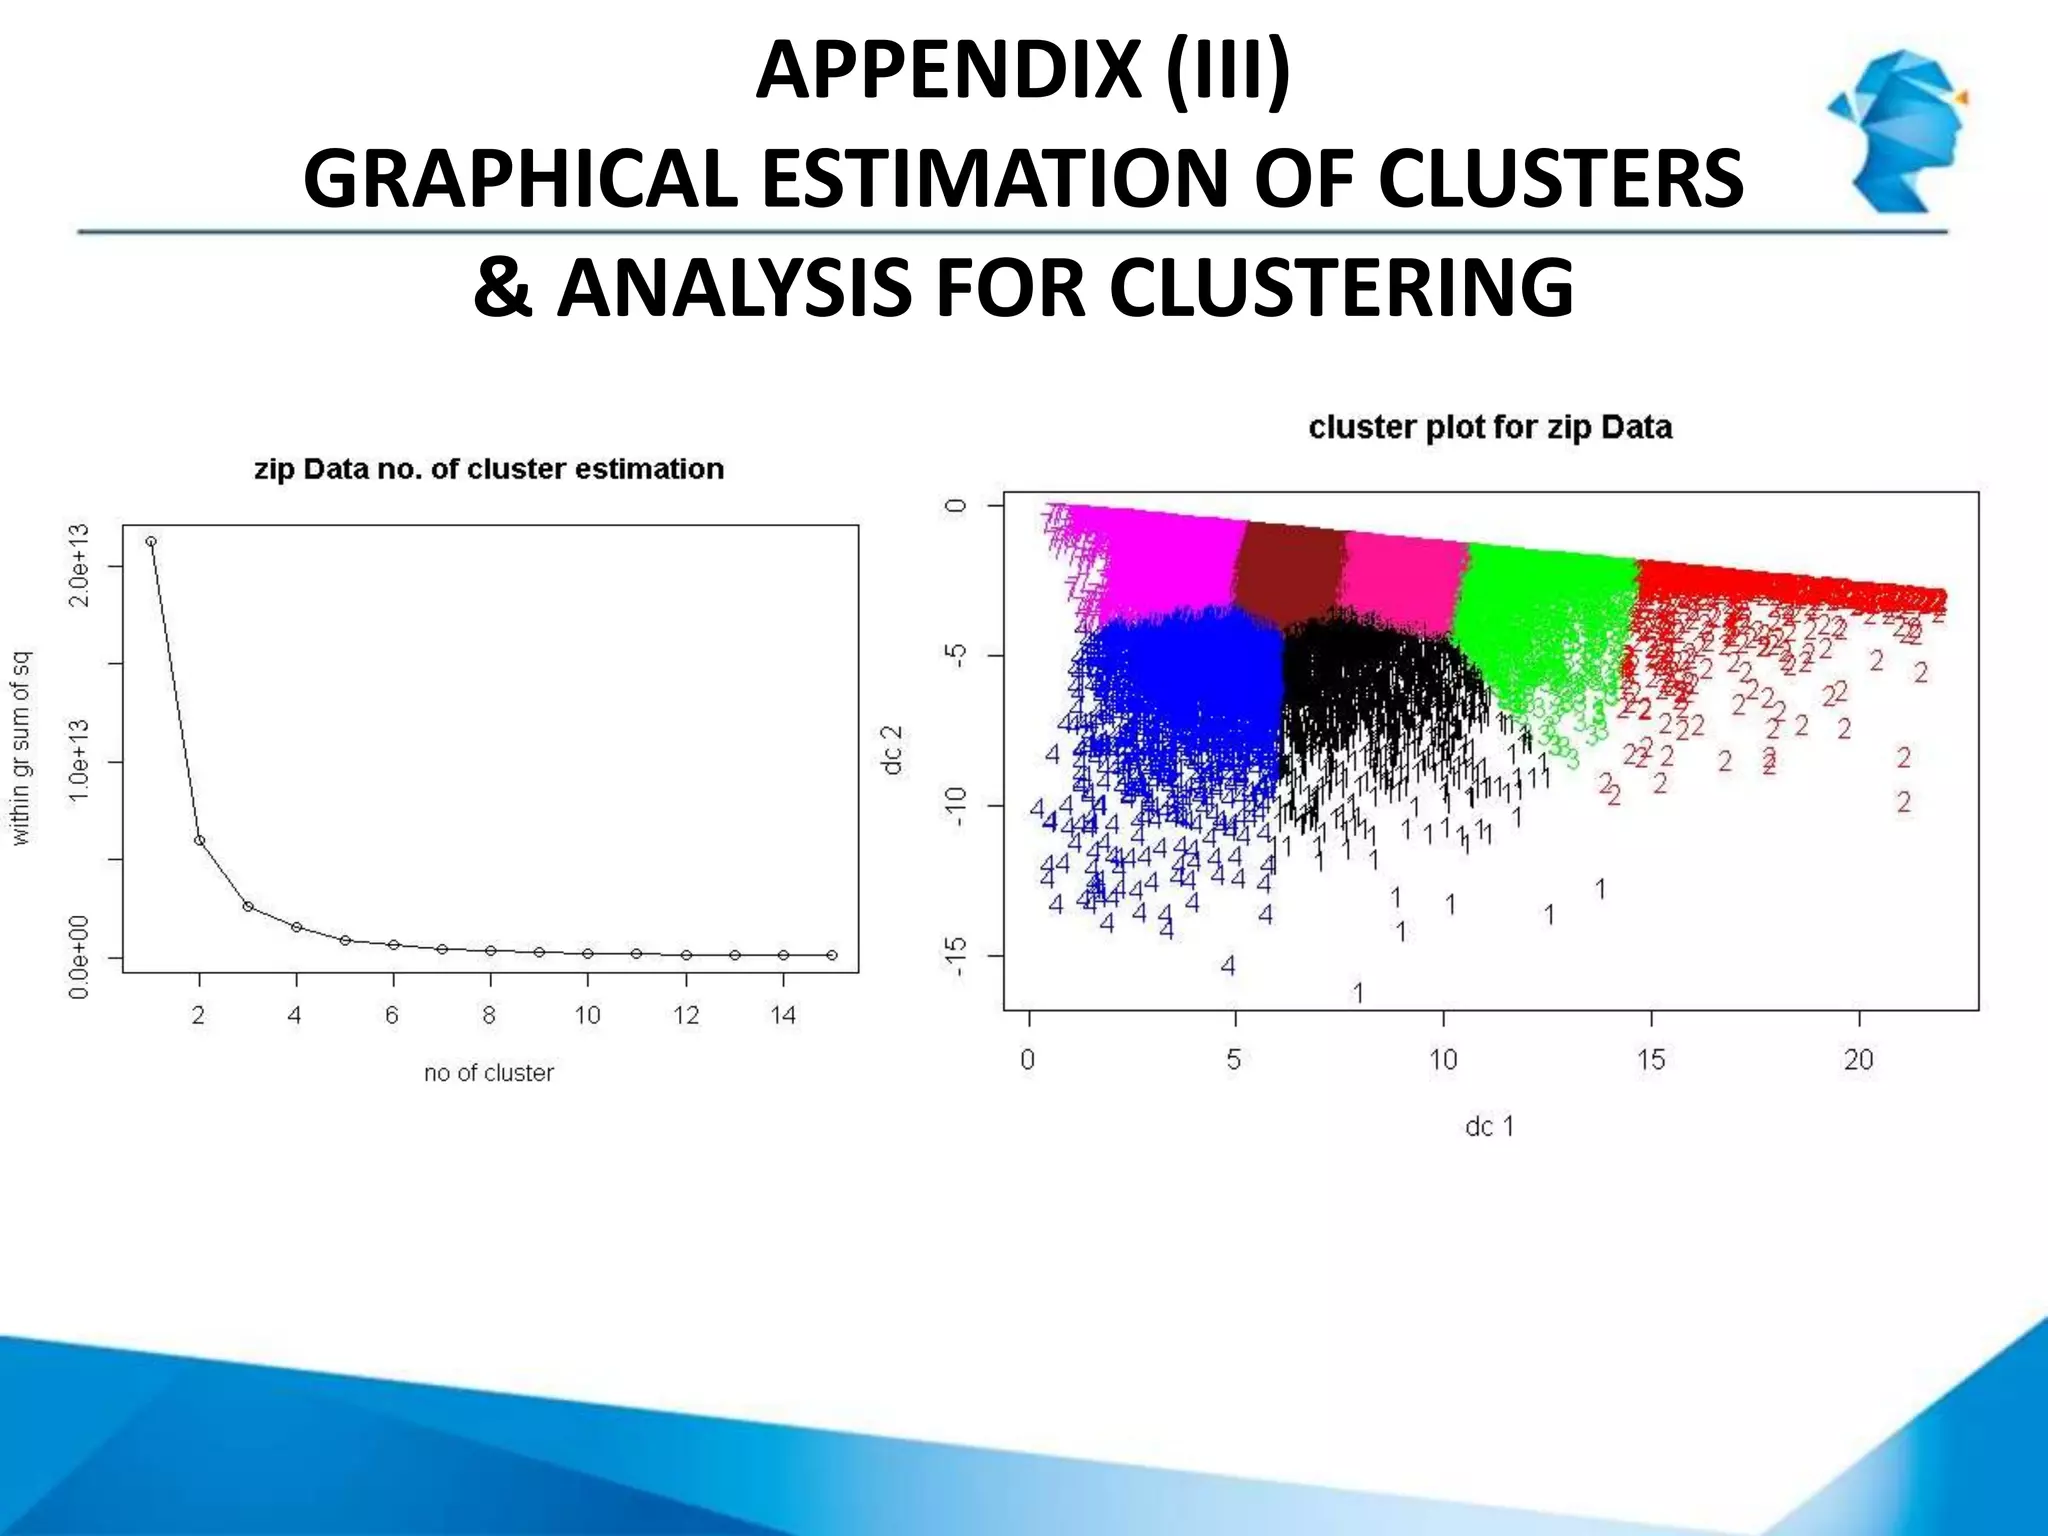
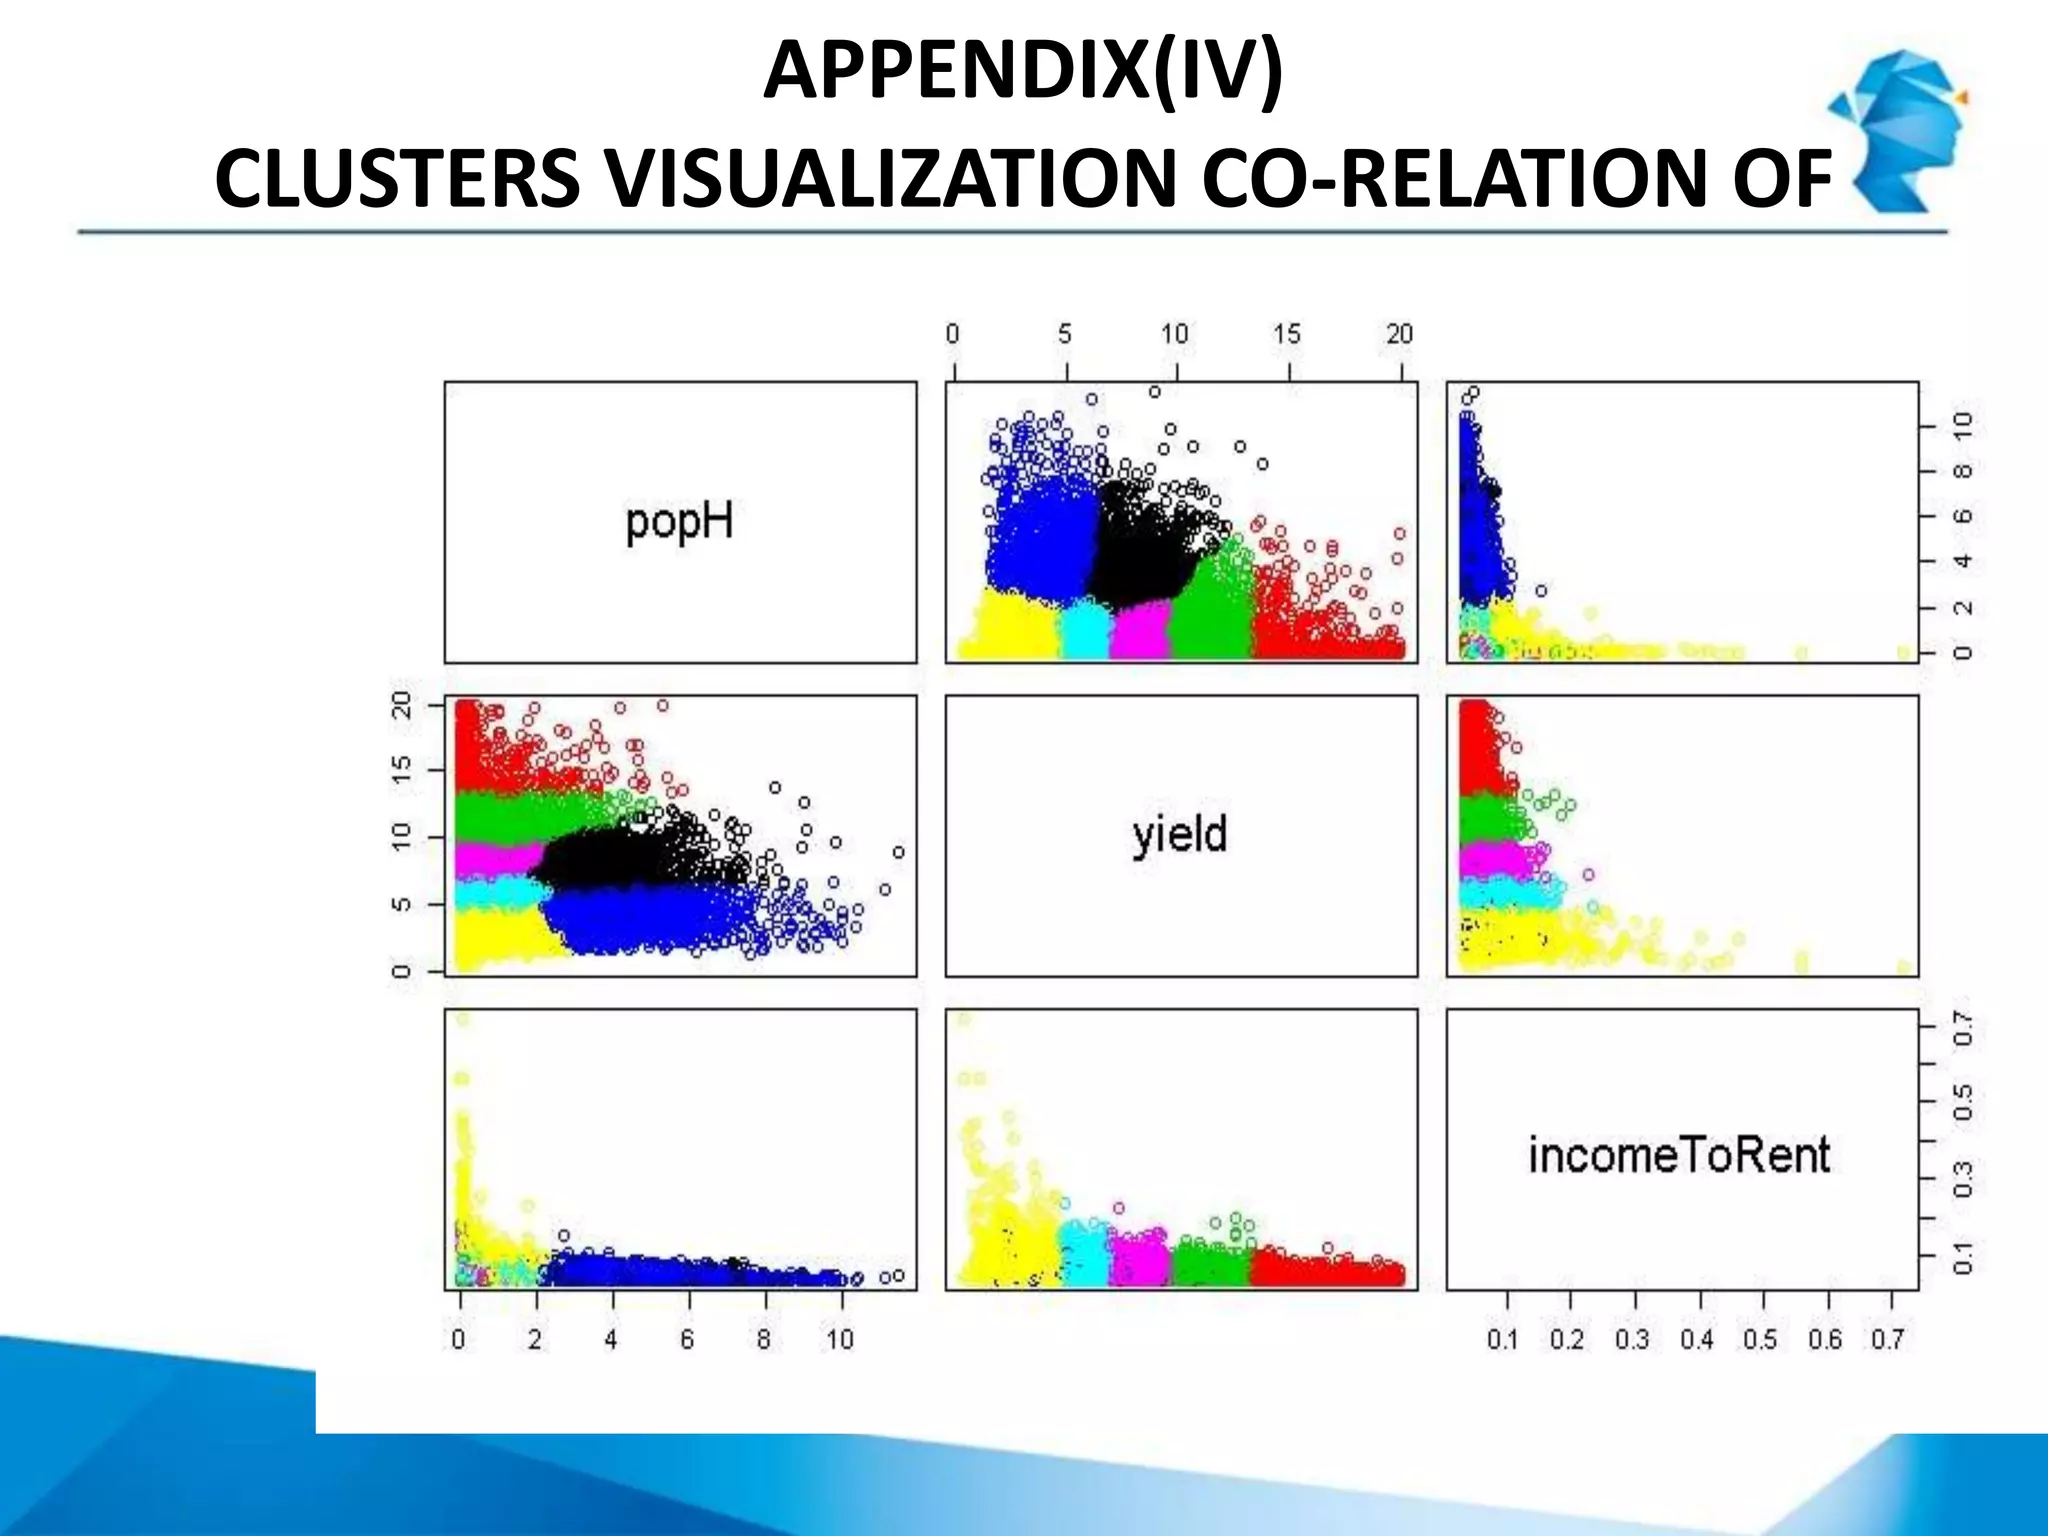
SlideShare a Scribd company logo
JIGSAW ANALYTICS CONTEST
(PROPERTY RECOMMENDATION FOR INVESTMENT)
Parindsheel S. Dhillon
RECOMMEND PROPERTY FOR INVESTMENT
2
Project Approach
 Data preprocessing - data transformation & outlier handling
based on industry historical data
 Key Performance Indicator selection - Rent yield, Income to
Rent Ratio & Population of housing units based on multi-co-
linearity & noise reduction
 Data modeling through unsupervised learning by Classification
with use of k means clustering technique
 Cluster profiling led to investment ranking recommendation
with scale from 1 to 5 for strategic investment selection
SWOT ANALYSIS OF ADOPTED CLUSTERING MODEL
3
STRENGTH
• Optimized number of clusters (7) by plotting of no. of clusters v/s
within sum of squared distances
• High ratio of Between SS / Total SS = 87% & 80%
• Good cluster profiling with varied investor choices
a) High population size places with high yield and good scope of
increasing rents
b) Medium population size places with high yield & no scope of
increasing rents
c) Medium population size places with relatively ok yield & high
scope of increasing rents
d) Small size population places with high yield & some scope of
increasing rents
WEAKNESS
• Clusters may have few property areas with the different
characteristics, further classification may be required for the final
investment decision
• There is a possibility of increase in the yield because of reduction in the
property prices resulting in the probable wrong conclusions
• Yield could be high due to the location with the heavy concentration of
the housing commission homes for higher rents in comparison with the
property prices
OPPORTUNITY
• Scope of adding more variables e.g. distress areas factor, climate risk
factors etc
• Addition of another variable for comparison to history rates could
counter the reduction in property prices problem leading to the rise in
yield
• Geographical Heat map can be used for segmenting & locating presence
of many markets in suburbs. Longitude & Latitude data is required for this
activity.
• Resource optimization can be further implemented to finalize
investment e.g. capital investment budget optimization
THREAT
• Presence of any historical housing data can provide a measure of
imminent property bubble. But in our dataset, there is no scope of
identifying such catastrophe, which is certainly what investors will be
interested in to check before investing.
• Strong dependence on the median prices & rent yield could lead to
anomalies especially in areas where many housing markets in single
suburb. It could lead to a wrong investment criteria.
CLUSTER VISUALIZATION
4
3 D cluster snapshot
visualization using
RGL package
Principal Component Analysis
Adjusted Box plots comparisons of clusters for KPIs
RECOMMENDATIONS
5
 Investor strategic alignment with property is the most important
aspect to consider rather building property portfolio based on scale
suggested by clustering model
 Clustering can not absorb uniqueness of each property. It classify
properties into clusters based on property characteristics. Further
cluster refinement will add value to investment decisions
 Additional variables such as risks, depressed area, historical housing
price, longitude & latitude need to be added to data set to fine tune
the clusters & bring more insights
DETAILED SUMMARY OF ANALYSIS
SYNOPSIS
Objective
– Recommend properties/places to investors
Property valuation approach
– Data Pre-processing
– Analytics KPI selection for Data modeling
• Multi-co-linearity & Noise reduction by skipping highly co-
related independent variables for analysis
– Data modeling through unsupervised learning by Classification
with use of k means clustering technique
– Recommendation based on clusters characteristics
METHODOLOGY
Data Pre-processing
– Excel data pre-processing
• Zip code observation alteration in excel
• Separate data set saving for individual analysis
• $ and , sign removal in excel from variable values
– R data pre-processing
• Scaling/ Normalizing/ Standardizing Data
– Various methods tried such as scaling with mean=0 and std dev=1
– Reducing prices and population values by dividing with standard value (e.g. 10000)
– Based on between sum of sq/total sum of sq & characteristics of clusters, data processing has
been finalized. The above ratio varies from 80 to 87%.
– Achieved best ratio with data where reduction of values by dividing is done. Moreover, by this
method, Interpretation is easy as compare to scaling.
• Inversion of Rent/Income to Income/Rent
– Data scaling & better data comparison, understanding
• Data type conversion for state and place Type to numeric
• Handling data anomalies
– Based on historical data of USA rent yield and rent to income variables, imputation done on
impossible values appendix (i)
– Multivariate imputation by chained equations (MICE) for values
» Rent yield >20%
» Rent/Income >30%
METHODOLOGY (CONT.)
• Key performance indicator selection for modeling
– Zip Dataset
• Rent Yield
• Median Income to Median Rent
• Population in occupied housing units
– Place Dataset
• In addition to above variables in zip Dataset
– Place Type as numeric
– State as numeric
• Highly Co-related variables skipped to reduce multi-co-linearity and noise
addition
– Median Rent, median income and median value of property
(variables effect already covered in yield & income to rent)
– Total Population( variable effect marginally covered in
population in occupied housing)
METHODOLOGY (CONT.)
• Data analysis
– Classification of given unsupervised dataset done by using
k means clustering
• K value optimization by use of graphical analysis
against within sum of square value
• Cluster selection based on visualization and
characteristics
– Adjusted Box plot of yield, income/rent and
population variable for all clusters comparison
Appendix(ii)
– Range, mean centers and other statistical
characteristics of cluster comparison
PROJECT SUMMARY
Based on rent yield, income/rent ratio & population, various properties
have been grouped in clusters
 Between sum of squares to total sum of square has been
maximized while focusing on cluster characteristics
 Every property is unique, clusters can provide foundation to
property selection for investment purposes based on KPI for
property valuation
 Based on investor requirements, property from strategic aligned
clusters can be chosen
 Additionally Clusters refining using sub-setting will help to get
desired characteristics property
RECOMMENDATION
 Tables in next slides will show various types of options available for
investment purposes.
 E.g. Clusters with high yield and medium size population having less
scope of increase in rents(low income/rent) can attract those
investors who are willing to invest in property which is already giving
good return of investment, although there is no additional scope of
increase in rents(however property price can be used)
 In second example, we can talk about cluster having high populated
areas & high scope of increasing rents with current yield as
marginally good (if not best), investor looking with future high return
can invest in such property
 As mentioned above, various categories for various clusters have been
recommended in next slides for investment purposes
 Ranking for investment has been done. Scales of 1 to 5 has been given.
1 as best attractive property to invest and 5 as least attractive
property.
 However there is no strict rule, as it depends purely on investor
strategic decisions to invest.
ZIP DATASET CLUSTER ANALYSIS
Type of property Zip Dataset –cluster
number
(no of properties)
Investing Rank
Preference(1 to 5)
1- highly recommended
5- least recommended
High yield, but less scope of increasing
rent, medium size of population
Cluster no 3
(No of properties -
3218)
Scale 1
High yield, no scope of increasing rent,
smallest population
Cluster no -2
(No of properties -
1100)
Scale 5
Relatively good yield with some scope
of increase in rents, smaller size
Population
Cluster no -6
(No of properties -
5982)
Scale 4
Relatively ok yield with little scope of
increasing rents, high population
Cluster no -1
(No of properties -
2107)
Scale 2
Yield little lower side, but very high
scope of increase in rent, medium size
of population
Cluster no -5
(No of properties -
7831)
Scale 3
PLACE DATASET CLUSTERS ANALYSIS
Type of property Place Dataset –cluster
number
(no of places)
Investing Rank Preference(1 to 5)
1- highly recommended
5- least recommended
high yield, high scope of increasing rent,
medium size population
Cluster 5
(No of places - 305)
Scale 1
Good yield, good scope of increasing rent,
smaller size population
Cluster 4
(No of places - 219)
Scale 4
High yield, with high scope of increasing rent,
smallest size of population
Cluster 7
(No of places - 200)
Scale 5
High yield, no scope of increasing rent,
medium size population
Cluster 2
(No of places - 156)
Scale 2
Relative ok yield, some scope of increasing
rents, large size population
Cluster 3
(No of places 272)
Scale 3
No strict scale rule, as it depends purely on investor strategic decisions to invest These clusters can be
refined to get better feel of properties by various means such as sub-setting. Moreover depressed areas like
flint and Detroit are in cluster 4, such factors need to be re-checked as there was no variable assigned to
them. Further analysis can be done on chosen cluster to get property as per investor requirements.
MORE RECOMMENDATION
 Integer optimization in conjunction with clustering to utilize resources efficiently
 Based on constraints such as investment budget, we can optimize
various property investments along with investor personalization.
 Geographical heat maps based on zip code for property investment
recommendation could be good option
 Addition of another variables to dataset
 Variable for distressing areas can be added into the dataset rather
looking individually after clustering
 Risk variable to be added in future (e.g. Typhoon prone area)
 There is possibility of increase in yield may be due to reduction in
property prices due to some reason. Comparison to history rates is
necessary in that case by adding another variable in dataset
 Things to check before finalizing investment
 Yield is calculated using median rent and median prices. Both variables
are highly susceptible to statistical anomaly especially where many
housing markets in single suburb
 Yield could be high due to location with heavy concentration of housing
commission homes for higher rent in comparison with property price
BOTTOM LINE
 Each property is unique with unique characteristics
 Clustering can help to figure out the various groups for
investment, Refinement will be advantageous before finalizing
property for investment
 Additional factors such as risk, depressed area etc need to be
considered in addition to some risks mentioned in last slide
 Investor strategic alignment with property is the most
important aspect to consider rather scale of property
provided.
APPENDIX(I)
• Historical values of KPI for outlier removal
– http://www.realestateanalysisfree.com/blog/real-estate-
analysis/price-to-rent-ratio-rental-yield-of-all-us-states
– http://seattlebubble.com/blog/2013/03/29/top-30-cities-
price-to-rent-price-to-income-ratios-2011/
CLUSTERS COMPARISON BASED ON KPI BY USING ADJUSTED
BOX PLOT FOR ZIP DATA (APPENDIX II)
APPENDIX (III)
GRAPHICAL ESTIMATION OF CLUSTERS
& ANALYSIS FOR CLUSTERING
APPENDIX(IV)
CLUSTERS VISUALIZATION CO-RELATION OF
VARIABLES

More Related Content

Viewers also liked

Yelp Data Challenge - Discovering Latent Factors using Ratings and Reviews
Yelp Data Challenge - Discovering Latent Factors using Ratings and ReviewsYelp Data Challenge - Discovering Latent Factors using Ratings and Reviews
Yelp Data Challenge - Discovering Latent Factors using Ratings and Reviews
Tharindu Mathew
 

Viewers also liked (15)

Sentiment analytics
Sentiment analytics Sentiment analytics
Sentiment analytics
 
Jigsaw Academy Digital India Contest - Kerala & Tamil Nadu
Jigsaw Academy Digital India Contest - Kerala & Tamil NaduJigsaw Academy Digital India Contest - Kerala & Tamil Nadu
Jigsaw Academy Digital India Contest - Kerala & Tamil Nadu
 
Aspect-level sentiment analysis of customer reviews using Double Propagation
Aspect-level sentiment analysis of customer reviews using Double PropagationAspect-level sentiment analysis of customer reviews using Double Propagation
Aspect-level sentiment analysis of customer reviews using Double Propagation
 
Psychographic Marketing | What You Show Know
Psychographic Marketing | What You Show KnowPsychographic Marketing | What You Show Know
Psychographic Marketing | What You Show Know
 
Yelp Data Challenge - Discovering Latent Factors using Ratings and Reviews
Yelp Data Challenge - Discovering Latent Factors using Ratings and ReviewsYelp Data Challenge - Discovering Latent Factors using Ratings and Reviews
Yelp Data Challenge - Discovering Latent Factors using Ratings and Reviews
 
"Managing User-Generated Reviews" - Jed Nachman (Yelp) - 2009 AIM Conference
"Managing User-Generated Reviews" - Jed Nachman (Yelp) - 2009 AIM Conference"Managing User-Generated Reviews" - Jed Nachman (Yelp) - 2009 AIM Conference
"Managing User-Generated Reviews" - Jed Nachman (Yelp) - 2009 AIM Conference
 
Snapchat Group Snaps Proposal
Snapchat Group Snaps ProposalSnapchat Group Snaps Proposal
Snapchat Group Snaps Proposal
 
Apache Giraph: Large-scale graph processing done better
Apache Giraph: Large-scale graph processing done betterApache Giraph: Large-scale graph processing done better
Apache Giraph: Large-scale graph processing done better
 
Class ppt intro to-sas
Class ppt   intro to-sasClass ppt   intro to-sas
Class ppt intro to-sas
 
SentiCheNews - Sentiment Analysis on Newspapers and Tweets
SentiCheNews - Sentiment Analysis on Newspapers and TweetsSentiCheNews - Sentiment Analysis on Newspapers and Tweets
SentiCheNews - Sentiment Analysis on Newspapers and Tweets
 
Yelp Project
Yelp ProjectYelp Project
Yelp Project
 
Class ppt overview of analytics
Class ppt overview of analyticsClass ppt overview of analytics
Class ppt overview of analytics
 
The path to be a data scientist
The path to be a data scientistThe path to be a data scientist
The path to be a data scientist
 
Yelp final
Yelp finalYelp final
Yelp final
 
How Sentiment Analysis works
How Sentiment Analysis worksHow Sentiment Analysis works
How Sentiment Analysis works
 

Similar to Jigsaw Mortgage Dex Data Analysis Competition Winner Presentation - Parindsheel Dhillon

Jigsaw Mortgage Dex Data Analysis Competition Winner Presentation - Shyam An...
 Jigsaw Mortgage Dex Data Analysis Competition Winner Presentation - Shyam An... Jigsaw Mortgage Dex Data Analysis Competition Winner Presentation - Shyam An...
Jigsaw Mortgage Dex Data Analysis Competition Winner Presentation - Shyam An...
Jigsaw Academy
 
Software engineering
Software engineeringSoftware engineering
Software engineering
Siddu-majety
 

Similar to Jigsaw Mortgage Dex Data Analysis Competition Winner Presentation - Parindsheel Dhillon (20)

IRJET- House Rent Price Prediction
IRJET- House Rent Price PredictionIRJET- House Rent Price Prediction
IRJET- House Rent Price Prediction
 
19CS3052R-CO1-7-S7 ECE
19CS3052R-CO1-7-S7 ECE19CS3052R-CO1-7-S7 ECE
19CS3052R-CO1-7-S7 ECE
 
Corporate Finance Models
Corporate Finance ModelsCorporate Finance Models
Corporate Finance Models
 
Axis_QuantFund_NFO_PPT presentation now here
Axis_QuantFund_NFO_PPT presentation now hereAxis_QuantFund_NFO_PPT presentation now here
Axis_QuantFund_NFO_PPT presentation now here
 
Predictive modeling for resale hdb evaluation price
Predictive modeling for resale hdb evaluation pricePredictive modeling for resale hdb evaluation price
Predictive modeling for resale hdb evaluation price
 
Prep smv
Prep smvPrep smv
Prep smv
 
Jigsaw Mortgage Dex Data Analysis Competition Winner Presentation - Shyam An...
 Jigsaw Mortgage Dex Data Analysis Competition Winner Presentation - Shyam An... Jigsaw Mortgage Dex Data Analysis Competition Winner Presentation - Shyam An...
Jigsaw Mortgage Dex Data Analysis Competition Winner Presentation - Shyam An...
 
Dlr company overview may metro
Dlr company overview may  metroDlr company overview may  metro
Dlr company overview may metro
 
Dlr company overview may final
Dlr company overview may finalDlr company overview may final
Dlr company overview may final
 
Eca workshop
Eca workshopEca workshop
Eca workshop
 
ECA Workshop - Brief
ECA Workshop - BriefECA Workshop - Brief
ECA Workshop - Brief
 
Dlr company-overview-march-final-3.4.16
Dlr company-overview-march-final-3.4.16Dlr company-overview-march-final-3.4.16
Dlr company-overview-march-final-3.4.16
 
Textual information analysis for the integration of different data repositories
Textual information analysis for the integration of different data repositoriesTextual information analysis for the integration of different data repositories
Textual information analysis for the integration of different data repositories
 
Predicting house price
Predicting house pricePredicting house price
Predicting house price
 
Renew power - ReLead Case Competition
Renew power - ReLead Case CompetitionRenew power - ReLead Case Competition
Renew power - ReLead Case Competition
 
PORTFOLIO MANAGEMENT
PORTFOLIO MANAGEMENTPORTFOLIO MANAGEMENT
PORTFOLIO MANAGEMENT
 
The metrics that matter using scalability metrics for project planning of a d...
The metrics that matter using scalability metrics for project planning of a d...The metrics that matter using scalability metrics for project planning of a d...
The metrics that matter using scalability metrics for project planning of a d...
 
GBS Benchmarking Solutions
GBS Benchmarking SolutionsGBS Benchmarking Solutions
GBS Benchmarking Solutions
 
De Martini PNNL-NREL International Workshop Feb 19, 2014
De Martini PNNL-NREL International Workshop Feb 19, 2014De Martini PNNL-NREL International Workshop Feb 19, 2014
De Martini PNNL-NREL International Workshop Feb 19, 2014
 
Software engineering
Software engineeringSoftware engineering
Software engineering
 

More from Jigsaw Academy

Advanced certication in financial analytics e-brochure
Advanced certication in financial analytics e-brochureAdvanced certication in financial analytics e-brochure
Advanced certication in financial analytics e-brochure
Jigsaw Academy
 

More from Jigsaw Academy (7)

Jigsaw Academy Pexitics Student Projects
Jigsaw Academy Pexitics Student ProjectsJigsaw Academy Pexitics Student Projects
Jigsaw Academy Pexitics Student Projects
 
Taximan Challenge on Data Visualization - Vicky Crasto
Taximan Challenge on Data Visualization - Vicky CrastoTaximan Challenge on Data Visualization - Vicky Crasto
Taximan Challenge on Data Visualization - Vicky Crasto
 
Jigsaw Academy Cafe Great Contest - Winning Presentations
Jigsaw Academy Cafe Great Contest - Winning PresentationsJigsaw Academy Cafe Great Contest - Winning Presentations
Jigsaw Academy Cafe Great Contest - Winning Presentations
 
The Jigsaw Team
The Jigsaw TeamThe Jigsaw Team
The Jigsaw Team
 
Topic 1 Introduction to web analytics
Topic  1   Introduction to web analytics Topic  1   Introduction to web analytics
Topic 1 Introduction to web analytics
 
Jigsaw Mortgage Dex Data Analysis Competition Winner Presentation - Balaji A...
 Jigsaw Mortgage Dex Data Analysis Competition Winner Presentation - Balaji A... Jigsaw Mortgage Dex Data Analysis Competition Winner Presentation - Balaji A...
Jigsaw Mortgage Dex Data Analysis Competition Winner Presentation - Balaji A...
 
Advanced certication in financial analytics e-brochure
Advanced certication in financial analytics e-brochureAdvanced certication in financial analytics e-brochure
Advanced certication in financial analytics e-brochure
 

Recently uploaded

一比一原版(UofM毕业证)明尼苏达大学毕业证成绩单
一比一原版(UofM毕业证)明尼苏达大学毕业证成绩单一比一原版(UofM毕业证)明尼苏达大学毕业证成绩单
一比一原版(UofM毕业证)明尼苏达大学毕业证成绩单
ewymefz
 
一比一原版(UPenn毕业证)宾夕法尼亚大学毕业证成绩单
一比一原版(UPenn毕业证)宾夕法尼亚大学毕业证成绩单一比一原版(UPenn毕业证)宾夕法尼亚大学毕业证成绩单
一比一原版(UPenn毕业证)宾夕法尼亚大学毕业证成绩单
ewymefz
 
Computer Presentation.pptx ecommerce advantage s
Computer Presentation.pptx ecommerce advantage sComputer Presentation.pptx ecommerce advantage s
Computer Presentation.pptx ecommerce advantage s
MAQIB18
 
一比一原版(NYU毕业证)纽约大学毕业证成绩单
一比一原版(NYU毕业证)纽约大学毕业证成绩单一比一原版(NYU毕业证)纽约大学毕业证成绩单
一比一原版(NYU毕业证)纽约大学毕业证成绩单
ewymefz
 
一比一原版(BU毕业证)波士顿大学毕业证成绩单
一比一原版(BU毕业证)波士顿大学毕业证成绩单一比一原版(BU毕业证)波士顿大学毕业证成绩单
一比一原版(BU毕业证)波士顿大学毕业证成绩单
ewymefz
 
一比一原版(CBU毕业证)不列颠海角大学毕业证成绩单
一比一原版(CBU毕业证)不列颠海角大学毕业证成绩单一比一原版(CBU毕业证)不列颠海角大学毕业证成绩单
一比一原版(CBU毕业证)不列颠海角大学毕业证成绩单
nscud
 
一比一原版(ArtEZ毕业证)ArtEZ艺术学院毕业证成绩单
一比一原版(ArtEZ毕业证)ArtEZ艺术学院毕业证成绩单一比一原版(ArtEZ毕业证)ArtEZ艺术学院毕业证成绩单
一比一原版(ArtEZ毕业证)ArtEZ艺术学院毕业证成绩单
vcaxypu
 
一比一原版(IIT毕业证)伊利诺伊理工大学毕业证成绩单
一比一原版(IIT毕业证)伊利诺伊理工大学毕业证成绩单一比一原版(IIT毕业证)伊利诺伊理工大学毕业证成绩单
一比一原版(IIT毕业证)伊利诺伊理工大学毕业证成绩单
ewymefz
 
一比一原版(YU毕业证)约克大学毕业证成绩单
一比一原版(YU毕业证)约克大学毕业证成绩单一比一原版(YU毕业证)约克大学毕业证成绩单
一比一原版(YU毕业证)约克大学毕业证成绩单
enxupq
 
一比一原版(UMich毕业证)密歇根大学|安娜堡分校毕业证成绩单
一比一原版(UMich毕业证)密歇根大学|安娜堡分校毕业证成绩单一比一原版(UMich毕业证)密歇根大学|安娜堡分校毕业证成绩单
一比一原版(UMich毕业证)密歇根大学|安娜堡分校毕业证成绩单
ewymefz
 

Recently uploaded (20)

Using PDB Relocation to Move a Single PDB to Another Existing CDB
Using PDB Relocation to Move a Single PDB to Another Existing CDBUsing PDB Relocation to Move a Single PDB to Another Existing CDB
Using PDB Relocation to Move a Single PDB to Another Existing CDB
 
Criminal IP - Threat Hunting Webinar.pdf
Criminal IP - Threat Hunting Webinar.pdfCriminal IP - Threat Hunting Webinar.pdf
Criminal IP - Threat Hunting Webinar.pdf
 
一比一原版(UofM毕业证)明尼苏达大学毕业证成绩单
一比一原版(UofM毕业证)明尼苏达大学毕业证成绩单一比一原版(UofM毕业证)明尼苏达大学毕业证成绩单
一比一原版(UofM毕业证)明尼苏达大学毕业证成绩单
 
How can I successfully sell my pi coins in Philippines?
How can I successfully sell my pi coins in Philippines?How can I successfully sell my pi coins in Philippines?
How can I successfully sell my pi coins in Philippines?
 
2024-05-14 - Tableau User Group - TC24 Hot Topics - Tableau Pulse and Einstei...
2024-05-14 - Tableau User Group - TC24 Hot Topics - Tableau Pulse and Einstei...2024-05-14 - Tableau User Group - TC24 Hot Topics - Tableau Pulse and Einstei...
2024-05-14 - Tableau User Group - TC24 Hot Topics - Tableau Pulse and Einstei...
 
Business update Q1 2024 Lar España Real Estate SOCIMI
Business update Q1 2024 Lar España Real Estate SOCIMIBusiness update Q1 2024 Lar España Real Estate SOCIMI
Business update Q1 2024 Lar España Real Estate SOCIMI
 
Jpolillo Amazon PPC - Bid Optimization Sample
Jpolillo Amazon PPC - Bid Optimization SampleJpolillo Amazon PPC - Bid Optimization Sample
Jpolillo Amazon PPC - Bid Optimization Sample
 
一比一原版(UPenn毕业证)宾夕法尼亚大学毕业证成绩单
一比一原版(UPenn毕业证)宾夕法尼亚大学毕业证成绩单一比一原版(UPenn毕业证)宾夕法尼亚大学毕业证成绩单
一比一原版(UPenn毕业证)宾夕法尼亚大学毕业证成绩单
 
Computer Presentation.pptx ecommerce advantage s
Computer Presentation.pptx ecommerce advantage sComputer Presentation.pptx ecommerce advantage s
Computer Presentation.pptx ecommerce advantage s
 
Q1’2024 Update: MYCI’s Leap Year Rebound
Q1’2024 Update: MYCI’s Leap Year ReboundQ1’2024 Update: MYCI’s Leap Year Rebound
Q1’2024 Update: MYCI’s Leap Year Rebound
 
一比一原版(NYU毕业证)纽约大学毕业证成绩单
一比一原版(NYU毕业证)纽约大学毕业证成绩单一比一原版(NYU毕业证)纽约大学毕业证成绩单
一比一原版(NYU毕业证)纽约大学毕业证成绩单
 
Webinar One View, Multiple Systems No-Code Integration of Salesforce and ERPs
Webinar One View, Multiple Systems No-Code Integration of Salesforce and ERPsWebinar One View, Multiple Systems No-Code Integration of Salesforce and ERPs
Webinar One View, Multiple Systems No-Code Integration of Salesforce and ERPs
 
Innovative Methods in Media and Communication Research by Sebastian Kubitschk...
Innovative Methods in Media and Communication Research by Sebastian Kubitschk...Innovative Methods in Media and Communication Research by Sebastian Kubitschk...
Innovative Methods in Media and Communication Research by Sebastian Kubitschk...
 
一比一原版(BU毕业证)波士顿大学毕业证成绩单
一比一原版(BU毕业证)波士顿大学毕业证成绩单一比一原版(BU毕业证)波士顿大学毕业证成绩单
一比一原版(BU毕业证)波士顿大学毕业证成绩单
 
一比一原版(CBU毕业证)不列颠海角大学毕业证成绩单
一比一原版(CBU毕业证)不列颠海角大学毕业证成绩单一比一原版(CBU毕业证)不列颠海角大学毕业证成绩单
一比一原版(CBU毕业证)不列颠海角大学毕业证成绩单
 
一比一原版(ArtEZ毕业证)ArtEZ艺术学院毕业证成绩单
一比一原版(ArtEZ毕业证)ArtEZ艺术学院毕业证成绩单一比一原版(ArtEZ毕业证)ArtEZ艺术学院毕业证成绩单
一比一原版(ArtEZ毕业证)ArtEZ艺术学院毕业证成绩单
 
Criminal IP - Threat Hunting Webinar.pdf
Criminal IP - Threat Hunting Webinar.pdfCriminal IP - Threat Hunting Webinar.pdf
Criminal IP - Threat Hunting Webinar.pdf
 
一比一原版(IIT毕业证)伊利诺伊理工大学毕业证成绩单
一比一原版(IIT毕业证)伊利诺伊理工大学毕业证成绩单一比一原版(IIT毕业证)伊利诺伊理工大学毕业证成绩单
一比一原版(IIT毕业证)伊利诺伊理工大学毕业证成绩单
 
一比一原版(YU毕业证)约克大学毕业证成绩单
一比一原版(YU毕业证)约克大学毕业证成绩单一比一原版(YU毕业证)约克大学毕业证成绩单
一比一原版(YU毕业证)约克大学毕业证成绩单
 
一比一原版(UMich毕业证)密歇根大学|安娜堡分校毕业证成绩单
一比一原版(UMich毕业证)密歇根大学|安娜堡分校毕业证成绩单一比一原版(UMich毕业证)密歇根大学|安娜堡分校毕业证成绩单
一比一原版(UMich毕业证)密歇根大学|安娜堡分校毕业证成绩单
 

Jigsaw Mortgage Dex Data Analysis Competition Winner Presentation - Parindsheel Dhillon

  • 1. JIGSAW ANALYTICS CONTEST (PROPERTY RECOMMENDATION FOR INVESTMENT) Parindsheel S. Dhillon
  • 2. RECOMMEND PROPERTY FOR INVESTMENT 2 Project Approach  Data preprocessing - data transformation & outlier handling based on industry historical data  Key Performance Indicator selection - Rent yield, Income to Rent Ratio & Population of housing units based on multi-co- linearity & noise reduction  Data modeling through unsupervised learning by Classification with use of k means clustering technique  Cluster profiling led to investment ranking recommendation with scale from 1 to 5 for strategic investment selection
  • 3. SWOT ANALYSIS OF ADOPTED CLUSTERING MODEL 3 STRENGTH • Optimized number of clusters (7) by plotting of no. of clusters v/s within sum of squared distances • High ratio of Between SS / Total SS = 87% & 80% • Good cluster profiling with varied investor choices a) High population size places with high yield and good scope of increasing rents b) Medium population size places with high yield & no scope of increasing rents c) Medium population size places with relatively ok yield & high scope of increasing rents d) Small size population places with high yield & some scope of increasing rents WEAKNESS • Clusters may have few property areas with the different characteristics, further classification may be required for the final investment decision • There is a possibility of increase in the yield because of reduction in the property prices resulting in the probable wrong conclusions • Yield could be high due to the location with the heavy concentration of the housing commission homes for higher rents in comparison with the property prices OPPORTUNITY • Scope of adding more variables e.g. distress areas factor, climate risk factors etc • Addition of another variable for comparison to history rates could counter the reduction in property prices problem leading to the rise in yield • Geographical Heat map can be used for segmenting & locating presence of many markets in suburbs. Longitude & Latitude data is required for this activity. • Resource optimization can be further implemented to finalize investment e.g. capital investment budget optimization THREAT • Presence of any historical housing data can provide a measure of imminent property bubble. But in our dataset, there is no scope of identifying such catastrophe, which is certainly what investors will be interested in to check before investing. • Strong dependence on the median prices & rent yield could lead to anomalies especially in areas where many housing markets in single suburb. It could lead to a wrong investment criteria.
  • 4. CLUSTER VISUALIZATION 4 3 D cluster snapshot visualization using RGL package Principal Component Analysis Adjusted Box plots comparisons of clusters for KPIs
  • 5. RECOMMENDATIONS 5  Investor strategic alignment with property is the most important aspect to consider rather building property portfolio based on scale suggested by clustering model  Clustering can not absorb uniqueness of each property. It classify properties into clusters based on property characteristics. Further cluster refinement will add value to investment decisions  Additional variables such as risks, depressed area, historical housing price, longitude & latitude need to be added to data set to fine tune the clusters & bring more insights
  • 7. SYNOPSIS Objective – Recommend properties/places to investors Property valuation approach – Data Pre-processing – Analytics KPI selection for Data modeling • Multi-co-linearity & Noise reduction by skipping highly co- related independent variables for analysis – Data modeling through unsupervised learning by Classification with use of k means clustering technique – Recommendation based on clusters characteristics
  • 8. METHODOLOGY Data Pre-processing – Excel data pre-processing • Zip code observation alteration in excel • Separate data set saving for individual analysis • $ and , sign removal in excel from variable values – R data pre-processing • Scaling/ Normalizing/ Standardizing Data – Various methods tried such as scaling with mean=0 and std dev=1 – Reducing prices and population values by dividing with standard value (e.g. 10000) – Based on between sum of sq/total sum of sq & characteristics of clusters, data processing has been finalized. The above ratio varies from 80 to 87%. – Achieved best ratio with data where reduction of values by dividing is done. Moreover, by this method, Interpretation is easy as compare to scaling. • Inversion of Rent/Income to Income/Rent – Data scaling & better data comparison, understanding • Data type conversion for state and place Type to numeric • Handling data anomalies – Based on historical data of USA rent yield and rent to income variables, imputation done on impossible values appendix (i) – Multivariate imputation by chained equations (MICE) for values » Rent yield >20% » Rent/Income >30%
  • 9. METHODOLOGY (CONT.) • Key performance indicator selection for modeling – Zip Dataset • Rent Yield • Median Income to Median Rent • Population in occupied housing units – Place Dataset • In addition to above variables in zip Dataset – Place Type as numeric – State as numeric • Highly Co-related variables skipped to reduce multi-co-linearity and noise addition – Median Rent, median income and median value of property (variables effect already covered in yield & income to rent) – Total Population( variable effect marginally covered in population in occupied housing)
  • 10. METHODOLOGY (CONT.) • Data analysis – Classification of given unsupervised dataset done by using k means clustering • K value optimization by use of graphical analysis against within sum of square value • Cluster selection based on visualization and characteristics – Adjusted Box plot of yield, income/rent and population variable for all clusters comparison Appendix(ii) – Range, mean centers and other statistical characteristics of cluster comparison
  • 11. PROJECT SUMMARY Based on rent yield, income/rent ratio & population, various properties have been grouped in clusters  Between sum of squares to total sum of square has been maximized while focusing on cluster characteristics  Every property is unique, clusters can provide foundation to property selection for investment purposes based on KPI for property valuation  Based on investor requirements, property from strategic aligned clusters can be chosen  Additionally Clusters refining using sub-setting will help to get desired characteristics property
  • 12. RECOMMENDATION  Tables in next slides will show various types of options available for investment purposes.  E.g. Clusters with high yield and medium size population having less scope of increase in rents(low income/rent) can attract those investors who are willing to invest in property which is already giving good return of investment, although there is no additional scope of increase in rents(however property price can be used)  In second example, we can talk about cluster having high populated areas & high scope of increasing rents with current yield as marginally good (if not best), investor looking with future high return can invest in such property  As mentioned above, various categories for various clusters have been recommended in next slides for investment purposes  Ranking for investment has been done. Scales of 1 to 5 has been given. 1 as best attractive property to invest and 5 as least attractive property.  However there is no strict rule, as it depends purely on investor strategic decisions to invest.
  • 13. ZIP DATASET CLUSTER ANALYSIS Type of property Zip Dataset –cluster number (no of properties) Investing Rank Preference(1 to 5) 1- highly recommended 5- least recommended High yield, but less scope of increasing rent, medium size of population Cluster no 3 (No of properties - 3218) Scale 1 High yield, no scope of increasing rent, smallest population Cluster no -2 (No of properties - 1100) Scale 5 Relatively good yield with some scope of increase in rents, smaller size Population Cluster no -6 (No of properties - 5982) Scale 4 Relatively ok yield with little scope of increasing rents, high population Cluster no -1 (No of properties - 2107) Scale 2 Yield little lower side, but very high scope of increase in rent, medium size of population Cluster no -5 (No of properties - 7831) Scale 3
  • 14. PLACE DATASET CLUSTERS ANALYSIS Type of property Place Dataset –cluster number (no of places) Investing Rank Preference(1 to 5) 1- highly recommended 5- least recommended high yield, high scope of increasing rent, medium size population Cluster 5 (No of places - 305) Scale 1 Good yield, good scope of increasing rent, smaller size population Cluster 4 (No of places - 219) Scale 4 High yield, with high scope of increasing rent, smallest size of population Cluster 7 (No of places - 200) Scale 5 High yield, no scope of increasing rent, medium size population Cluster 2 (No of places - 156) Scale 2 Relative ok yield, some scope of increasing rents, large size population Cluster 3 (No of places 272) Scale 3 No strict scale rule, as it depends purely on investor strategic decisions to invest These clusters can be refined to get better feel of properties by various means such as sub-setting. Moreover depressed areas like flint and Detroit are in cluster 4, such factors need to be re-checked as there was no variable assigned to them. Further analysis can be done on chosen cluster to get property as per investor requirements.
  • 15. MORE RECOMMENDATION  Integer optimization in conjunction with clustering to utilize resources efficiently  Based on constraints such as investment budget, we can optimize various property investments along with investor personalization.  Geographical heat maps based on zip code for property investment recommendation could be good option  Addition of another variables to dataset  Variable for distressing areas can be added into the dataset rather looking individually after clustering  Risk variable to be added in future (e.g. Typhoon prone area)  There is possibility of increase in yield may be due to reduction in property prices due to some reason. Comparison to history rates is necessary in that case by adding another variable in dataset  Things to check before finalizing investment  Yield is calculated using median rent and median prices. Both variables are highly susceptible to statistical anomaly especially where many housing markets in single suburb  Yield could be high due to location with heavy concentration of housing commission homes for higher rent in comparison with property price
  • 16. BOTTOM LINE  Each property is unique with unique characteristics  Clustering can help to figure out the various groups for investment, Refinement will be advantageous before finalizing property for investment  Additional factors such as risk, depressed area etc need to be considered in addition to some risks mentioned in last slide  Investor strategic alignment with property is the most important aspect to consider rather scale of property provided.
  • 17. APPENDIX(I) • Historical values of KPI for outlier removal – http://www.realestateanalysisfree.com/blog/real-estate- analysis/price-to-rent-ratio-rental-yield-of-all-us-states – http://seattlebubble.com/blog/2013/03/29/top-30-cities- price-to-rent-price-to-income-ratios-2011/
  • 18. CLUSTERS COMPARISON BASED ON KPI BY USING ADJUSTED BOX PLOT FOR ZIP DATA (APPENDIX II)
  • 19. APPENDIX (III) GRAPHICAL ESTIMATION OF CLUSTERS & ANALYSIS FOR CLUSTERING