
![Bosentan – liver injuries
• Logical course of events some occurrences need
careful interpretation (blood bilirubin inc. and
[hyper]bilirubinemia)
• Pattern AST/ALT unusual for liver injuries (but not for
mitochondrial injuries from hepatocytes) but
consistent with clinical safety data
• Residual and constant risk of liver failure
• Consistent with the putative mechanism of toxicity
(dose-dpt)
• Consistent with the safety profile of bosentan (lack of
independence)
• Influence of the risk minimisation activities
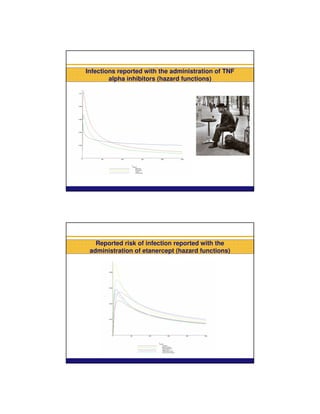
Infections reported with the administration of TNF
alpha inhibitors (KM)](https://image.slidesharecdn.com/parametricmodellingtimetoonset-12627950047867-phpapp01/85/Parametric-Modelling-Time-To-Onset-10-320.jpg)

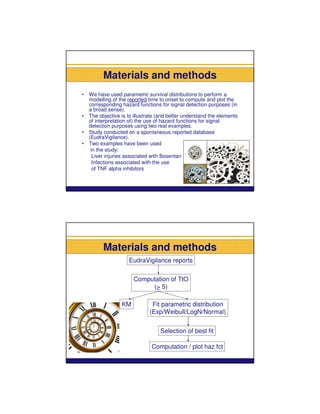
This document summarizes a presentation on parametric modelling of time to onset of adverse drug reactions using parametric survival distributions. It discusses using hazard functions from parametric distributions to analyze reported time to onset data from EudraVigilance to detect safety signals. Two examples are analyzed: liver injuries with bosentan and infections with TNF-alpha inhibitors. The results show patterns consistent with the known safety profiles and mechanisms of the drugs. Future work could improve understanding of reporting mechanisms and test the approach on more data.


![Bayesian estimations of strong toxic signals [compatibility mode]](https://cdn.slidesharecdn.com/ss_thumbnails/bayesianestimationsofstrongtoxicsignalscompatibilitymode-120927005019-phpapp02-thumbnail.jpg?width=640&height=640&fit=bounds)


