Panduan Menjawab Fzk Kertas 3 (Bhg A/ No.1)
•
1 like•144 views
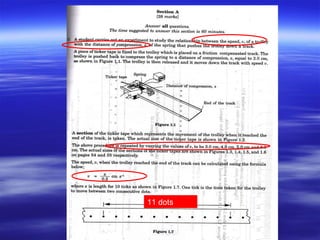
This document appears to be reporting data from an experiment measuring the relationship between the distance of compression (e) of a spring and the resulting speed (v) for different masses (m) and spring constants. It includes a table with columns for velocity (v), length for 10 ticks (x), distance of compression (e), and plots a graph of velocity (V) versus distance of compression (e). The data and graph suggest that within this experiment, the velocity (V) is directly proportional to the distance of compression (e) of the spring.
Report
Share
Report
Share

Recommended
Juj lipis smk palima garang2009
The document summarizes a chemistry seminar for high school students in the Lipis district of Pahang, Malaysia in 2009. It provides the schedule, objectives to improve students' chemistry knowledge and exam skills, and suggestions for teachers and students. Suggestions for teachers include ensuring all topics are covered, giving exercises after each topic, and teaching drawing diagrams correctly. Suggestions for students include reading questions carefully, planning answers, and fully mastering concepts like the mole concept.
Revision on redox ==july=2011=part 1
The document summarizes several chemistry experiments involving redox reactions:
1) An experiment where iron(III) chloride reacts with zinc, producing a green solution containing iron(II) ions. Zinc undergoes oxidation and iron(III) undergoes reduction in this redox reaction.
2) An experiment verifying that iodide ions act as a reducing agent by reducing acidified potassium manganate(VII) in a galvanistic cell containing a U-tube filled with sulfuric acid and electrodes.
3) Suggestions that sodium, potassium or lithium could be the metal M that reacts with oxygen to form an alkaline solution, along with the half reactions for this oxidation and
7 penskoran paper 3 2011
[DOCUMENT]:
This document provides sample answers and scoring guidelines for questions on the 2011 SPM Chemistry Paper 3 exam. It includes sample answers and scoring rubrics for multiple choice and structured questions that assess students' abilities to observe experiments, identify variables, write equations, explain concepts, and analyze and present data in tables and graphs. Key elements that are scored include correctly stating observations, inferences, variables, relationships between variables, experimental procedures, tabulated results, and explaining concepts. The document aims to guide teachers in accurately and consistently scoring student responses on the exam.
Chemistry revision presentation on section b dan c past year paper = ogos 2011
The document describes two experiments on the reaction of zinc with acids P and Q. Both reactions produced zinc salts and hydrogen gas while increasing in temperature. Experiment I used hydrochloric acid and produced zinc chloride and hydrogen gas. The energy profile diagram shows the heat of reaction (ΔH), activation energies without and with a catalyst (E and E'), and explains the energy changes in the reaction.
Question Analysis for Paper 3 Trial Chemistry 2012 from Different States
This document summarizes chemistry questions from trial exams given in different Malaysian states. It lists 13 states and the 3 questions asked on each state's exam, totaling 39 questions. The questions cover topics like comparing hardness of metals and alloys, determining heat of reactions, constructing electrochemical series, and analyzing effects of variables like other metals, concentration, and temperature. Many questions are repeated across multiple states and can be grouped into 7 common topics for analysis and planning experiments.
Analysis chemistry spm
This document provides an overview of common experimental questions and topics covered in the SPM Chemistry practical exams for Form 4 and Form 5 in Malaysia. It lists 17 experiments organized under 9 chapters for Form 4 and 24 experiments organized under 5 chapters for Form 5. The experiments cover a range of fundamental chemistry concepts including determining melting points, empirical formulas, reactivity of elements, properties of ionic/covalent compounds, electrolysis, acids/bases, rates of reaction, carbon compounds, oxidation/reduction, thermochemistry, and consumer chemicals. For each experiment, it indicates the relevant year(s) of past SPM exam papers that included similar questions.
Teknik Menjawap Kimia
1) The document provides guidelines for answering chemistry questions in the SPM (Malaysian Certificate of Education) examination, with tips on mastering core chemistry concepts, familiarizing with different question types, and completing past year papers.
2) It outlines how to score well in each paper, with Paper 1 testing knowledge, understanding and application; Paper 2 testing knowledge, understanding, analysis and synthesis through structured and essay questions; and Paper 3 evaluating mastery of scientific skills and experimental planning.
3) Key advice includes mastering topics like atomic structure and chemical formulas/equations, practicing various question types from past papers, and aiming for scores of 40+ in Paper 1 and 60+/40+ in Papers 2
Soalan skor kimia spm 2013
Perhatian kepada pelajar yang akan mengambil peperiksaan pada tahun 2013 ini, cikgu berharap agar kamu semua dapat menggunakan soalan analisis ini sebaik mungkin. Analisis ini telah cikgu kaji dari tahun ke tahun sebelumnya. Tolong fokus tajuk ini sebaik mungkin.
Laporan Amali Kimia: Penyediaan Larutan Piawai
By: Atifah Ruzana binti Abd Wahab, PPISMP Sains Ambilan Jun 2014, IPG Kampus Kent Tuaran Sabah
Analysis chemistry spm
This document provides an overview of common experimental questions and topics covered in the SPM Chemistry practical exams for Form 4 and Form 5 in Malaysia. It lists 17 chapters that cover different chemistry concepts and experimental procedures that students may be required to complete as part of their SPM practical exam, such as determining melting points, constructing electrochemical series, investigating reaction rates through various factors, and comparing properties of compounds. For each chapter, it provides examples of specific experiments conducted with references to past SPM exam questions.
Soalan Ramalan Kimia SPM 2013
Di sini cikgu sertakan soalan ramalan kimia kertas 2 yang telah dianalisis dari tahun ke tahun lepas. Selamat mencuba dan selamat berjaya. Mudah-mudahan usaha kamu akan berhasil untuk memperoleh A dalam subjuk kimia pada tahun ini.
Question Analysis of Paper 1 Chemistry SPM 2013
This document contains a table listing 50 chemistry questions from the 2013 SPM exam in Malaysia and their corresponding answers. The questions cover various chemistry topics including atomic structure, oxidation and reduction, manufacturing substances, carbon compounds, acids and bases, periodic table, chemical bonds, thermochemistry, and chemical formulas and equations. The answers range from A to D for each multiple choice question.
66136916 kimia-paper-2-f4-akhir-sbp-06
1. The document is a chemistry exam paper containing multiple choice and structured questions testing knowledge of chemistry concepts and skills such as writing chemical equations and calculations.
2. It includes questions testing knowledge of the periodic table, molecular and empirical formulas, chemical reactions like acid-base titration and electrolysis, and acid-base properties.
3. Diagrams and tables are provided to support questions about apparatus set-ups, chemical equations, and recording results of titration experiments.
Nota formula dan persamaan kimia
Bab 3 membahas tentang jisim atom relatif, jisim molekul relatif, dan jisim formula relatif. Jisim-jisim tersebut ditentukan dengan menjumlahkan jisim atom relatif setiap unsur dalam molekul atau senyawa kimia. Misalnya, jisim molekul relatif air H2O adalah 2(1) + 16 = 18, karena terdiri dari dua atom hidrogen dan satu atom oksigen.
Question Analysis for Paper 3 Trial Chemistry 2011 from Different States
This document summarizes chemistry questions asked in different states for a 2011 trial exam. It lists 14 states and 3 questions asked in each state related to topics like electrolysis, reactivity series, heat of combustion, acids/bases, and corrosion. The questions assess understanding of concepts like electrode effects, writing ionic equations, comparing heats of reaction, and constructing electrochemical series based on metal reactivity.
Formula dan persamaan kimia
Sebagai rujukan guru dan pelajar. Edisi terbaharu. Mudah dan cepat belajar.
LAND USE LAND COVER AND NDVI OF MIRZAPUR DISTRICT, UP
This Dissertation explores the particular circumstances of Mirzapur, a region located in the
core of India. Mirzapur, with its varied terrains and abundant biodiversity, offers an optimal
environment for investigating the changes in vegetation cover dynamics. Our study utilizes
advanced technologies such as GIS (Geographic Information Systems) and Remote sensing to
analyze the transformations that have taken place over the course of a decade.
The complex relationship between human activities and the environment has been the focus
of extensive research and worry. As the global community grapples with swift urbanization,
population expansion, and economic progress, the effects on natural ecosystems are becoming
more evident. A crucial element of this impact is the alteration of vegetation cover, which plays a
significant role in maintaining the ecological equilibrium of our planet.Land serves as the foundation for all human activities and provides the necessary materials for
these activities. As the most crucial natural resource, its utilization by humans results in different
'Land uses,' which are determined by both human activities and the physical characteristics of the
land.
The utilization of land is impacted by human needs and environmental factors. In countries
like India, rapid population growth and the emphasis on extensive resource exploitation can lead
to significant land degradation, adversely affecting the region's land cover.
Therefore, human intervention has significantly influenced land use patterns over many
centuries, evolving its structure over time and space. In the present era, these changes have
accelerated due to factors such as agriculture and urbanization. Information regarding land use and
cover is essential for various planning and management tasks related to the Earth's surface,
providing crucial environmental data for scientific, resource management, policy purposes, and
diverse human activities.
Accurate understanding of land use and cover is imperative for the development planning
of any area. Consequently, a wide range of professionals, including earth system scientists, land
and water managers, and urban planners, are interested in obtaining data on land use and cover
changes, conversion trends, and other related patterns. The spatial dimensions of land use and
cover support policymakers and scientists in making well-informed decisions, as alterations in
these patterns indicate shifts in economic and social conditions. Monitoring such changes with the
help of Advanced technologies like Remote Sensing and Geographic Information Systems is
crucial for coordinated efforts across different administrative levels. Advanced technologies like
Remote Sensing and Geographic Information Systems
9
Changes in vegetation cover refer to variations in the distribution, composition, and overall
structure of plant communities across different temporal and spatial scales. These changes can
occur natural.
More Related Content
Viewers also liked
Question Analysis for Paper 3 Trial Chemistry 2012 from Different States
This document summarizes chemistry questions from trial exams given in different Malaysian states. It lists 13 states and the 3 questions asked on each state's exam, totaling 39 questions. The questions cover topics like comparing hardness of metals and alloys, determining heat of reactions, constructing electrochemical series, and analyzing effects of variables like other metals, concentration, and temperature. Many questions are repeated across multiple states and can be grouped into 7 common topics for analysis and planning experiments.
Analysis chemistry spm
This document provides an overview of common experimental questions and topics covered in the SPM Chemistry practical exams for Form 4 and Form 5 in Malaysia. It lists 17 experiments organized under 9 chapters for Form 4 and 24 experiments organized under 5 chapters for Form 5. The experiments cover a range of fundamental chemistry concepts including determining melting points, empirical formulas, reactivity of elements, properties of ionic/covalent compounds, electrolysis, acids/bases, rates of reaction, carbon compounds, oxidation/reduction, thermochemistry, and consumer chemicals. For each experiment, it indicates the relevant year(s) of past SPM exam papers that included similar questions.
Teknik Menjawap Kimia
1) The document provides guidelines for answering chemistry questions in the SPM (Malaysian Certificate of Education) examination, with tips on mastering core chemistry concepts, familiarizing with different question types, and completing past year papers.
2) It outlines how to score well in each paper, with Paper 1 testing knowledge, understanding and application; Paper 2 testing knowledge, understanding, analysis and synthesis through structured and essay questions; and Paper 3 evaluating mastery of scientific skills and experimental planning.
3) Key advice includes mastering topics like atomic structure and chemical formulas/equations, practicing various question types from past papers, and aiming for scores of 40+ in Paper 1 and 60+/40+ in Papers 2
Soalan skor kimia spm 2013
Perhatian kepada pelajar yang akan mengambil peperiksaan pada tahun 2013 ini, cikgu berharap agar kamu semua dapat menggunakan soalan analisis ini sebaik mungkin. Analisis ini telah cikgu kaji dari tahun ke tahun sebelumnya. Tolong fokus tajuk ini sebaik mungkin.
Laporan Amali Kimia: Penyediaan Larutan Piawai
By: Atifah Ruzana binti Abd Wahab, PPISMP Sains Ambilan Jun 2014, IPG Kampus Kent Tuaran Sabah
Analysis chemistry spm
This document provides an overview of common experimental questions and topics covered in the SPM Chemistry practical exams for Form 4 and Form 5 in Malaysia. It lists 17 chapters that cover different chemistry concepts and experimental procedures that students may be required to complete as part of their SPM practical exam, such as determining melting points, constructing electrochemical series, investigating reaction rates through various factors, and comparing properties of compounds. For each chapter, it provides examples of specific experiments conducted with references to past SPM exam questions.
Soalan Ramalan Kimia SPM 2013
Di sini cikgu sertakan soalan ramalan kimia kertas 2 yang telah dianalisis dari tahun ke tahun lepas. Selamat mencuba dan selamat berjaya. Mudah-mudahan usaha kamu akan berhasil untuk memperoleh A dalam subjuk kimia pada tahun ini.
Question Analysis of Paper 1 Chemistry SPM 2013
This document contains a table listing 50 chemistry questions from the 2013 SPM exam in Malaysia and their corresponding answers. The questions cover various chemistry topics including atomic structure, oxidation and reduction, manufacturing substances, carbon compounds, acids and bases, periodic table, chemical bonds, thermochemistry, and chemical formulas and equations. The answers range from A to D for each multiple choice question.
66136916 kimia-paper-2-f4-akhir-sbp-06
1. The document is a chemistry exam paper containing multiple choice and structured questions testing knowledge of chemistry concepts and skills such as writing chemical equations and calculations.
2. It includes questions testing knowledge of the periodic table, molecular and empirical formulas, chemical reactions like acid-base titration and electrolysis, and acid-base properties.
3. Diagrams and tables are provided to support questions about apparatus set-ups, chemical equations, and recording results of titration experiments.
Nota formula dan persamaan kimia
Bab 3 membahas tentang jisim atom relatif, jisim molekul relatif, dan jisim formula relatif. Jisim-jisim tersebut ditentukan dengan menjumlahkan jisim atom relatif setiap unsur dalam molekul atau senyawa kimia. Misalnya, jisim molekul relatif air H2O adalah 2(1) + 16 = 18, karena terdiri dari dua atom hidrogen dan satu atom oksigen.
Question Analysis for Paper 3 Trial Chemistry 2011 from Different States
This document summarizes chemistry questions asked in different states for a 2011 trial exam. It lists 14 states and 3 questions asked in each state related to topics like electrolysis, reactivity series, heat of combustion, acids/bases, and corrosion. The questions assess understanding of concepts like electrode effects, writing ionic equations, comparing heats of reaction, and constructing electrochemical series based on metal reactivity.
Formula dan persamaan kimia
Sebagai rujukan guru dan pelajar. Edisi terbaharu. Mudah dan cepat belajar.
Viewers also liked (20)
Question Analysis for Paper 3 Trial Chemistry 2012 from Different States
Question Analysis for Paper 3 Trial Chemistry 2012 from Different States
Question Analysis for Paper 3 Trial Chemistry 2011 from Different States
Question Analysis for Paper 3 Trial Chemistry 2011 from Different States
Recently uploaded
LAND USE LAND COVER AND NDVI OF MIRZAPUR DISTRICT, UP
This Dissertation explores the particular circumstances of Mirzapur, a region located in the
core of India. Mirzapur, with its varied terrains and abundant biodiversity, offers an optimal
environment for investigating the changes in vegetation cover dynamics. Our study utilizes
advanced technologies such as GIS (Geographic Information Systems) and Remote sensing to
analyze the transformations that have taken place over the course of a decade.
The complex relationship between human activities and the environment has been the focus
of extensive research and worry. As the global community grapples with swift urbanization,
population expansion, and economic progress, the effects on natural ecosystems are becoming
more evident. A crucial element of this impact is the alteration of vegetation cover, which plays a
significant role in maintaining the ecological equilibrium of our planet.Land serves as the foundation for all human activities and provides the necessary materials for
these activities. As the most crucial natural resource, its utilization by humans results in different
'Land uses,' which are determined by both human activities and the physical characteristics of the
land.
The utilization of land is impacted by human needs and environmental factors. In countries
like India, rapid population growth and the emphasis on extensive resource exploitation can lead
to significant land degradation, adversely affecting the region's land cover.
Therefore, human intervention has significantly influenced land use patterns over many
centuries, evolving its structure over time and space. In the present era, these changes have
accelerated due to factors such as agriculture and urbanization. Information regarding land use and
cover is essential for various planning and management tasks related to the Earth's surface,
providing crucial environmental data for scientific, resource management, policy purposes, and
diverse human activities.
Accurate understanding of land use and cover is imperative for the development planning
of any area. Consequently, a wide range of professionals, including earth system scientists, land
and water managers, and urban planners, are interested in obtaining data on land use and cover
changes, conversion trends, and other related patterns. The spatial dimensions of land use and
cover support policymakers and scientists in making well-informed decisions, as alterations in
these patterns indicate shifts in economic and social conditions. Monitoring such changes with the
help of Advanced technologies like Remote Sensing and Geographic Information Systems is
crucial for coordinated efforts across different administrative levels. Advanced technologies like
Remote Sensing and Geographic Information Systems
9
Changes in vegetation cover refer to variations in the distribution, composition, and overall
structure of plant communities across different temporal and spatial scales. These changes can
occur natural.
How to deliver Powerpoint Presentations.pptx
"How to make and deliver dynamic presentations by making it more interactive to captivate your audience attention"
Chapter wise All Notes of First year Basic Civil Engineering.pptx
Chapter wise All Notes of First year Basic Civil Engineering
Syllabus
Chapter-1
Introduction to objective, scope and outcome the subject
Chapter 2
Introduction: Scope and Specialization of Civil Engineering, Role of civil Engineer in Society, Impact of infrastructural development on economy of country.
Chapter 3
Surveying: Object Principles & Types of Surveying; Site Plans, Plans & Maps; Scales & Unit of different Measurements.
Linear Measurements: Instruments used. Linear Measurement by Tape, Ranging out Survey Lines and overcoming Obstructions; Measurements on sloping ground; Tape corrections, conventional symbols. Angular Measurements: Instruments used; Introduction to Compass Surveying, Bearings and Longitude & Latitude of a Line, Introduction to total station.
Levelling: Instrument used Object of levelling, Methods of levelling in brief, and Contour maps.
Chapter 4
Buildings: Selection of site for Buildings, Layout of Building Plan, Types of buildings, Plinth area, carpet area, floor space index, Introduction to building byelaws, concept of sun light & ventilation. Components of Buildings & their functions, Basic concept of R.C.C., Introduction to types of foundation
Chapter 5
Transportation: Introduction to Transportation Engineering; Traffic and Road Safety: Types and Characteristics of Various Modes of Transportation; Various Road Traffic Signs, Causes of Accidents and Road Safety Measures.
Chapter 6
Environmental Engineering: Environmental Pollution, Environmental Acts and Regulations, Functional Concepts of Ecology, Basics of Species, Biodiversity, Ecosystem, Hydrological Cycle; Chemical Cycles: Carbon, Nitrogen & Phosphorus; Energy Flow in Ecosystems.
Water Pollution: Water Quality standards, Introduction to Treatment & Disposal of Waste Water. Reuse and Saving of Water, Rain Water Harvesting. Solid Waste Management: Classification of Solid Waste, Collection, Transportation and Disposal of Solid. Recycling of Solid Waste: Energy Recovery, Sanitary Landfill, On-Site Sanitation. Air & Noise Pollution: Primary and Secondary air pollutants, Harmful effects of Air Pollution, Control of Air Pollution. . Noise Pollution Harmful Effects of noise pollution, control of noise pollution, Global warming & Climate Change, Ozone depletion, Greenhouse effect
Text Books:
1. Palancharmy, Basic Civil Engineering, McGraw Hill publishers.
2. Satheesh Gopi, Basic Civil Engineering, Pearson Publishers.
3. Ketki Rangwala Dalal, Essentials of Civil Engineering, Charotar Publishing House.
4. BCP, Surveying volume 1
Advanced Java[Extra Concepts, Not Difficult].docx
This is part 2 of my Java Learning Journey. This contains Hashing, ArrayList, LinkedList, Date and Time Classes, Calendar Class and more.
Solutons Maths Escape Room Spatial .pptx
Solutions of Puzzles of Mathematics Escape Room Game in Spatial.io
Mule event processing models | MuleSoft Mysore Meetup #47
Mule event processing models | MuleSoft Mysore Meetup #47
Event Link:- https://meetups.mulesoft.com/events/details/mulesoft-mysore-presents-mule-event-processing-models/
Agenda
● What is event processing in MuleSoft?
● Types of event processing models in Mule 4
● Distinction between the reactive, parallel, blocking & non-blocking processing
For Upcoming Meetups Join Mysore Meetup Group - https://meetups.mulesoft.com/mysore/YouTube:- youtube.com/@mulesoftmysore
Mysore WhatsApp group:- https://chat.whatsapp.com/EhqtHtCC75vCAX7gaO842N
Speaker:-
Shivani Yasaswi - https://www.linkedin.com/in/shivaniyasaswi/
Organizers:-
Shubham Chaurasia - https://www.linkedin.com/in/shubhamchaurasia1/
Giridhar Meka - https://www.linkedin.com/in/giridharmeka
Priya Shaw - https://www.linkedin.com/in/priya-shaw
How to Setup Warehouse & Location in Odoo 17 Inventory
In this slide, we'll explore how to set up warehouses and locations in Odoo 17 Inventory. This will help us manage our stock effectively, track inventory levels, and streamline warehouse operations.
What is Digital Literacy? A guest blog from Andy McLaughlin, University of Ab...
What is Digital Literacy? A guest blog from Andy McLaughlin, University of Aberdeen
Gender and Mental Health - Counselling and Family Therapy Applications and In...
A proprietary approach developed by bringing together the best of learning theories from Psychology, design principles from the world of visualization, and pedagogical methods from over a decade of training experience, that enables you to: Learn better, faster!
Wound healing PPT
This document provides an overview of wound healing, its functions, stages, mechanisms, factors affecting it, and complications.
A wound is a break in the integrity of the skin or tissues, which may be associated with disruption of the structure and function.
Healing is the body’s response to injury in an attempt to restore normal structure and functions.
Healing can occur in two ways: Regeneration and Repair
There are 4 phases of wound healing: hemostasis, inflammation, proliferation, and remodeling. This document also describes the mechanism of wound healing. Factors that affect healing include infection, uncontrolled diabetes, poor nutrition, age, anemia, the presence of foreign bodies, etc.
Complications of wound healing like infection, hyperpigmentation of scar, contractures, and keloid formation.
Your Skill Boost Masterclass: Strategies for Effective Upskilling
Your Skill Boost Masterclass: Strategies for Effective UpskillingExcellence Foundation for South Sudan
Strategies for Effective Upskilling is a presentation by Chinwendu Peace in a Your Skill Boost Masterclass organisation by the Excellence Foundation for South Sudan on 08th and 09th June 2024 from 1 PM to 3 PM on each day.বাংলাদেশ অর্থনৈতিক সমীক্ষা (Economic Review) ২০২৪ UJS App.pdf
বাংলাদেশের অর্থনৈতিক সমীক্ষা ২০২৪ [Bangladesh Economic Review 2024 Bangla.pdf] কম্পিউটার , ট্যাব ও স্মার্ট ফোন ভার্সন সহ সম্পূর্ণ বাংলা ই-বুক বা pdf বই " সুচিপত্র ...বুকমার্ক মেনু 🔖 ও হাইপার লিংক মেনু 📝👆 যুক্ত ..
আমাদের সবার জন্য খুব খুব গুরুত্বপূর্ণ একটি বই ..বিসিএস, ব্যাংক, ইউনিভার্সিটি ভর্তি ও যে কোন প্রতিযোগিতা মূলক পরীক্ষার জন্য এর খুব ইম্পরট্যান্ট একটি বিষয় ...তাছাড়া বাংলাদেশের সাম্প্রতিক যে কোন ডাটা বা তথ্য এই বইতে পাবেন ...
তাই একজন নাগরিক হিসাবে এই তথ্য গুলো আপনার জানা প্রয়োজন ...।
বিসিএস ও ব্যাংক এর লিখিত পরীক্ষা ...+এছাড়া মাধ্যমিক ও উচ্চমাধ্যমিকের স্টুডেন্টদের জন্য অনেক কাজে আসবে ...
BÀI TẬP BỔ TRỢ TIẾNG ANH LỚP 9 CẢ NĂM - GLOBAL SUCCESS - NĂM HỌC 2024-2025 - ...
BÀI TẬP BỔ TRỢ TIẾNG ANH LỚP 9 CẢ NĂM - GLOBAL SUCCESS - NĂM HỌC 2024-2025 - ...Nguyen Thanh Tu Collection
https://app.box.com/s/tacvl9ekroe9hqupdnjruiypvm9rdaneBeyond Degrees - Empowering the Workforce in the Context of Skills-First.pptx
Iván Bornacelly, Policy Analyst at the OECD Centre for Skills, OECD, presents at the webinar 'Tackling job market gaps with a skills-first approach' on 12 June 2024
The History of Stoke Newington Street Names
Presented at the Stoke Newington Literary Festival on 9th June 2024
www.StokeNewingtonHistory.com
BÀI TẬP BỔ TRỢ TIẾNG ANH 8 CẢ NĂM - GLOBAL SUCCESS - NĂM HỌC 2023-2024 (CÓ FI...
BÀI TẬP BỔ TRỢ TIẾNG ANH 8 CẢ NĂM - GLOBAL SUCCESS - NĂM HỌC 2023-2024 (CÓ FI...Nguyen Thanh Tu Collection
https://app.box.com/s/y977uz6bpd3af4qsebv7r9b7s21935vdRecently uploaded (20)
LAND USE LAND COVER AND NDVI OF MIRZAPUR DISTRICT, UP
LAND USE LAND COVER AND NDVI OF MIRZAPUR DISTRICT, UP
Chapter wise All Notes of First year Basic Civil Engineering.pptx
Chapter wise All Notes of First year Basic Civil Engineering.pptx
Film vocab for eal 3 students: Australia the movie
Film vocab for eal 3 students: Australia the movie
Mule event processing models | MuleSoft Mysore Meetup #47
Mule event processing models | MuleSoft Mysore Meetup #47
How to Setup Warehouse & Location in Odoo 17 Inventory
How to Setup Warehouse & Location in Odoo 17 Inventory
NEWSPAPERS - QUESTION 1 - REVISION POWERPOINT.pptx
NEWSPAPERS - QUESTION 1 - REVISION POWERPOINT.pptx
What is Digital Literacy? A guest blog from Andy McLaughlin, University of Ab...
What is Digital Literacy? A guest blog from Andy McLaughlin, University of Ab...
Gender and Mental Health - Counselling and Family Therapy Applications and In...
Gender and Mental Health - Counselling and Family Therapy Applications and In...
Your Skill Boost Masterclass: Strategies for Effective Upskilling
Your Skill Boost Masterclass: Strategies for Effective Upskilling
বাংলাদেশ অর্থনৈতিক সমীক্ষা (Economic Review) ২০২৪ UJS App.pdf
বাংলাদেশ অর্থনৈতিক সমীক্ষা (Economic Review) ২০২৪ UJS App.pdf
BÀI TẬP BỔ TRỢ TIẾNG ANH LỚP 9 CẢ NĂM - GLOBAL SUCCESS - NĂM HỌC 2024-2025 - ...
BÀI TẬP BỔ TRỢ TIẾNG ANH LỚP 9 CẢ NĂM - GLOBAL SUCCESS - NĂM HỌC 2024-2025 - ...
Beyond Degrees - Empowering the Workforce in the Context of Skills-First.pptx
Beyond Degrees - Empowering the Workforce in the Context of Skills-First.pptx
BÀI TẬP BỔ TRỢ TIẾNG ANH 8 CẢ NĂM - GLOBAL SUCCESS - NĂM HỌC 2023-2024 (CÓ FI...
BÀI TẬP BỔ TRỢ TIẾNG ANH 8 CẢ NĂM - GLOBAL SUCCESS - NĂM HỌC 2023-2024 (CÓ FI...
spot a liar (Haiqa 146).pptx Technical writhing and presentation skills
spot a liar (Haiqa 146).pptx Technical writhing and presentation skills
Panduan Menjawab Fzk Kertas 3 (Bhg A/ No.1)
- 1. 11 dots
- 2. 4.5 7.5
- 4. Distance of compression, e Speed, v mass,/ spring constant
- 5. Tabulate table 77.0 15.4 6.0 63.5 12.7 5.0 56.0 11.2 4.0 37.5 7.5 3.0 22.5 4.5 2.0 Velocity, V(cms-1) Length for 10 ticks x, cm Distance of compresion,e(cm)
- 6. V, cms-1 e, cm 70.0 60.0 50.0 40.0 30.0 20.0 10.0 1.0 2.0 3.0 4.0 5.0 6.0
- 7. Distance of compression, e Speed, v mass,/ spring constant V is directly proportional to e