SlideShare a Scribd company logo
Stetson University Student Research
This report is published for educational purposes
only by Gonzalo Arroyo-Baudet Industry: Bank
Ticker:PACW Recommendation: Buy
Price: $ 47.14 (as of 11/08/2015) Price Target: $54
Earnings/Share Mar. Jun. Sep. Dec. Year P/E
Ratio2012 $0.14 $0.42 $0.43 $0.54 $1.54 12.52
2013 0.37 0.11 0.53 0.06 1.08 27.29
2014 0.55 0.10 0.60 0.69 2.55 16.94
2015E* 0.71 0.83 0.76 0.71 2.97 15.73
2016E 0.64 0.74 0.74 1.05 3.74 15.07
*Bolded/italicized figures are team estimates
Highlights
 Net Interest Rate Spread: The primary interest‑earning assets are loans and investment
securities, and the primary interest‑bearing liabilities are deposits. A high yield in interest
earnings and a competitive cost of deposits contribute to the high net interest margin. While an
average bank has a 3-3.5% on net interest margins, Pacwest achieves quarter after quarter a
5.5%.This is a key determinant of a financial institution's profitability.
 Niche Lending Focus: They have a good market position in key business segments, including its
national commercial lending platform to middle-market companies. They lend money to small and
mid-business that need adventure capital. In California there are thousands of new companies with
a lot of potential that need financial help to continue their growth. Pacwest is committed to the
entrepreneurial and venture communities; they offer their clients a wide array of products, giving
them assistance through all stages of their growth. Even though this kind of lending is more risky
than lending to individuals, the default risk has been decreasing. It is as of right now less than 1%
while the Industry is 2%.
 Regional Banks in Takeover: With Pacwest being a regional bank, and having established
access to the California market, any large bank looking to operate on the west coast will consider
acquiring Pacwest. Pacwest as of right now has 1.1% of the market share of California with 82
offices. Along with the number of offices and market share Pacwest owns, they have a P/B of 1.23
making them relatively inexpensive compared to the industry average of regional banks who’s
P/B is 1.5. On the other hand Pacwest Bancorp has purchased 27 financial institutions since 2000.
Their corporate strategy is to continuously acquire other financial institutions which help them
expand in the core fields.
 Attractive Valuation Indicates a BUY: With interest rates expecting to rise in 2015, Pacwest is
positioned nicely for a strong return. PACW will benefit from good loan growth and growth in
several fee areas. The valuations indicate an average fair value price of $54 and an undervaluation
of 15% which makes them an attractive buy.
Source: Thompson Baseline
Date: 11/15/2015
Source: Yahoo! Finance
11/15/15
Gonzalo Arroyo-Baudet
Stetson University Student Research
2
Exhibit 1: The Company
Exhibit 3: Allowance For Loan Losses
Exhibit 4: Venture Capital Investment
Top 5 States
Business Description
Company: PacWest Bancorp is a regional bank that operates through two segments; Pacific Western Bank
which include lending and deposit gathering activities and Capital Source which provides small and middle-
market businesses loans and leases; it is focused on capital adventure. Pacific Western Bank has 80 offices
mainly in southern California and San Francisco. Pacific Western also provides working capital financing to
growing companies located throughout the Southwest, in states like Arizona or Texas. Capital Source and
Square 1 Bank divisions have offices across United States in cities like Maryland, Denver, Chicago, New
York and Midvale (Utah). With its strong presence in California, PacWest Bancorp has become 14th largest
commercial bank in U.S.
Investment Rationale
Pacwest Bancorp. is being recommended as a Buy for the following reasons.
Regional Banks in Takeovers: With Pacwest being a regional bank, and having established access to the
California market, any large bank looking to operate on the west coast will consider acquiring Pacwest.
Pacwest as of right now has 1.1% of the market share of California with 82 offices. Along with the number
of offices and market share Pacwest owns, they have a P/E of 15 making them relatively inexpensive
compared to the industry average of regional banks who’s P/E is 19. On the other hand Pacwest Bancorp
has purchased 27 financial institutions since 2000. Their corporate strategy is to continuously acquire other
financial institutions which help them expand in the core fields.
Barriers of Entry: The banking industry is really hard to enter in. Some barriers to entry in financial
services markets include licensure laws, capital requirements, access to financing, regulatory compliance
and security concerns. Between banks there are so many regulations, and in many cases, the costs of
compliance and threat of litigation are sufficient to deter firms from entering the market. Another barrier
would be the capital requirement; high fixed costs and large sunk costs in the development of financial
services make it difficult for new companies to compete with large firms that have scale efficiencies. In the
bank industry, you need to be big (have a large amount of clients) to be profitable.
Innovative/Niche market: Pacwest has abnormal net interest rate spreads. While banks usually have a
spread of 3 to 3.5%, Pacwest achieves every year over 5.5%. This is because their loans and leases are
focused on commercial loans. They have a large commercial lending platform to middle-market companies.
New startups that need to borrow money to develop their business are willing to pay a higher interest rate to
get capital. Pacwest is committed to the entrepreneurial and venture communities; they offer their clients a
wide array of products, giving them assistance through all stages of their growth. Other banks focus more on
consumers or on house mortgages and that is why their spreads are lower than Pacwest. This niche market is
expanded upon due to the majority of start-up companies being based out of California. Even though this
kind of lending is more risky than lending to individuals, the default risk has been decreasing. It is as of
right now less than 1% while the Industry is 2%.
Revenue Breakdown: Through its diversification in the financial industry, Pacwest produces revenue from
different segments, Interest Income and Noninterest Income. (% of all revenue):
Interest Income (92%)
 Net Interest Income (91%): Real Estate Mortgage (47%), Real Estate Construction and Loan (3%),
Commercial Loans (50%), Consumer Loan (1%)
 Investment (8%): Municipal Securities (46%), Government Agency enterprise pass through securities
(25%), Government Agency enterprise collateralized mortgages obligations (16%)
 Interest Earnings Assets (1%): These are deposits in financial institutions, mostly cash held at the
Federal Reserve Bank of San Francisco.
Non-Interest Income (8%): It includes service charges on deposits accounts, commissions and fees, leased
equipment income and dividends realized on equity investment.
The collateral for real estate loan includes healthcare properties (9%), office properties (20%), multifamily
properties (7%), hospitality properties (5%) and retail properties (3%). Commercial loan products, available
Exhibit 5: Revenue Breakdown
Source: Yahoo! Finance
Source: Bloomberg
Source: 10-Q
0%
20%
40%
60%
80%
100%
Real Estate Mortgage
Commercial
Investment
Non-Interest
0.0%
2.0%
4.0%
10 11 12 13 14 15
PACWEST (<1%)
Industry (2%)
Source: Bloomberg
11/15/15
Gonzalo Arroyo-Baudet
Stetson University Student Research
3
Exhibit 6: Profit Margin
Exhibit 5: Quarterly Segment Revenue
Breakdown
Exhibit 6: Assets Growth %
on a nationwide basis, include equipment loans and leases (8%), asset based loans (15%), loans for financial
companies (3%) and loans secured by borrower future cash flows (22%).
As a result of the CapitalSource Inc. merger in 2014, Pacific Western Bank established the CapitalSource
Division, which we also refer to as the National Lending segment (72%). The other segment is called
Community Banking (28%); it includes the operations of Pacific Western Bank, excluding Capital Source
Division, and it includes lending and deposit gathering activities. The CapitalSource Division lends
throughout the United States, providing middle-market businesses asset-secured loans, equipment-secured
loans and leases, cash flow loans, and real estate loans secured by various property types. The Bank's
leasing operation, Pacific Western Equipment Finance, and its group specializing in asset-based lending,
CapitalSource Business Finance Group, are part of the CapitalSource Division. The CapitalSource
Division’s loan and lease origination efforts are conducted through key offices located in Chevy Chase,
Maryland; Los Angeles and San Jose, California; St. Louis, Missouri; Denver, Colorado; Chicago, Illinois;
New York, New York; and Midvale, Utah.
Pacwest revenue breakdown for their segments have been stable even they have been acquiring other
financial institutions in the last years. Revenue comes from interest income and noninterest income.
Historically, they always have strong net interest margins due to high average loan and lease balances.
Growth Strategies: Pacwest has four main growth strategies:
 Niche Lending Focus: They have a good market position in key business segments, including its
national commercial lending platform to middle-market companies. They lend money to small and
mid-business that need adventure capital. In California there are thousands of new companies with
a lot of potential that need financial help to continue their growth. Pacwest is committed to the
entrepreneurial and venture communities; they offer their clients a wide array of products, giving
them assistance through all stages of their growth. Even though this kind of lending is more risky
than lending to individuals, the default risk has been decreasing. They do a really good job in
selecting their commercial lending customers.
 Acquisition strategies: Pacwest specializes in acquiring banks. They have completed 27
acquisitions since 2000, including the last purchase of “Square 1 Financial” 1 week ago. This will
help them to improve its funding profile by reducing the firm's reliance on higher-cost CDs and
diversifies the loan portfolio into complementary businesses and contributes additional sources of
fee income. Last year’s purchase of CapitalSource Bank made Pacwest Bancorp grow mainly
nationwide with a full spectrum of middle-market lending.
 Net Interests Rate Spread: The primary interest‑earning assets are loans and investment
securities, and the primary interest‑bearing liabilities are deposits. A high yield in interest
earnings and a competitive cost of deposits contribute to the high net interest margin. While an
average bank has a 3-3.5% on net interest margins, Pacwest achieves quarter after quarter a
5.5%.This is a key determinant of a financial institution's profitability.
 Core Deposit Growth: While the deposit balances will fluctuate depending on deposit holders’
perceptions of alternative yields available in the market, Pacwest seeks to minimize these
variances by attracting a high percentage of noninterest‑bearing deposits. As an industrial loan
bank, the former CSB (2014 acquisition) funded its balance sheet with a large proportion of
higher-cost time deposits and as a result of the CapitalSource Inc. merger, they added $5.3 billion
of time deposits. The goal is to continue replacing these higher-costing time deposits with core
deposits through a dedicated deposit transformation initiative that includes sourcing deposits from
CapitalSource Division borrowers. As of June 30, 2015, total deposits obtained from
CapitalSource Division borrowers totaled $455.5 million, of which $441.8 million were core
deposits.
Competitors: Pacwest is a regional bank based in California that is increasing their operation nationwide.
Thus, it most comparable competitors are City National Bank and East West Bank, which are based in
California and are also focused on services to small to mid-sized businesses. Another competitor is Western
Alliance Bank that offers different financial services in Arizona, Nevada and California. Of course, Pacwest
also has other well-known large competitors, like Bank of America, Wells Fargo and JP Morgan. However,
these popular federal banks are too big to be compared with any regional Bank.
Source: Bloomberg
Source: Bloomberg
Source: Reuters
-10%
0%
10%
20%
30%
10 11 12 13 14 Current
CATY
PACW
11/15/15
Gonzalo Arroyo-Baudet
Stetson University Student Research
4
Exhibit 8: Interest Rate
Exhibit 9: Competitive Analysis
Exhibit 7: Domestic Deposit Market
Share
Source: Bloomberg
Source: Reuters
Source: Bloomberg
Industry and Peer Group Overview
Companies in the regional banking industry provide services such as commercial banking, asset
management, mortgages and loans. Banking companies are more and more putting more emphasis on their
focus on the rapidly changing customer expectations. Also, population growth will increase the relative
numbers of both the oldest and youngest customer segments, which creates challenges for banking
companies. Older customers are normally more loyal, whereas the youthful customers are more likely to
bounce around and are technologically savvy. Banking customers are also becoming more hands on and can
bank at the freedom of their cell phone. So banks like Pacwest who have strong online banking and also
enough advisors to satisfy customers that like to come in, they are positioned greatly.
Under the Riegle-Neal Act of 1994, which most importantly empowered nationally chartered lenders to
operate across state lines, regulators can only approve mergers or acquisitions if the combined
companies' deposits don't exceed 10% of total deposits nationwide. This is a problem for banks like
JPMorgan Chase, Bank of America, and Wells Fargo, all of which have already passed the 10%
threshold. These banks hold 11.1%, 11.3%, and 10.5%, respectively, of total domestic deposits.
This gives smaller banks, like regional, more power to merge with other smaller banks because they
will never reach the 10% threshold.
Rising Interest Rates: The anticipation of rising interest rates is hanging most on the banking and financial
industries. A rising rate environment bodes well for the banking sector. I believe that bank stocks can
continue to outperform in anticipation of a shift in the trajectory of rates. With interest rates higher, banks,
especially regional banks that do a lot of loan origination, should be able to charge more for their products.
They should also be able to pay more interest to their depositors, giving higher incentive to savers. There are
three scenarios for the interest rates and what will happen to the banks when they decide move. Overall, the
banking and financial industries are poised for success looking forward.
Interest Rate Scenarios: Like I said above, a rising interest rate environment bodes well for the baking
sector. There are a couple of different rate scenarios that need to be analyzed for bank stocks. The best
scenario for banks is higher short rates because 71% of the loans are priced off the front end of the curve.
This needs to happen for net interest margins to expand, because banks need short rates to go up more than
long rates. The second scenario is when the long-term rates rise more than the short-term rates. This
scenario would benefit the banking industry, but it wouldn’t bode as well as the first scenario. The worst
scenario for the banking industry would be if rates were to remain low for longer leaving the industry with
few levers to pull to drive earnings.
Competitive Positioning
Pacwest’s business model is relationship focused. They focus on customer acquisition and finding
customers that they can build relationships with. The main strategy of the company is to build up strong
customer relationships while obeying underwriting standards to grow the low-cost deposit base and provide
the high-quality loans, which will help the company achieve the long-term growth and profitability.
Meanwhile, the acquisition is considered as a consistent business strategy of company. The company has
successfully acquired 27 banks since 2000 for increasing its presence in California and earning assets.
The regional banks are attached to the banks group and provide financial services to clients such as loans
and commercial services. The regional banks majorly generate their revenues by providing high quality
loans services and growing the low-cost depository services from the customers in order to increase earning
spreads. The competition in the regional bank sub-industry is highly intensive considering the 4810 players
in the regional-bank market and high presence of national banks as well as international banks. The major
players under the banks group that have high presences in the California are Bank of America (BAC), US
Bancorp (USB), Wells Fargo& Company (WFC), Citigroup (C), City National Corporation (CYN) and
CVB Financial Corp (CVBF) (Exhibit 9).
Regional Focused: The PacWest Bancorp operates their banking business in California area containing 80
full-service communities banking branches. Therefore, Pacific Western Bank is able to provide relatively
high personalized banking services and develop loyal local customers. Also, region-focused banks are
unlikely affected as much as large banks by the fluctuation of foreign currency. The dollar value keeps
going up; many large banks’ foreign asset was shrinking and reduced their net income. However, Pacific
Western Bank only focuses on domestic market, so its operation will take less effect from the increasing
11/15/15
Gonzalo Arroyo-Baudet
Stetson University Student Research
5
Exhibit 10: Net Interest Rate Spread
Exhibit 12: Inflation Rate vs. Banking
Industry Revenue Growth
Source: Reuters
Source: Bloomberg
dollar value. In addition, due to their low (1%) investment in the Oil and Gas industry, they have not been
adversely affected.
Target small and mid-sized Business: Pacific Western Bank provides commercial banking services mainly
to small and mid-sized businesses. Those start-up businesses have limited loan options from Bank of
America and Wells Fargo & CO, because start-ups cannot meet usually large national banks’ high
requirements. However, Pacific Western Bank is willing to offer loans and financial solutions to those set-
up companies and charge higher fees or interest rates to achieve a higher market return. That is why their net
interest rate spread is 5.5% while other banks have a lower rate of around 3%. In addition, Pacific Western
Bank offers unique banking tools to meet customer needs such as credit reports and Intuit Turbo Tax. The
unique banking tool is very attractive to small, medium companies, as in general those small companies
cannot afford such services from professional consulting companies, and allows clients to file and send
taxes online.
Strong Presence in the Local Area: As PacWest Bancorp goes forward with its acquisition strategy, its top
two core business segments are banking and asset financing. Though banking is the largest revenue source
of PacWest Bancorp, asset financing is growing faster than banking in terms of both total assets and
revenue. Along with the merger and acquisition process, PacWest Bancorp became more resource efficiency
and integrity in the banking system, for example compare with 2012, the company overall efficiency
increased by 3 percent. Also, a wide financing segment provides comprehensive customer services. Its
premium banking services and strong presence distinguish themselves from other community banks in
California.
I believe any factor that has a big impact on the whole economy can be a key variable driving the stock
market and financials sector because financial entities are involved in every industry and individuals. There
are four major macroeconomic indicators that will influence the future performance on financial sector.
They are Interest Rates, M2 (Money Supply), inflation, and Real GDP.
Interest Rates: It is an important benchmark of how the economy is doing. It is an effective tool for The
Federal Reserve to keep inflation under control and maintain the economic health of the United States.
Since the daily operations of financial services, especially banks are tied to interest rates, and the interest
rate environment mainly determines the profitability of a financial stock. The effective Federal Funds rate is
one of the key economic variables that have a major impact on the financial sector of stock market. The
following graph shows the historical trend of the Effective Federal Fund Rate from 1954 to 2015 (Exhibit
11). During the financial Crisis of Dec. 2007-2008, the rate decreased dramatically from 5.26%-0.16%. We
are currently at the historical low rate level around 0-0.25%. The FOMC has maintained it that low to fight
the Great Recession of 2008-09 and stimulate the U.S. economy.
Following this trend, the class expects the effective Federal Funds Rate to increase by 1 to 1.25% during the
next 12-18 months. We expect the 10 Year Treasury to be between 2.75 and 3.25% at the end of 2016. The
long-term forecast of interest rate is really dependent on employment rate and inflation rate in the future.
We predict the unemployment will decrease with strong job gains and inflation will increase in a low speed,
which indicates a strengthening economy. We believe that the stronger the economy, the greater the growth
of financial sectors because of the rising demand of capital.
Inflation: As the inflation rate increases, the lending by banks, the quantity of bank assets and the volume
of liabilities issued by banks decrease; the stock return volatility increase. It is very important for financial
institutions to take a deep look at the inflation rate because it has profound influences on its activities. The
following graph shows the inflation rates from year 2005 to year 2015. In recent months, the inflation rates
are at the lowest level since late 2009 and on January and March 2015, there were even deflation of -1
percent due to low energy cost and decline food index. The class expects inflation rate to increase 1.5% in
the next 12-18 months. The Fed sets the objectives of maximum employment and 2 percent inflation. To
support continued progress toward maximum employment and price stability, the Fed will gradually
increase interest rates until the inflation rate gradually reaches to 2 percent.
GDP: Real GDP inflects the health of financial market. Increasing real GDP leads to less default on loans
and debts. Thus, shareholders are more confident on their investment decisions and are willing to invest
more or expand. The following graph shows the historical real GDP growth rate in recent 10 years. We can
see a steeply drop during the 2008 economic crisis, and a strong increase since 2009, since the real GDP
index is strongly correlated with economic development. Following this trend, the class expects that the
Real GDP Growth will increase between 2.5 and 3% in the next 12-18 months. Consumers are energized by
the availability of more jobs and by lower energy prices, which are putting more money into their pockets to
shell out for other goods and services. When consumers spending increases, more and more businesses will
11/15/15
Gonzalo Arroyo-Baudet
Stetson University Student Research
6
Exhibit 10: Revenue Growth Rate
Exhibit 15: Geographical Location
Source: Pacwest Bancorp Website
Exhibit 13: GDP Growth vs. PACW
Stock Return
Source: Bloomberg
Source: Bloomberg
increase investment in new production capacity and the Real GDP will continually increase. The current
steady increase of Real GDP lays a solid foundation and healthy environment for the financial industry and
people have more money to spend, save and invest.
Market Share
Total Domestic Deposit Market Share: As of 2014, three banks accounted for 30% of the entire market
share in terms of total domestic deposits. Bank America controlled 10.9% of the market share with $1.019
trillion total deposits. Wells Fargo was second with $924.1 billion in total deposits accounting for 9.90% of
the market share. And the last biggest company is JPMorgan, which accounted for 9.8% of the market share
with $916.5 billion in total deposits.
Regarding Pacwest, it is the 84th
largest depositary organization in the United States; it has consolidated
assets of approximately $16.7 billion.
Regional Deposit Market Share: PacWest controls PWB, which operates branches only in California.
PWB is the 14th largest insured depository institution in California, controlling approximately $12.0 billion
in deposits, which represent 1.1 percent of the total deposits of insured depository institutions in California.
With the acquisition of Square 1, it approximately added $2.4 billion in deposits. This takeover took place 1
week ago so PacWest has become the 76th largest depository organization in the United States, with $14.4
billion in deposits, which represent less than 1 percent of the total amount of deposits of insured depository
institutions in the United States.
I think with this acquisition and some time, call it 24 months, that PACW becomes a front runner for a
Wells Fargo & Co. (NYSE:WFC) acquisition. Wells Fargo is headquartered in California, could make great
sense of buying PACW's huge California location exposure, consolidating the branches, and realizing an
ungodly amount of synergies. The SQBK division could feed nicely up to Wells' IB or asset management
segments, etc. This is really more a subject for an article a bit later in development, but just know that the
table is being set for this to happen. It just makes too much sense.
Same Store Revenue
Organic Growth: Same store sales are often used as a measure of organic growth. For the last five
years, the average annual revenue growth for the Peer Group was -1%. In contrast, PacWest’s revenue
growth has outpaced the Regional Banks Industry by 7%; the 5 year revenue growth rate is 6%. I am
expecting a steady organic growth of 2 to 3% per quarter in the next 12-18 months.
Geographical Growth: Pacwest is the 11th
biggest bank in terms of market share in the Southwest region.
With the corporate strategy of acquisition, 27 financial companies since 2000, PacWest has been able to
expand to other states like Arizona and Texas. Its last purchase of Square 1 Financials made them also be
the 8th
largest bank in North Carolina. We shouldn’t be surprised by any new acquisition plan announced in
later years. They will definitely become bigger and expand into more states.
Branding Strategy: PacWest is known for supporting startups and providing them with financial services,
at a lower cost, to help them for example fill out their taxes. They also provide with loans to small and mid-
companies that are not able to get a loan from bigger banks. PacWest tries to work out a plan with these
companies to help them finance their business activities. The Pacwest Bancorp distinguishes themselves
from other banks by providing extremely high level customer services and maintaining the competitive
interest rate charged on loans.
Financial Analysis
Acquisition Contributing to Topline Growth: Pacwest Bancorp has successfully acquired 27 banks since
2000. With the continuing expansion of the company, they had a progressive increase in its assets and net
income. Last year they spent 2,237 million dollars in the takeover of CapitalSource which made them
increase by 122%. At the beginning of October they consolidated another acquisition, Square 1 Financial,
for 702 million dollars. Acquisitions since 2008 are worth $3.5 billion and each takeover has add on average
30% income to the total revenue.
Average Rev. Growth
PACW: 6% Industry:-1%
11/15/15
Gonzalo Arroyo-Baudet
Stetson University Student Research
7
Exhibit 16: Core Deposits as Percentage of
Total Deposits
Source: Company 10-Qs
Increase of Core Deposits to Margins Expansion: Pacwest counts on core deposits as a stable source of
funds for their lending base. Core deposits offer many advantages to the bank, such as predictable costs and
a measurement of the degree of customer loyalty. In addition to the advantages mentioned above, core
deposits are less vulnerable to changes in short-term interest rates than CDs or money market accounts.
Core deposits are an important focus for Pacwest in the next year. With the completion of the Square 1
merger, PacWest has a substantially improved core deposit base and a proven platform for generating
profitable loan, deposit and noninterest income growth in the venture capital banking space. Core Deposits
Increased $230.6 Million in the Quarter and Represent 56% of Total Deposits. Net Interest Margin was this
last quarter 5.19%.
The interest rate environment is going to play an important role in how Pacwest grows. By analyzing
Pacwest’s three main segments, I found different growth rates accordingly.
Historically, Wells Fargo’s revenue breakdowns for their operating segments have been stable. The majority
of their revenue, Interest Revenue, has a fairly steady rate of about 90 to 92% (Exhibit 17). This revenue
comes from a higher than industry average net interest margin which has been averaging 5.6% for the last
five quarters while the industry has 3%.
Revenue: Pacwest’s revenues dropped in the last quarter to 208 million dollars; there was a 6% decrease
compared to Q2. Noninterest income decreased by $3.8 million (almost 20%) to $15.8 million for the third
quarter of 2015 compared to $19.6 million for the second quarter of 2015 due mostly to lower realized gains
and dividends on equity investments and lower income recognized as a result of loan and lease
prepayments. Net interest income decreased $10.1 million (6%) to $192.5 million for the third quarter of
2015 compared to $202.6 million for the second quarter of 2015 due to lower discount accretion on acquired
loans and lower FHLB dividends.
However, future quarters look promising in terms of revenue due to the acquisition of Square 1 Financials.
This growth along with the upcoming interest rate increases show that Pacwest is in a great position to keep
increasing their revenues and beat there 2015 numbers in 2016. In the last 5 years they have an average
revenue growth of 6%. They have continued to improve their quality of assets and have decreased their
nonperforming assets. Their net charge offs have stayed pretty stable which is a good indication considering
they have more exposure because of their increased accounts, deposits, and loans. With interest rates
expected to rise, Pacwest is in great position to continue to increase its profit margins by steadily increasing
its revenues and decreasing its costs. Pacwest makes their revenue mostly from Real Estate Mortgage
(47%), Real Estate Construction and Loan (3%), Commercial Loans (50%), Consumer Loan (1%) . Of
course it has also been profiting off of the rising real estate market through their increase in mortgage loans
and hopefully this sector will continue to grow and continue to increase their revenue as a result.
The main factor that is going to increase revenue in the last quarter of 2015 is the takeover of a Bank from
North Carolina. According to my pro forma, I expect revenue to increase by 22% in Q4 2015. As a banking
holding company, its growth of revenue is driven by its growth of assets. I decomposed the revenue into 2
parts: interest revenue and non-interest revenue. Interest revenue is driven by the interest-bearing assets
such as loans. Once I figured out the average interest income rate on each of interest-bearing assets, I could
combine my estimates on key economic variables and make a reasonable assumption. Using the estimated
interest income rate, I multiplied the corresponding driven asset; and I got the revenue earned from that
asset in the specific year.
Gross Profit: Pacwest has been working hard to be the most efficient and they had great results in the last
year. Their gross profit increased from averaging 30% in the past years to averaging 50% in the last 5
11/15/15
Gonzalo Arroyo-Baudet
Stetson University Student Research
8
Exhibit 18: Gross Profit %
Source: Reuters
quarters. PACW has two main categories they separate their revenues into: net interest income and
noninterest income. Net interest income accounts for 92% of the revenue and noninterest income accounts
for 8%. Net interest income is driven by growth in earning assets, and PCI accretion. Some different
services that drive the net interest income are short-term investments and fed funds, mortgages and loan
sales and investment securities. The greatest drive will be the earning assets for next quarter due to the
acquisition. Noninterest income, on the other hand, is a combination of many different categories. Their
greatest driver is service charges on deposit accounts and commissions fees. By increasing their customer
growth, this will eventually lead to higher gross profits. PACW pays high advisory and commission fees
because of their business strategy. They want to be very personal and by doing this have a high supply of
advisors. PacWest is better positioned with increasing interest rates to increase their profit margin in the
next coming years.
Organic Growth vs. Acquisition Growth
My valuation models are based on the estimated organic growth only unless there is a verified acquisition plan
in the future. For example, On March 2015, Pacwest announced its acquisition of Square 1 Financial, Inc,
which was completed October 8th
. I indicated this acquisition on my estimated Quarter 4 of 2015 Pro Forma
revenue and expenses. It will improve PACW's funding profile by reducing the firm's reliance on higher-cost
CDs and diversifies the loan portfolio into complementary businesses and contributes additional sources of fee
income. Other than that, I just used the estimated organic growth from my analysis of the whole economy,
industry, and the company performance in next years. I was pretty conservative; did not take account of any
unpredictable future acquisition plans in my valuation. Organic loan growth of 14% is high relative to peer
averages of between 8% and 10%. This means, Pacwest is in a pretty good situation considering the main
feature that makes a bank gain money, loans.
Margin Expansions
Profit Margin Improvement: Pacwest’s profit margins are fairly cyclical and they also correlate
with interest rates. Pacwest’s profit margins have steadily increased since the financial collapse and
all 27 acquisitions since 2000 helped has helped their margins by increasing their economy of scale.
Profit Margin: Pacwest has the highest profit margins among the big four banks in the United
States. Its profit margin has been steady at around 30-33%% in the last 5 quarters, yet with interest
rates about to rise I believe this will only increase this margin. I believe this because there is a strong
correlation between interest rates and Pacwest’s profit margin. This is expected because higher
interest rates allow Pacwest to increase their net interest margins which increases their revenues at no
cost to the company. PACW has a profit margin exceeding its competitors (the industry average is
right now at 19%); it shows that they are more profitable company and that they have better control
over its cost compared to its competitors.
11/15/15
Gonzalo Arroyo-Baudet
Stetson University Student Research
9
Exhibit 19: Return on Equity
Exhibit 20: Book Value of Equity
Growth
Source: Reuters
Source: Reuters
Earnings
PACW’s earnings grew a lot since they bought Capital1 5 quarters ago. Its EPS growth in the last
year was 121%. This shows how much they grow when they acquire other companies. As I said
before, they just acquired Capital Source which will make Earnings continue to grow. This growth is
also due to the stronger economic environment and the soon to be rising interest rates. Despite the
low interest rate environment, revenue and pre-tax pre-provision profit increased year over year, and
they continued to operate within their target ranges for ROA, ROE, and efficiency ratio. Looking
forward, the company and my calculations expect the company to continue to grow in areas such as
commercial real estate, international commercial loans, investment banking and credit card and
thrive in 2016
Pro Forma: For my pro forma analysis of WFC, I found that they should expect to see an increase in
revenues and net profit the last quarter of 2015 due to the acquisition of Square Financial 1. For 2016 I
expect them to have organic growth. Thus, I analyzed their segmented revenues and ran regression
analysis on these segmented revenue trends with economic factors like GDP, inflation rates, and
change in interest rates. Through these regressions I found that Pacwest’s main segment, which is
interest income from commercial lending, correlates with interest rates and change in interest rates.
Using these correlations along with their historical growth rates and information gained from their
quarterly and annual statements I projected Pacwest’s income statement until 2017. With these factors
I expect that we will see revenues increase to $254.5 million in Quarter 4 of 2015 and net income to
increase to $85.5 million. I expect earnings per share to increase to $0.71.Apart from the acquisition,
most of this economic growth is the result of a stronger economic outlook for 2016 and the highly
probable increases in interest rates.
Return on Equity
Pacwest return on equity was 9.81 percent in 2015. This 9.81 percent is the profit expressed as a
percentage of its shareholder value. It has a much higher ROE than the industry average of 8.25
percent. It is clear that Pacwest’s positive ROE is a result of their high net income and sales as well as
the industries. Also, Pacwest’s efficiency ratio was 40.6 percent, which means their inventory turnover
is strong as well.
Cash Flow
Free Cash Flow: A more pertinent way to measure the company’s cash flow is their free cash flow.
This is how much operating cash flow remains after capital expenditures. This last querter Pacwest
had a free cash flow of $150 million. This is good considering they acquired Wachovia in 2014, which
used some of their free cash flow. Yet this measurement saw a lot of volatility due to the constant
takeovers of financial institutions.
Debt
Debt to Equity: Currently, Pacwest has long term debt of $987.9 million compared to CATY’s long
term debt of $1014 million. Pacwest debt to equity ratio is 27.58, which is lower than the regional
bank’s industry which is 80.25. This is a good sign showing that they are more selective with their
debt contracts and value their equity higher. PACW is also better of regarding the debt to assets ratio;
it is 5.88 while the industry has 9.5.
Total Debt to EBITDA: More importantly, it is crucial to compare WFC’s debt-to-EBTIDA ratio
because is displays the amount of time for each company to pay off their debt. Currently WFC’s ratio
is 6.34, compared to JPM’s ratio of 25.66. The debt to EBITDA ratio suggests that WFC has a better
likelihood of paying off their debts thereby reducing the default risk for investors.
Valuations
In this section, we estimate the fair values of Pacwest’s stock. It should be noted that all input data
were derived from historical company data and pro forma estimates.
Price to Book Valuation Model: The Price to Book Ratio formula, sometimes referred to as the
market to book ratio, is used to compare a company's net assets available to common shareholders
relative to the sale price of its stock. The calculated fair value is $51, which is an undervaluation of
11/15/15
Gonzalo Arroyo-Baudet
Stetson University Student Research
10
9%.
Residual Income Model: This model values securities using the company’s current book value per
share and the present value of expected future residual income. The calculations can be seen in the
Appendix 3. Using the estimated BPS growth rate of 7.95% for the next year, the model shows that the
fair value price per share is $57.5, making this security undervalued by 22%. This model values
securities using a combination of a company’s current book value per share and the present value of
expected future residual income.
Average Fair Value: Pacwest is currently trading at $47, and based on the average fair value from the
valuations results in an average fair value price of $54, meaning they are undervalued by 15%.
Investment Risk
Financial Institutions: Pacwest’s business and earnings are sensitive to economic and general
business conditions. Upside and downside risks that can affect my price target on Pacwest include
sustainability of pre-provision profit, ability to continue to grow revenues, higher than expected credit
losses, sharper volatility in markets related revenues, and political/regulatory changes impacting
consumer banking and mortgage business. As a financial institution, Pacwest will be forced to hold
substantially more capital than other companies, which could depress returns. They could use that
capital for other investments.
Risky Takeovers: While acquisitions are usually positive for the buying company, it is really risky.
Pacwest has acquired 27 financial institutions since 2000, they average more than 1 acquisition per
year. This makes Pacwest be riskier due to the great amount of money they invest in other companies.
Macroeconomic Environment: The macroeconomic environment is also a risk that we must take into
account. The macroeconomic environment could increase the credit risks. Credit risks are influenced
by the macroeconomic environment, the higher the anticipated credit risk, the higher the rate of
interest that investors will demand for lending their capital. Also, an extended period of deleveraging
combined with low interest rates could dramatically reduce profitability.
Interest Margins: Interest margins are anticipated to keep decreasing until the Federal Reserve raises
interest rates. This is a risk because if interest rates do not rise within the next few quarters then
Pacwest will see lower revenue and profit margin growth than I have predicted. However, I really
think interests will rise in the next quarters.
11/15/15
Gonzalo Arroyo-Baudet
Stetson University Student Research
11
Table of Contents
Appendix 1: Income Statement 12
Appendix 2: Balance Sheet 13
Appendix 3: Statement of Cash Flow 14
Appendix 4: Pro Forma Income Statement 15
Appendix 5: Pro Forma Balance Sheet 16
Appendix 6: Price to Book Value Valuation Model 17
Appendix 7: Residual Income Valuation Model
11/15/15
Gonzalo Arroyo-Baudet
Stetson University Student Research
12
Appendix 1: Income Statement
Source: Yahoo Finance
11/15/15
Gonzalo Arroyo-Baudet
Stetson University Student Research
13
Appendix 2: Balance Sheet
Source: Yahoo Finance
11/15/15
Gonzalo Arroyo-Baudet
Stetson University Student Research
14
Appendix 3: Statement of Cash Flow
Source: Yahoo Finance
11/15/15
Gonzalo Arroyo-Baudet
Stetson University Student Research
15
Appendix 4: Pro Forma Income Statement
Source: Thomson Reuters and Personal Estimates
11/15/15
Gonzalo Arroyo-Baudet
Stetson University Student Research
16
Appendix 4: Pro Forma Balance Sheet
11/15/15
Gonzalo Arroyo-Baudet
Stetson University Student Research
17
Appendix 5: Price to Book Valuation Model
Source: Thomson Reuters and Personal Estimates
Appendix 6: Residual Income Valuation Model
Fair Value: $57.5
Undervalued by 21%
Source: Thomson Reuters and Personal Estimates
11/15/15
Gonzalo Arroyo-Baudet
Stetson University Student Research
18
11/15/15
Gonzalo Arroyo-Baudet
Stetson University Student Research
19
Sources:
Baseline
Bloomberg
Reuters
UNECE
CNBC
Morningstar
Yahoo Finance
Business Insider
Pacwest 10-Q
Pacwest 10-K
Pacwest Announcements
Pacwest Transcripts
Pacwest Conference Calls
Disclosures:
Ownership and material conflicts of interest:
The author(s), or a member of their household, of this report does not hold a financial interest in the securities of this company.
The author(s), or a member of their household, of this report does not know of the existence of any conflicts of interest that might
bias the content or publication of this report.
Receipt of compensation:
Compensation of the author(s) of this report is not based on investment banking revenue.
Position as a officer or director:
The author(s), or a member of their household, does not serve as an officer, director or advisory board member of the subject company.
Market making:
The author(s) does not act as a market maker in the subject company’s securities.
Disclaimer:
The information set forth herein has been obtained or derived from sources generally available to the public and believed by the author(s)
to be reliable, but the author(s) does not make any representation or warranty, express or implied, as to its accuracy or completeness. The
information is not intended to be used as the basis of any investment decisions by any person or entity. This information does not constitute
investment advice, nor is it an offer or a solicitation of an offer to buy or sell any security. This report should not be considered to be a
recommendation by any individual affiliated with CFA Society of Orlando, CFA Institute or the CFA Institute Research Challenge with
regard to this company’s stock.

More Related Content

What's hot

Banking industry overview 2016
Banking industry overview 2016Banking industry overview 2016
Banking industry overview 2016
Peter Armand
 
Trade finance
Trade financeTrade finance
Trade finance
Bipul Kar
 
From Complexity To Client Centricity
From Complexity To Client CentricityFrom Complexity To Client Centricity
From Complexity To Client Centricity
hubert_laird
 
Banking Powerpoint Presentation Slides
Banking Powerpoint Presentation SlidesBanking Powerpoint Presentation Slides
Banking Powerpoint Presentation Slides
SlideTeam
 
EY-Banking-in-emerging-markets-Investing-for-success
EY-Banking-in-emerging-markets-Investing-for-successEY-Banking-in-emerging-markets-Investing-for-success
EY-Banking-in-emerging-markets-Investing-for-successKarl Meekings
 
Vy Le_ J.P.Morgan Stock Valuation Project
Vy Le_ J.P.Morgan Stock Valuation ProjectVy Le_ J.P.Morgan Stock Valuation Project
Vy Le_ J.P.Morgan Stock Valuation ProjectVy Le
 
Sme Financing International Best Practices
Sme Financing International Best PracticesSme Financing International Best Practices
Sme Financing International Best Practicesguest76ed2bc
 
Ernst & Young Asia-Pacific - Private Equity-Outlook-2014
Ernst & Young Asia-Pacific - Private Equity-Outlook-2014Ernst & Young Asia-Pacific - Private Equity-Outlook-2014
Ernst & Young Asia-Pacific - Private Equity-Outlook-2014
CAR FOR YOU
 
2017-01-25 A Framework for Strengthening Your Nonprofit’s Investment Reserve ...
2017-01-25 A Framework for Strengthening Your Nonprofit’s Investment Reserve ...2017-01-25 A Framework for Strengthening Your Nonprofit’s Investment Reserve ...
2017-01-25 A Framework for Strengthening Your Nonprofit’s Investment Reserve ...
Raffa Learning Community
 
2016-10-27 A Framework for Strengthening Your Nonprofits Investment Reserve P...
2016-10-27 A Framework for Strengthening Your Nonprofits Investment Reserve P...2016-10-27 A Framework for Strengthening Your Nonprofits Investment Reserve P...
2016-10-27 A Framework for Strengthening Your Nonprofits Investment Reserve P...
Raffa Learning Community
 
2016-09-13 How to Develop - Improve Your Nonprofit’s Investment Policy
2016-09-13 How to Develop - Improve Your Nonprofit’s Investment Policy2016-09-13 How to Develop - Improve Your Nonprofit’s Investment Policy
2016-09-13 How to Develop - Improve Your Nonprofit’s Investment Policy
Raffa Learning Community
 
2017 CFO Sentiment Study Executive Summary
2017 CFO Sentiment Study Executive Summary2017 CFO Sentiment Study Executive Summary
2017 CFO Sentiment Study Executive Summary
The CFO Alliance
 
Why MSMEs need extra support for Trade Finance
Why MSMEs need extra support for Trade FinanceWhy MSMEs need extra support for Trade Finance
Why MSMEs need extra support for Trade Finance
Isaac Tudu
 
PE Capital Briefing February 2017 FINAL
PE Capital Briefing February 2017 FINALPE Capital Briefing February 2017 FINAL
PE Capital Briefing February 2017 FINALPeter Witte
 
Impact of Financial Knowledge of Investors Investment Making Decisions
Impact of Financial Knowledge of Investors Investment Making DecisionsImpact of Financial Knowledge of Investors Investment Making Decisions
Impact of Financial Knowledge of Investors Investment Making Decisions
ijtsrd
 
Joanna charles access to finance world bank ja 2012
Joanna charles access to finance world bank ja 2012Joanna charles access to finance world bank ja 2012
Joanna charles access to finance world bank ja 2012cgrowth
 
Banking's Biggest Hurdle
Banking's Biggest HurdleBanking's Biggest Hurdle
Banking's Biggest Hurdle
Strategy&, a member of the PwC network
 
Finance as a driver and constraint on different types of growth - Stuart Fras...
Finance as a driver and constraint on different types of growth - Stuart Fras...Finance as a driver and constraint on different types of growth - Stuart Fras...
Finance as a driver and constraint on different types of growth - Stuart Fras...enterpriseresearchcentre
 
Outlook asia pacific_banks_2011
Outlook asia pacific_banks_2011Outlook asia pacific_banks_2011
Outlook asia pacific_banks_2011
Warlito Vicente
 
Pertemuan 12 monetary policy in islamic
Pertemuan 12 monetary policy in islamicPertemuan 12 monetary policy in islamic
Pertemuan 12 monetary policy in islamic
Center For Economic Policy Institute (CEPAT)
 

What's hot (20)

Banking industry overview 2016
Banking industry overview 2016Banking industry overview 2016
Banking industry overview 2016
 
Trade finance
Trade financeTrade finance
Trade finance
 
From Complexity To Client Centricity
From Complexity To Client CentricityFrom Complexity To Client Centricity
From Complexity To Client Centricity
 
Banking Powerpoint Presentation Slides
Banking Powerpoint Presentation SlidesBanking Powerpoint Presentation Slides
Banking Powerpoint Presentation Slides
 
EY-Banking-in-emerging-markets-Investing-for-success
EY-Banking-in-emerging-markets-Investing-for-successEY-Banking-in-emerging-markets-Investing-for-success
EY-Banking-in-emerging-markets-Investing-for-success
 
Vy Le_ J.P.Morgan Stock Valuation Project
Vy Le_ J.P.Morgan Stock Valuation ProjectVy Le_ J.P.Morgan Stock Valuation Project
Vy Le_ J.P.Morgan Stock Valuation Project
 
Sme Financing International Best Practices
Sme Financing International Best PracticesSme Financing International Best Practices
Sme Financing International Best Practices
 
Ernst & Young Asia-Pacific - Private Equity-Outlook-2014
Ernst & Young Asia-Pacific - Private Equity-Outlook-2014Ernst & Young Asia-Pacific - Private Equity-Outlook-2014
Ernst & Young Asia-Pacific - Private Equity-Outlook-2014
 
2017-01-25 A Framework for Strengthening Your Nonprofit’s Investment Reserve ...
2017-01-25 A Framework for Strengthening Your Nonprofit’s Investment Reserve ...2017-01-25 A Framework for Strengthening Your Nonprofit’s Investment Reserve ...
2017-01-25 A Framework for Strengthening Your Nonprofit’s Investment Reserve ...
 
2016-10-27 A Framework for Strengthening Your Nonprofits Investment Reserve P...
2016-10-27 A Framework for Strengthening Your Nonprofits Investment Reserve P...2016-10-27 A Framework for Strengthening Your Nonprofits Investment Reserve P...
2016-10-27 A Framework for Strengthening Your Nonprofits Investment Reserve P...
 
2016-09-13 How to Develop - Improve Your Nonprofit’s Investment Policy
2016-09-13 How to Develop - Improve Your Nonprofit’s Investment Policy2016-09-13 How to Develop - Improve Your Nonprofit’s Investment Policy
2016-09-13 How to Develop - Improve Your Nonprofit’s Investment Policy
 
2017 CFO Sentiment Study Executive Summary
2017 CFO Sentiment Study Executive Summary2017 CFO Sentiment Study Executive Summary
2017 CFO Sentiment Study Executive Summary
 
Why MSMEs need extra support for Trade Finance
Why MSMEs need extra support for Trade FinanceWhy MSMEs need extra support for Trade Finance
Why MSMEs need extra support for Trade Finance
 
PE Capital Briefing February 2017 FINAL
PE Capital Briefing February 2017 FINALPE Capital Briefing February 2017 FINAL
PE Capital Briefing February 2017 FINAL
 
Impact of Financial Knowledge of Investors Investment Making Decisions
Impact of Financial Knowledge of Investors Investment Making DecisionsImpact of Financial Knowledge of Investors Investment Making Decisions
Impact of Financial Knowledge of Investors Investment Making Decisions
 
Joanna charles access to finance world bank ja 2012
Joanna charles access to finance world bank ja 2012Joanna charles access to finance world bank ja 2012
Joanna charles access to finance world bank ja 2012
 
Banking's Biggest Hurdle
Banking's Biggest HurdleBanking's Biggest Hurdle
Banking's Biggest Hurdle
 
Finance as a driver and constraint on different types of growth - Stuart Fras...
Finance as a driver and constraint on different types of growth - Stuart Fras...Finance as a driver and constraint on different types of growth - Stuart Fras...
Finance as a driver and constraint on different types of growth - Stuart Fras...
 
Outlook asia pacific_banks_2011
Outlook asia pacific_banks_2011Outlook asia pacific_banks_2011
Outlook asia pacific_banks_2011
 
Pertemuan 12 monetary policy in islamic
Pertemuan 12 monetary policy in islamicPertemuan 12 monetary policy in islamic
Pertemuan 12 monetary policy in islamic
 

Viewers also liked

La tecnología
La tecnologíaLa tecnología
La tecnología
Maryorii A. Moreno
 
Proyecto participativo de aula
Proyecto participativo de aulaProyecto participativo de aula
Proyecto participativo de aula
Asucion
 
depresion
depresiondepresion
Danièle l. mac millan building long-lasting relationships leading to growth
Danièle l. mac millan   building long-lasting relationships leading to growthDanièle l. mac millan   building long-lasting relationships leading to growth
Danièle l. mac millan building long-lasting relationships leading to growthDaniele MacMillan, BA,CREA
 
Effective communications ppp
Effective communications pppEffective communications ppp
Effective communications ppp
Kim Novak
 
Diapositivas uladech
Diapositivas uladechDiapositivas uladech
Diapositivas uladech
Yonely Vásquez Baylón
 
Scofield Assessment Recommendations
Scofield Assessment RecommendationsScofield Assessment Recommendations
Scofield Assessment RecommendationsBrad Ferrier
 
IBM CDS Overview
IBM CDS OverviewIBM CDS Overview
IBM CDS OverviewJean Tan
 
Mmorpg ganz
Mmorpg ganzMmorpg ganz
Mmorpg ganz
kingzahlcrosga1988
 
Revolução Russa - 1917 (História geral) #Parte1
Revolução Russa - 1917 (História geral) #Parte1Revolução Russa - 1917 (História geral) #Parte1
Revolução Russa - 1917 (História geral) #Parte1
Matheus Alves
 

Viewers also liked (14)

La tecnología
La tecnologíaLa tecnología
La tecnología
 
WaterWar
WaterWarWaterWar
WaterWar
 
Proyecto participativo de aula
Proyecto participativo de aulaProyecto participativo de aula
Proyecto participativo de aula
 
The GSCTF Brand presentation 2
The GSCTF Brand presentation 2 The GSCTF Brand presentation 2
The GSCTF Brand presentation 2
 
depresion
depresiondepresion
depresion
 
Danièle l. mac millan building long-lasting relationships leading to growth
Danièle l. mac millan   building long-lasting relationships leading to growthDanièle l. mac millan   building long-lasting relationships leading to growth
Danièle l. mac millan building long-lasting relationships leading to growth
 
Effective communications ppp
Effective communications pppEffective communications ppp
Effective communications ppp
 
Diapositivas uladech
Diapositivas uladechDiapositivas uladech
Diapositivas uladech
 
Travel Study Oaxaca Paper
Travel Study Oaxaca PaperTravel Study Oaxaca Paper
Travel Study Oaxaca Paper
 
Scofield Assessment Recommendations
Scofield Assessment RecommendationsScofield Assessment Recommendations
Scofield Assessment Recommendations
 
IBM CDS Overview
IBM CDS OverviewIBM CDS Overview
IBM CDS Overview
 
re1s
re1sre1s
re1s
 
Mmorpg ganz
Mmorpg ganzMmorpg ganz
Mmorpg ganz
 
Revolução Russa - 1917 (História geral) #Parte1
Revolução Russa - 1917 (História geral) #Parte1Revolução Russa - 1917 (História geral) #Parte1
Revolução Russa - 1917 (História geral) #Parte1
 

Similar to PacWest,Arroyo-Gonzalo

2014Liquidity-FINAL
2014Liquidity-FINAL2014Liquidity-FINAL
2014Liquidity-FINALKevin Roth
 
Banking-in-emerging-markets-seizing-opportunities-overcoming-challenges
Banking-in-emerging-markets-seizing-opportunities-overcoming-challengesBanking-in-emerging-markets-seizing-opportunities-overcoming-challenges
Banking-in-emerging-markets-seizing-opportunities-overcoming-challengesKarl Meekings
 
The Lead Left Quarterly Capital Market Report 4Q 2015
The Lead Left Quarterly Capital Market Report 4Q 2015The Lead Left Quarterly Capital Market Report 4Q 2015
The Lead Left Quarterly Capital Market Report 4Q 2015
The Lead Left
 
Customer financing in Brazil
Customer financing in BrazilCustomer financing in Brazil
Customer financing in Brazil
Fredrik Boëthius
 
Pepperdine Private Capital Markets Executive Summary Winter 2011
Pepperdine Private Capital Markets Executive Summary Winter 2011Pepperdine Private Capital Markets Executive Summary Winter 2011
Pepperdine Private Capital Markets Executive Summary Winter 2011
Pepperdine University Graziadio School of Business and Management
 
Global Operations of Bank of America, March 2011
Global Operations of Bank of America, March 2011Global Operations of Bank of America, March 2011
Global Operations of Bank of America, March 2011
Washington State Parks & Recreation Commission
 
ExtraFunds Investment Deck
ExtraFunds Investment DeckExtraFunds Investment Deck
ExtraFunds Investment Deck
Aaron Bishop
 
Pepperdine Private Capital Markets Project 7.28.09 R1
Pepperdine Private Capital Markets Project 7.28.09 R1Pepperdine Private Capital Markets Project 7.28.09 R1
Pepperdine Private Capital Markets Project 7.28.09 R1
Pepperdine University Graziadio School of Business and Management
 
Finance And Business Planning
Finance And Business PlanningFinance And Business Planning
Finance And Business PlanningOlesea FORTUNA
 
Finance And Business Planning
Finance And Business PlanningFinance And Business Planning
Finance And Business PlanningOlesea FORTUNA
 
BOA Credit Research (Financial Institutions) 2016
BOA Credit Research (Financial Institutions) 2016BOA Credit Research (Financial Institutions) 2016
BOA Credit Research (Financial Institutions) 2016Pawan Talreja
 
KeyHouse Analytics opening in March 2018
KeyHouse Analytics opening in March 2018KeyHouse Analytics opening in March 2018
KeyHouse Analytics opening in March 2018
Kip Schoonover
 
Day 2, Session 1, Part 2: Unlocking Agricultural Growth through Technology an...
Day 2, Session 1, Part 2: Unlocking Agricultural Growth through Technology an...Day 2, Session 1, Part 2: Unlocking Agricultural Growth through Technology an...
Day 2, Session 1, Part 2: Unlocking Agricultural Growth through Technology an...
IFPRI-NSSP
 
AUBN report 03 28 16
AUBN report 03 28 16AUBN report 03 28 16
AUBN report 03 28 16
Andrea Casati
 
Pyatt Broadmark Real Estate Fund I Presentation Oct 2015
Pyatt Broadmark Real Estate Fund I Presentation Oct 2015Pyatt Broadmark Real Estate Fund I Presentation Oct 2015
Pyatt Broadmark Real Estate Fund I Presentation Oct 2015
Alan Chu
 
JPMorgan Chase 2007 Complete Annual Report
JPMorgan Chase  2007 Complete Annual ReportJPMorgan Chase  2007 Complete Annual Report
JPMorgan Chase 2007 Complete Annual Reportfinance2
 
Come Together
Come TogetherCome Together
Fund I Presentation
Fund I PresentationFund I Presentation
Fund I Presentation
Alan Chu
 
Funding growth september 2011
Funding growth september 2011Funding growth september 2011
Funding growth september 2011
Craig West
 

Similar to PacWest,Arroyo-Gonzalo (20)

2014Liquidity-FINAL
2014Liquidity-FINAL2014Liquidity-FINAL
2014Liquidity-FINAL
 
Banking-in-emerging-markets-seizing-opportunities-overcoming-challenges
Banking-in-emerging-markets-seizing-opportunities-overcoming-challengesBanking-in-emerging-markets-seizing-opportunities-overcoming-challenges
Banking-in-emerging-markets-seizing-opportunities-overcoming-challenges
 
The Lead Left Quarterly Capital Market Report 4Q 2015
The Lead Left Quarterly Capital Market Report 4Q 2015The Lead Left Quarterly Capital Market Report 4Q 2015
The Lead Left Quarterly Capital Market Report 4Q 2015
 
Customer financing in Brazil
Customer financing in BrazilCustomer financing in Brazil
Customer financing in Brazil
 
Pepperdine Private Capital Markets Executive Summary Winter 2011
Pepperdine Private Capital Markets Executive Summary Winter 2011Pepperdine Private Capital Markets Executive Summary Winter 2011
Pepperdine Private Capital Markets Executive Summary Winter 2011
 
Global Operations of Bank of America, March 2011
Global Operations of Bank of America, March 2011Global Operations of Bank of America, March 2011
Global Operations of Bank of America, March 2011
 
ExtraFunds Investment Deck
ExtraFunds Investment DeckExtraFunds Investment Deck
ExtraFunds Investment Deck
 
Pepperdine Private Capital Markets Project 7.28.09 R1
Pepperdine Private Capital Markets Project 7.28.09 R1Pepperdine Private Capital Markets Project 7.28.09 R1
Pepperdine Private Capital Markets Project 7.28.09 R1
 
Finance And Business Planning
Finance And Business PlanningFinance And Business Planning
Finance And Business Planning
 
Finance And Business Planning
Finance And Business PlanningFinance And Business Planning
Finance And Business Planning
 
SLAM brochure Dec 2016
SLAM brochure Dec 2016SLAM brochure Dec 2016
SLAM brochure Dec 2016
 
BOA Credit Research (Financial Institutions) 2016
BOA Credit Research (Financial Institutions) 2016BOA Credit Research (Financial Institutions) 2016
BOA Credit Research (Financial Institutions) 2016
 
KeyHouse Analytics opening in March 2018
KeyHouse Analytics opening in March 2018KeyHouse Analytics opening in March 2018
KeyHouse Analytics opening in March 2018
 
Day 2, Session 1, Part 2: Unlocking Agricultural Growth through Technology an...
Day 2, Session 1, Part 2: Unlocking Agricultural Growth through Technology an...Day 2, Session 1, Part 2: Unlocking Agricultural Growth through Technology an...
Day 2, Session 1, Part 2: Unlocking Agricultural Growth through Technology an...
 
AUBN report 03 28 16
AUBN report 03 28 16AUBN report 03 28 16
AUBN report 03 28 16
 
Pyatt Broadmark Real Estate Fund I Presentation Oct 2015
Pyatt Broadmark Real Estate Fund I Presentation Oct 2015Pyatt Broadmark Real Estate Fund I Presentation Oct 2015
Pyatt Broadmark Real Estate Fund I Presentation Oct 2015
 
JPMorgan Chase 2007 Complete Annual Report
JPMorgan Chase  2007 Complete Annual ReportJPMorgan Chase  2007 Complete Annual Report
JPMorgan Chase 2007 Complete Annual Report
 
Come Together
Come TogetherCome Together
Come Together
 
Fund I Presentation
Fund I PresentationFund I Presentation
Fund I Presentation
 
Funding growth september 2011
Funding growth september 2011Funding growth september 2011
Funding growth september 2011
 

PacWest,Arroyo-Gonzalo

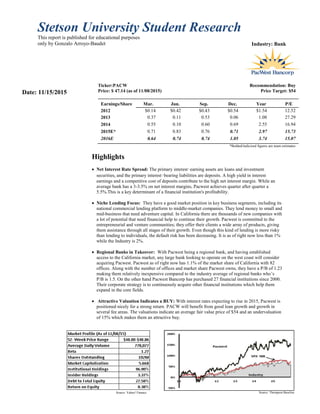
  • 1. Stetson University Student Research This report is published for educational purposes only by Gonzalo Arroyo-Baudet Industry: Bank Ticker:PACW Recommendation: Buy Price: $ 47.14 (as of 11/08/2015) Price Target: $54 Earnings/Share Mar. Jun. Sep. Dec. Year P/E Ratio2012 $0.14 $0.42 $0.43 $0.54 $1.54 12.52 2013 0.37 0.11 0.53 0.06 1.08 27.29 2014 0.55 0.10 0.60 0.69 2.55 16.94 2015E* 0.71 0.83 0.76 0.71 2.97 15.73 2016E 0.64 0.74 0.74 1.05 3.74 15.07 *Bolded/italicized figures are team estimates Highlights  Net Interest Rate Spread: The primary interest‑earning assets are loans and investment securities, and the primary interest‑bearing liabilities are deposits. A high yield in interest earnings and a competitive cost of deposits contribute to the high net interest margin. While an average bank has a 3-3.5% on net interest margins, Pacwest achieves quarter after quarter a 5.5%.This is a key determinant of a financial institution's profitability.  Niche Lending Focus: They have a good market position in key business segments, including its national commercial lending platform to middle-market companies. They lend money to small and mid-business that need adventure capital. In California there are thousands of new companies with a lot of potential that need financial help to continue their growth. Pacwest is committed to the entrepreneurial and venture communities; they offer their clients a wide array of products, giving them assistance through all stages of their growth. Even though this kind of lending is more risky than lending to individuals, the default risk has been decreasing. It is as of right now less than 1% while the Industry is 2%.  Regional Banks in Takeover: With Pacwest being a regional bank, and having established access to the California market, any large bank looking to operate on the west coast will consider acquiring Pacwest. Pacwest as of right now has 1.1% of the market share of California with 82 offices. Along with the number of offices and market share Pacwest owns, they have a P/B of 1.23 making them relatively inexpensive compared to the industry average of regional banks who’s P/B is 1.5. On the other hand Pacwest Bancorp has purchased 27 financial institutions since 2000. Their corporate strategy is to continuously acquire other financial institutions which help them expand in the core fields.  Attractive Valuation Indicates a BUY: With interest rates expecting to rise in 2015, Pacwest is positioned nicely for a strong return. PACW will benefit from good loan growth and growth in several fee areas. The valuations indicate an average fair value price of $54 and an undervaluation of 15% which makes them an attractive buy. Source: Thompson Baseline Date: 11/15/2015 Source: Yahoo! Finance
  • 2. 11/15/15 Gonzalo Arroyo-Baudet Stetson University Student Research 2 Exhibit 1: The Company Exhibit 3: Allowance For Loan Losses Exhibit 4: Venture Capital Investment Top 5 States Business Description Company: PacWest Bancorp is a regional bank that operates through two segments; Pacific Western Bank which include lending and deposit gathering activities and Capital Source which provides small and middle- market businesses loans and leases; it is focused on capital adventure. Pacific Western Bank has 80 offices mainly in southern California and San Francisco. Pacific Western also provides working capital financing to growing companies located throughout the Southwest, in states like Arizona or Texas. Capital Source and Square 1 Bank divisions have offices across United States in cities like Maryland, Denver, Chicago, New York and Midvale (Utah). With its strong presence in California, PacWest Bancorp has become 14th largest commercial bank in U.S. Investment Rationale Pacwest Bancorp. is being recommended as a Buy for the following reasons. Regional Banks in Takeovers: With Pacwest being a regional bank, and having established access to the California market, any large bank looking to operate on the west coast will consider acquiring Pacwest. Pacwest as of right now has 1.1% of the market share of California with 82 offices. Along with the number of offices and market share Pacwest owns, they have a P/E of 15 making them relatively inexpensive compared to the industry average of regional banks who’s P/E is 19. On the other hand Pacwest Bancorp has purchased 27 financial institutions since 2000. Their corporate strategy is to continuously acquire other financial institutions which help them expand in the core fields. Barriers of Entry: The banking industry is really hard to enter in. Some barriers to entry in financial services markets include licensure laws, capital requirements, access to financing, regulatory compliance and security concerns. Between banks there are so many regulations, and in many cases, the costs of compliance and threat of litigation are sufficient to deter firms from entering the market. Another barrier would be the capital requirement; high fixed costs and large sunk costs in the development of financial services make it difficult for new companies to compete with large firms that have scale efficiencies. In the bank industry, you need to be big (have a large amount of clients) to be profitable. Innovative/Niche market: Pacwest has abnormal net interest rate spreads. While banks usually have a spread of 3 to 3.5%, Pacwest achieves every year over 5.5%. This is because their loans and leases are focused on commercial loans. They have a large commercial lending platform to middle-market companies. New startups that need to borrow money to develop their business are willing to pay a higher interest rate to get capital. Pacwest is committed to the entrepreneurial and venture communities; they offer their clients a wide array of products, giving them assistance through all stages of their growth. Other banks focus more on consumers or on house mortgages and that is why their spreads are lower than Pacwest. This niche market is expanded upon due to the majority of start-up companies being based out of California. Even though this kind of lending is more risky than lending to individuals, the default risk has been decreasing. It is as of right now less than 1% while the Industry is 2%. Revenue Breakdown: Through its diversification in the financial industry, Pacwest produces revenue from different segments, Interest Income and Noninterest Income. (% of all revenue): Interest Income (92%)  Net Interest Income (91%): Real Estate Mortgage (47%), Real Estate Construction and Loan (3%), Commercial Loans (50%), Consumer Loan (1%)  Investment (8%): Municipal Securities (46%), Government Agency enterprise pass through securities (25%), Government Agency enterprise collateralized mortgages obligations (16%)  Interest Earnings Assets (1%): These are deposits in financial institutions, mostly cash held at the Federal Reserve Bank of San Francisco. Non-Interest Income (8%): It includes service charges on deposits accounts, commissions and fees, leased equipment income and dividends realized on equity investment. The collateral for real estate loan includes healthcare properties (9%), office properties (20%), multifamily properties (7%), hospitality properties (5%) and retail properties (3%). Commercial loan products, available Exhibit 5: Revenue Breakdown Source: Yahoo! Finance Source: Bloomberg Source: 10-Q 0% 20% 40% 60% 80% 100% Real Estate Mortgage Commercial Investment Non-Interest 0.0% 2.0% 4.0% 10 11 12 13 14 15 PACWEST (<1%) Industry (2%) Source: Bloomberg
  • 3. 11/15/15 Gonzalo Arroyo-Baudet Stetson University Student Research 3 Exhibit 6: Profit Margin Exhibit 5: Quarterly Segment Revenue Breakdown Exhibit 6: Assets Growth % on a nationwide basis, include equipment loans and leases (8%), asset based loans (15%), loans for financial companies (3%) and loans secured by borrower future cash flows (22%). As a result of the CapitalSource Inc. merger in 2014, Pacific Western Bank established the CapitalSource Division, which we also refer to as the National Lending segment (72%). The other segment is called Community Banking (28%); it includes the operations of Pacific Western Bank, excluding Capital Source Division, and it includes lending and deposit gathering activities. The CapitalSource Division lends throughout the United States, providing middle-market businesses asset-secured loans, equipment-secured loans and leases, cash flow loans, and real estate loans secured by various property types. The Bank's leasing operation, Pacific Western Equipment Finance, and its group specializing in asset-based lending, CapitalSource Business Finance Group, are part of the CapitalSource Division. The CapitalSource Division’s loan and lease origination efforts are conducted through key offices located in Chevy Chase, Maryland; Los Angeles and San Jose, California; St. Louis, Missouri; Denver, Colorado; Chicago, Illinois; New York, New York; and Midvale, Utah. Pacwest revenue breakdown for their segments have been stable even they have been acquiring other financial institutions in the last years. Revenue comes from interest income and noninterest income. Historically, they always have strong net interest margins due to high average loan and lease balances. Growth Strategies: Pacwest has four main growth strategies:  Niche Lending Focus: They have a good market position in key business segments, including its national commercial lending platform to middle-market companies. They lend money to small and mid-business that need adventure capital. In California there are thousands of new companies with a lot of potential that need financial help to continue their growth. Pacwest is committed to the entrepreneurial and venture communities; they offer their clients a wide array of products, giving them assistance through all stages of their growth. Even though this kind of lending is more risky than lending to individuals, the default risk has been decreasing. They do a really good job in selecting their commercial lending customers.  Acquisition strategies: Pacwest specializes in acquiring banks. They have completed 27 acquisitions since 2000, including the last purchase of “Square 1 Financial” 1 week ago. This will help them to improve its funding profile by reducing the firm's reliance on higher-cost CDs and diversifies the loan portfolio into complementary businesses and contributes additional sources of fee income. Last year’s purchase of CapitalSource Bank made Pacwest Bancorp grow mainly nationwide with a full spectrum of middle-market lending.  Net Interests Rate Spread: The primary interest‑earning assets are loans and investment securities, and the primary interest‑bearing liabilities are deposits. A high yield in interest earnings and a competitive cost of deposits contribute to the high net interest margin. While an average bank has a 3-3.5% on net interest margins, Pacwest achieves quarter after quarter a 5.5%.This is a key determinant of a financial institution's profitability.  Core Deposit Growth: While the deposit balances will fluctuate depending on deposit holders’ perceptions of alternative yields available in the market, Pacwest seeks to minimize these variances by attracting a high percentage of noninterest‑bearing deposits. As an industrial loan bank, the former CSB (2014 acquisition) funded its balance sheet with a large proportion of higher-cost time deposits and as a result of the CapitalSource Inc. merger, they added $5.3 billion of time deposits. The goal is to continue replacing these higher-costing time deposits with core deposits through a dedicated deposit transformation initiative that includes sourcing deposits from CapitalSource Division borrowers. As of June 30, 2015, total deposits obtained from CapitalSource Division borrowers totaled $455.5 million, of which $441.8 million were core deposits. Competitors: Pacwest is a regional bank based in California that is increasing their operation nationwide. Thus, it most comparable competitors are City National Bank and East West Bank, which are based in California and are also focused on services to small to mid-sized businesses. Another competitor is Western Alliance Bank that offers different financial services in Arizona, Nevada and California. Of course, Pacwest also has other well-known large competitors, like Bank of America, Wells Fargo and JP Morgan. However, these popular federal banks are too big to be compared with any regional Bank. Source: Bloomberg Source: Bloomberg Source: Reuters -10% 0% 10% 20% 30% 10 11 12 13 14 Current CATY PACW
  • 4. 11/15/15 Gonzalo Arroyo-Baudet Stetson University Student Research 4 Exhibit 8: Interest Rate Exhibit 9: Competitive Analysis Exhibit 7: Domestic Deposit Market Share Source: Bloomberg Source: Reuters Source: Bloomberg Industry and Peer Group Overview Companies in the regional banking industry provide services such as commercial banking, asset management, mortgages and loans. Banking companies are more and more putting more emphasis on their focus on the rapidly changing customer expectations. Also, population growth will increase the relative numbers of both the oldest and youngest customer segments, which creates challenges for banking companies. Older customers are normally more loyal, whereas the youthful customers are more likely to bounce around and are technologically savvy. Banking customers are also becoming more hands on and can bank at the freedom of their cell phone. So banks like Pacwest who have strong online banking and also enough advisors to satisfy customers that like to come in, they are positioned greatly. Under the Riegle-Neal Act of 1994, which most importantly empowered nationally chartered lenders to operate across state lines, regulators can only approve mergers or acquisitions if the combined companies' deposits don't exceed 10% of total deposits nationwide. This is a problem for banks like JPMorgan Chase, Bank of America, and Wells Fargo, all of which have already passed the 10% threshold. These banks hold 11.1%, 11.3%, and 10.5%, respectively, of total domestic deposits. This gives smaller banks, like regional, more power to merge with other smaller banks because they will never reach the 10% threshold. Rising Interest Rates: The anticipation of rising interest rates is hanging most on the banking and financial industries. A rising rate environment bodes well for the banking sector. I believe that bank stocks can continue to outperform in anticipation of a shift in the trajectory of rates. With interest rates higher, banks, especially regional banks that do a lot of loan origination, should be able to charge more for their products. They should also be able to pay more interest to their depositors, giving higher incentive to savers. There are three scenarios for the interest rates and what will happen to the banks when they decide move. Overall, the banking and financial industries are poised for success looking forward. Interest Rate Scenarios: Like I said above, a rising interest rate environment bodes well for the baking sector. There are a couple of different rate scenarios that need to be analyzed for bank stocks. The best scenario for banks is higher short rates because 71% of the loans are priced off the front end of the curve. This needs to happen for net interest margins to expand, because banks need short rates to go up more than long rates. The second scenario is when the long-term rates rise more than the short-term rates. This scenario would benefit the banking industry, but it wouldn’t bode as well as the first scenario. The worst scenario for the banking industry would be if rates were to remain low for longer leaving the industry with few levers to pull to drive earnings. Competitive Positioning Pacwest’s business model is relationship focused. They focus on customer acquisition and finding customers that they can build relationships with. The main strategy of the company is to build up strong customer relationships while obeying underwriting standards to grow the low-cost deposit base and provide the high-quality loans, which will help the company achieve the long-term growth and profitability. Meanwhile, the acquisition is considered as a consistent business strategy of company. The company has successfully acquired 27 banks since 2000 for increasing its presence in California and earning assets. The regional banks are attached to the banks group and provide financial services to clients such as loans and commercial services. The regional banks majorly generate their revenues by providing high quality loans services and growing the low-cost depository services from the customers in order to increase earning spreads. The competition in the regional bank sub-industry is highly intensive considering the 4810 players in the regional-bank market and high presence of national banks as well as international banks. The major players under the banks group that have high presences in the California are Bank of America (BAC), US Bancorp (USB), Wells Fargo& Company (WFC), Citigroup (C), City National Corporation (CYN) and CVB Financial Corp (CVBF) (Exhibit 9). Regional Focused: The PacWest Bancorp operates their banking business in California area containing 80 full-service communities banking branches. Therefore, Pacific Western Bank is able to provide relatively high personalized banking services and develop loyal local customers. Also, region-focused banks are unlikely affected as much as large banks by the fluctuation of foreign currency. The dollar value keeps going up; many large banks’ foreign asset was shrinking and reduced their net income. However, Pacific Western Bank only focuses on domestic market, so its operation will take less effect from the increasing
  • 5. 11/15/15 Gonzalo Arroyo-Baudet Stetson University Student Research 5 Exhibit 10: Net Interest Rate Spread Exhibit 12: Inflation Rate vs. Banking Industry Revenue Growth Source: Reuters Source: Bloomberg dollar value. In addition, due to their low (1%) investment in the Oil and Gas industry, they have not been adversely affected. Target small and mid-sized Business: Pacific Western Bank provides commercial banking services mainly to small and mid-sized businesses. Those start-up businesses have limited loan options from Bank of America and Wells Fargo & CO, because start-ups cannot meet usually large national banks’ high requirements. However, Pacific Western Bank is willing to offer loans and financial solutions to those set- up companies and charge higher fees or interest rates to achieve a higher market return. That is why their net interest rate spread is 5.5% while other banks have a lower rate of around 3%. In addition, Pacific Western Bank offers unique banking tools to meet customer needs such as credit reports and Intuit Turbo Tax. The unique banking tool is very attractive to small, medium companies, as in general those small companies cannot afford such services from professional consulting companies, and allows clients to file and send taxes online. Strong Presence in the Local Area: As PacWest Bancorp goes forward with its acquisition strategy, its top two core business segments are banking and asset financing. Though banking is the largest revenue source of PacWest Bancorp, asset financing is growing faster than banking in terms of both total assets and revenue. Along with the merger and acquisition process, PacWest Bancorp became more resource efficiency and integrity in the banking system, for example compare with 2012, the company overall efficiency increased by 3 percent. Also, a wide financing segment provides comprehensive customer services. Its premium banking services and strong presence distinguish themselves from other community banks in California. I believe any factor that has a big impact on the whole economy can be a key variable driving the stock market and financials sector because financial entities are involved in every industry and individuals. There are four major macroeconomic indicators that will influence the future performance on financial sector. They are Interest Rates, M2 (Money Supply), inflation, and Real GDP. Interest Rates: It is an important benchmark of how the economy is doing. It is an effective tool for The Federal Reserve to keep inflation under control and maintain the economic health of the United States. Since the daily operations of financial services, especially banks are tied to interest rates, and the interest rate environment mainly determines the profitability of a financial stock. The effective Federal Funds rate is one of the key economic variables that have a major impact on the financial sector of stock market. The following graph shows the historical trend of the Effective Federal Fund Rate from 1954 to 2015 (Exhibit 11). During the financial Crisis of Dec. 2007-2008, the rate decreased dramatically from 5.26%-0.16%. We are currently at the historical low rate level around 0-0.25%. The FOMC has maintained it that low to fight the Great Recession of 2008-09 and stimulate the U.S. economy. Following this trend, the class expects the effective Federal Funds Rate to increase by 1 to 1.25% during the next 12-18 months. We expect the 10 Year Treasury to be between 2.75 and 3.25% at the end of 2016. The long-term forecast of interest rate is really dependent on employment rate and inflation rate in the future. We predict the unemployment will decrease with strong job gains and inflation will increase in a low speed, which indicates a strengthening economy. We believe that the stronger the economy, the greater the growth of financial sectors because of the rising demand of capital. Inflation: As the inflation rate increases, the lending by banks, the quantity of bank assets and the volume of liabilities issued by banks decrease; the stock return volatility increase. It is very important for financial institutions to take a deep look at the inflation rate because it has profound influences on its activities. The following graph shows the inflation rates from year 2005 to year 2015. In recent months, the inflation rates are at the lowest level since late 2009 and on January and March 2015, there were even deflation of -1 percent due to low energy cost and decline food index. The class expects inflation rate to increase 1.5% in the next 12-18 months. The Fed sets the objectives of maximum employment and 2 percent inflation. To support continued progress toward maximum employment and price stability, the Fed will gradually increase interest rates until the inflation rate gradually reaches to 2 percent. GDP: Real GDP inflects the health of financial market. Increasing real GDP leads to less default on loans and debts. Thus, shareholders are more confident on their investment decisions and are willing to invest more or expand. The following graph shows the historical real GDP growth rate in recent 10 years. We can see a steeply drop during the 2008 economic crisis, and a strong increase since 2009, since the real GDP index is strongly correlated with economic development. Following this trend, the class expects that the Real GDP Growth will increase between 2.5 and 3% in the next 12-18 months. Consumers are energized by the availability of more jobs and by lower energy prices, which are putting more money into their pockets to shell out for other goods and services. When consumers spending increases, more and more businesses will
  • 6. 11/15/15 Gonzalo Arroyo-Baudet Stetson University Student Research 6 Exhibit 10: Revenue Growth Rate Exhibit 15: Geographical Location Source: Pacwest Bancorp Website Exhibit 13: GDP Growth vs. PACW Stock Return Source: Bloomberg Source: Bloomberg increase investment in new production capacity and the Real GDP will continually increase. The current steady increase of Real GDP lays a solid foundation and healthy environment for the financial industry and people have more money to spend, save and invest. Market Share Total Domestic Deposit Market Share: As of 2014, three banks accounted for 30% of the entire market share in terms of total domestic deposits. Bank America controlled 10.9% of the market share with $1.019 trillion total deposits. Wells Fargo was second with $924.1 billion in total deposits accounting for 9.90% of the market share. And the last biggest company is JPMorgan, which accounted for 9.8% of the market share with $916.5 billion in total deposits. Regarding Pacwest, it is the 84th largest depositary organization in the United States; it has consolidated assets of approximately $16.7 billion. Regional Deposit Market Share: PacWest controls PWB, which operates branches only in California. PWB is the 14th largest insured depository institution in California, controlling approximately $12.0 billion in deposits, which represent 1.1 percent of the total deposits of insured depository institutions in California. With the acquisition of Square 1, it approximately added $2.4 billion in deposits. This takeover took place 1 week ago so PacWest has become the 76th largest depository organization in the United States, with $14.4 billion in deposits, which represent less than 1 percent of the total amount of deposits of insured depository institutions in the United States. I think with this acquisition and some time, call it 24 months, that PACW becomes a front runner for a Wells Fargo & Co. (NYSE:WFC) acquisition. Wells Fargo is headquartered in California, could make great sense of buying PACW's huge California location exposure, consolidating the branches, and realizing an ungodly amount of synergies. The SQBK division could feed nicely up to Wells' IB or asset management segments, etc. This is really more a subject for an article a bit later in development, but just know that the table is being set for this to happen. It just makes too much sense. Same Store Revenue Organic Growth: Same store sales are often used as a measure of organic growth. For the last five years, the average annual revenue growth for the Peer Group was -1%. In contrast, PacWest’s revenue growth has outpaced the Regional Banks Industry by 7%; the 5 year revenue growth rate is 6%. I am expecting a steady organic growth of 2 to 3% per quarter in the next 12-18 months. Geographical Growth: Pacwest is the 11th biggest bank in terms of market share in the Southwest region. With the corporate strategy of acquisition, 27 financial companies since 2000, PacWest has been able to expand to other states like Arizona and Texas. Its last purchase of Square 1 Financials made them also be the 8th largest bank in North Carolina. We shouldn’t be surprised by any new acquisition plan announced in later years. They will definitely become bigger and expand into more states. Branding Strategy: PacWest is known for supporting startups and providing them with financial services, at a lower cost, to help them for example fill out their taxes. They also provide with loans to small and mid- companies that are not able to get a loan from bigger banks. PacWest tries to work out a plan with these companies to help them finance their business activities. The Pacwest Bancorp distinguishes themselves from other banks by providing extremely high level customer services and maintaining the competitive interest rate charged on loans. Financial Analysis Acquisition Contributing to Topline Growth: Pacwest Bancorp has successfully acquired 27 banks since 2000. With the continuing expansion of the company, they had a progressive increase in its assets and net income. Last year they spent 2,237 million dollars in the takeover of CapitalSource which made them increase by 122%. At the beginning of October they consolidated another acquisition, Square 1 Financial, for 702 million dollars. Acquisitions since 2008 are worth $3.5 billion and each takeover has add on average 30% income to the total revenue. Average Rev. Growth PACW: 6% Industry:-1%
  • 7. 11/15/15 Gonzalo Arroyo-Baudet Stetson University Student Research 7 Exhibit 16: Core Deposits as Percentage of Total Deposits Source: Company 10-Qs Increase of Core Deposits to Margins Expansion: Pacwest counts on core deposits as a stable source of funds for their lending base. Core deposits offer many advantages to the bank, such as predictable costs and a measurement of the degree of customer loyalty. In addition to the advantages mentioned above, core deposits are less vulnerable to changes in short-term interest rates than CDs or money market accounts. Core deposits are an important focus for Pacwest in the next year. With the completion of the Square 1 merger, PacWest has a substantially improved core deposit base and a proven platform for generating profitable loan, deposit and noninterest income growth in the venture capital banking space. Core Deposits Increased $230.6 Million in the Quarter and Represent 56% of Total Deposits. Net Interest Margin was this last quarter 5.19%. The interest rate environment is going to play an important role in how Pacwest grows. By analyzing Pacwest’s three main segments, I found different growth rates accordingly. Historically, Wells Fargo’s revenue breakdowns for their operating segments have been stable. The majority of their revenue, Interest Revenue, has a fairly steady rate of about 90 to 92% (Exhibit 17). This revenue comes from a higher than industry average net interest margin which has been averaging 5.6% for the last five quarters while the industry has 3%. Revenue: Pacwest’s revenues dropped in the last quarter to 208 million dollars; there was a 6% decrease compared to Q2. Noninterest income decreased by $3.8 million (almost 20%) to $15.8 million for the third quarter of 2015 compared to $19.6 million for the second quarter of 2015 due mostly to lower realized gains and dividends on equity investments and lower income recognized as a result of loan and lease prepayments. Net interest income decreased $10.1 million (6%) to $192.5 million for the third quarter of 2015 compared to $202.6 million for the second quarter of 2015 due to lower discount accretion on acquired loans and lower FHLB dividends. However, future quarters look promising in terms of revenue due to the acquisition of Square 1 Financials. This growth along with the upcoming interest rate increases show that Pacwest is in a great position to keep increasing their revenues and beat there 2015 numbers in 2016. In the last 5 years they have an average revenue growth of 6%. They have continued to improve their quality of assets and have decreased their nonperforming assets. Their net charge offs have stayed pretty stable which is a good indication considering they have more exposure because of their increased accounts, deposits, and loans. With interest rates expected to rise, Pacwest is in great position to continue to increase its profit margins by steadily increasing its revenues and decreasing its costs. Pacwest makes their revenue mostly from Real Estate Mortgage (47%), Real Estate Construction and Loan (3%), Commercial Loans (50%), Consumer Loan (1%) . Of course it has also been profiting off of the rising real estate market through their increase in mortgage loans and hopefully this sector will continue to grow and continue to increase their revenue as a result. The main factor that is going to increase revenue in the last quarter of 2015 is the takeover of a Bank from North Carolina. According to my pro forma, I expect revenue to increase by 22% in Q4 2015. As a banking holding company, its growth of revenue is driven by its growth of assets. I decomposed the revenue into 2 parts: interest revenue and non-interest revenue. Interest revenue is driven by the interest-bearing assets such as loans. Once I figured out the average interest income rate on each of interest-bearing assets, I could combine my estimates on key economic variables and make a reasonable assumption. Using the estimated interest income rate, I multiplied the corresponding driven asset; and I got the revenue earned from that asset in the specific year. Gross Profit: Pacwest has been working hard to be the most efficient and they had great results in the last year. Their gross profit increased from averaging 30% in the past years to averaging 50% in the last 5
  • 8. 11/15/15 Gonzalo Arroyo-Baudet Stetson University Student Research 8 Exhibit 18: Gross Profit % Source: Reuters quarters. PACW has two main categories they separate their revenues into: net interest income and noninterest income. Net interest income accounts for 92% of the revenue and noninterest income accounts for 8%. Net interest income is driven by growth in earning assets, and PCI accretion. Some different services that drive the net interest income are short-term investments and fed funds, mortgages and loan sales and investment securities. The greatest drive will be the earning assets for next quarter due to the acquisition. Noninterest income, on the other hand, is a combination of many different categories. Their greatest driver is service charges on deposit accounts and commissions fees. By increasing their customer growth, this will eventually lead to higher gross profits. PACW pays high advisory and commission fees because of their business strategy. They want to be very personal and by doing this have a high supply of advisors. PacWest is better positioned with increasing interest rates to increase their profit margin in the next coming years. Organic Growth vs. Acquisition Growth My valuation models are based on the estimated organic growth only unless there is a verified acquisition plan in the future. For example, On March 2015, Pacwest announced its acquisition of Square 1 Financial, Inc, which was completed October 8th . I indicated this acquisition on my estimated Quarter 4 of 2015 Pro Forma revenue and expenses. It will improve PACW's funding profile by reducing the firm's reliance on higher-cost CDs and diversifies the loan portfolio into complementary businesses and contributes additional sources of fee income. Other than that, I just used the estimated organic growth from my analysis of the whole economy, industry, and the company performance in next years. I was pretty conservative; did not take account of any unpredictable future acquisition plans in my valuation. Organic loan growth of 14% is high relative to peer averages of between 8% and 10%. This means, Pacwest is in a pretty good situation considering the main feature that makes a bank gain money, loans. Margin Expansions Profit Margin Improvement: Pacwest’s profit margins are fairly cyclical and they also correlate with interest rates. Pacwest’s profit margins have steadily increased since the financial collapse and all 27 acquisitions since 2000 helped has helped their margins by increasing their economy of scale. Profit Margin: Pacwest has the highest profit margins among the big four banks in the United States. Its profit margin has been steady at around 30-33%% in the last 5 quarters, yet with interest rates about to rise I believe this will only increase this margin. I believe this because there is a strong correlation between interest rates and Pacwest’s profit margin. This is expected because higher interest rates allow Pacwest to increase their net interest margins which increases their revenues at no cost to the company. PACW has a profit margin exceeding its competitors (the industry average is right now at 19%); it shows that they are more profitable company and that they have better control over its cost compared to its competitors.
  • 9. 11/15/15 Gonzalo Arroyo-Baudet Stetson University Student Research 9 Exhibit 19: Return on Equity Exhibit 20: Book Value of Equity Growth Source: Reuters Source: Reuters Earnings PACW’s earnings grew a lot since they bought Capital1 5 quarters ago. Its EPS growth in the last year was 121%. This shows how much they grow when they acquire other companies. As I said before, they just acquired Capital Source which will make Earnings continue to grow. This growth is also due to the stronger economic environment and the soon to be rising interest rates. Despite the low interest rate environment, revenue and pre-tax pre-provision profit increased year over year, and they continued to operate within their target ranges for ROA, ROE, and efficiency ratio. Looking forward, the company and my calculations expect the company to continue to grow in areas such as commercial real estate, international commercial loans, investment banking and credit card and thrive in 2016 Pro Forma: For my pro forma analysis of WFC, I found that they should expect to see an increase in revenues and net profit the last quarter of 2015 due to the acquisition of Square Financial 1. For 2016 I expect them to have organic growth. Thus, I analyzed their segmented revenues and ran regression analysis on these segmented revenue trends with economic factors like GDP, inflation rates, and change in interest rates. Through these regressions I found that Pacwest’s main segment, which is interest income from commercial lending, correlates with interest rates and change in interest rates. Using these correlations along with their historical growth rates and information gained from their quarterly and annual statements I projected Pacwest’s income statement until 2017. With these factors I expect that we will see revenues increase to $254.5 million in Quarter 4 of 2015 and net income to increase to $85.5 million. I expect earnings per share to increase to $0.71.Apart from the acquisition, most of this economic growth is the result of a stronger economic outlook for 2016 and the highly probable increases in interest rates. Return on Equity Pacwest return on equity was 9.81 percent in 2015. This 9.81 percent is the profit expressed as a percentage of its shareholder value. It has a much higher ROE than the industry average of 8.25 percent. It is clear that Pacwest’s positive ROE is a result of their high net income and sales as well as the industries. Also, Pacwest’s efficiency ratio was 40.6 percent, which means their inventory turnover is strong as well. Cash Flow Free Cash Flow: A more pertinent way to measure the company’s cash flow is their free cash flow. This is how much operating cash flow remains after capital expenditures. This last querter Pacwest had a free cash flow of $150 million. This is good considering they acquired Wachovia in 2014, which used some of their free cash flow. Yet this measurement saw a lot of volatility due to the constant takeovers of financial institutions. Debt Debt to Equity: Currently, Pacwest has long term debt of $987.9 million compared to CATY’s long term debt of $1014 million. Pacwest debt to equity ratio is 27.58, which is lower than the regional bank’s industry which is 80.25. This is a good sign showing that they are more selective with their debt contracts and value their equity higher. PACW is also better of regarding the debt to assets ratio; it is 5.88 while the industry has 9.5. Total Debt to EBITDA: More importantly, it is crucial to compare WFC’s debt-to-EBTIDA ratio because is displays the amount of time for each company to pay off their debt. Currently WFC’s ratio is 6.34, compared to JPM’s ratio of 25.66. The debt to EBITDA ratio suggests that WFC has a better likelihood of paying off their debts thereby reducing the default risk for investors. Valuations In this section, we estimate the fair values of Pacwest’s stock. It should be noted that all input data were derived from historical company data and pro forma estimates. Price to Book Valuation Model: The Price to Book Ratio formula, sometimes referred to as the market to book ratio, is used to compare a company's net assets available to common shareholders relative to the sale price of its stock. The calculated fair value is $51, which is an undervaluation of
  • 10. 11/15/15 Gonzalo Arroyo-Baudet Stetson University Student Research 10 9%. Residual Income Model: This model values securities using the company’s current book value per share and the present value of expected future residual income. The calculations can be seen in the Appendix 3. Using the estimated BPS growth rate of 7.95% for the next year, the model shows that the fair value price per share is $57.5, making this security undervalued by 22%. This model values securities using a combination of a company’s current book value per share and the present value of expected future residual income. Average Fair Value: Pacwest is currently trading at $47, and based on the average fair value from the valuations results in an average fair value price of $54, meaning they are undervalued by 15%. Investment Risk Financial Institutions: Pacwest’s business and earnings are sensitive to economic and general business conditions. Upside and downside risks that can affect my price target on Pacwest include sustainability of pre-provision profit, ability to continue to grow revenues, higher than expected credit losses, sharper volatility in markets related revenues, and political/regulatory changes impacting consumer banking and mortgage business. As a financial institution, Pacwest will be forced to hold substantially more capital than other companies, which could depress returns. They could use that capital for other investments. Risky Takeovers: While acquisitions are usually positive for the buying company, it is really risky. Pacwest has acquired 27 financial institutions since 2000, they average more than 1 acquisition per year. This makes Pacwest be riskier due to the great amount of money they invest in other companies. Macroeconomic Environment: The macroeconomic environment is also a risk that we must take into account. The macroeconomic environment could increase the credit risks. Credit risks are influenced by the macroeconomic environment, the higher the anticipated credit risk, the higher the rate of interest that investors will demand for lending their capital. Also, an extended period of deleveraging combined with low interest rates could dramatically reduce profitability. Interest Margins: Interest margins are anticipated to keep decreasing until the Federal Reserve raises interest rates. This is a risk because if interest rates do not rise within the next few quarters then Pacwest will see lower revenue and profit margin growth than I have predicted. However, I really think interests will rise in the next quarters.
  • 11. 11/15/15 Gonzalo Arroyo-Baudet Stetson University Student Research 11 Table of Contents Appendix 1: Income Statement 12 Appendix 2: Balance Sheet 13 Appendix 3: Statement of Cash Flow 14 Appendix 4: Pro Forma Income Statement 15 Appendix 5: Pro Forma Balance Sheet 16 Appendix 6: Price to Book Value Valuation Model 17 Appendix 7: Residual Income Valuation Model
  • 12. 11/15/15 Gonzalo Arroyo-Baudet Stetson University Student Research 12 Appendix 1: Income Statement Source: Yahoo Finance
  • 13. 11/15/15 Gonzalo Arroyo-Baudet Stetson University Student Research 13 Appendix 2: Balance Sheet Source: Yahoo Finance
  • 14. 11/15/15 Gonzalo Arroyo-Baudet Stetson University Student Research 14 Appendix 3: Statement of Cash Flow Source: Yahoo Finance
  • 15. 11/15/15 Gonzalo Arroyo-Baudet Stetson University Student Research 15 Appendix 4: Pro Forma Income Statement Source: Thomson Reuters and Personal Estimates
  • 16. 11/15/15 Gonzalo Arroyo-Baudet Stetson University Student Research 16 Appendix 4: Pro Forma Balance Sheet
  • 17. 11/15/15 Gonzalo Arroyo-Baudet Stetson University Student Research 17 Appendix 5: Price to Book Valuation Model Source: Thomson Reuters and Personal Estimates Appendix 6: Residual Income Valuation Model Fair Value: $57.5 Undervalued by 21% Source: Thomson Reuters and Personal Estimates
  • 19. 11/15/15 Gonzalo Arroyo-Baudet Stetson University Student Research 19 Sources: Baseline Bloomberg Reuters UNECE CNBC Morningstar Yahoo Finance Business Insider Pacwest 10-Q Pacwest 10-K Pacwest Announcements Pacwest Transcripts Pacwest Conference Calls Disclosures: Ownership and material conflicts of interest: The author(s), or a member of their household, of this report does not hold a financial interest in the securities of this company. The author(s), or a member of their household, of this report does not know of the existence of any conflicts of interest that might bias the content or publication of this report. Receipt of compensation: Compensation of the author(s) of this report is not based on investment banking revenue. Position as a officer or director: The author(s), or a member of their household, does not serve as an officer, director or advisory board member of the subject company. Market making: The author(s) does not act as a market maker in the subject company’s securities. Disclaimer: The information set forth herein has been obtained or derived from sources generally available to the public and believed by the author(s) to be reliable, but the author(s) does not make any representation or warranty, express or implied, as to its accuracy or completeness. The information is not intended to be used as the basis of any investment decisions by any person or entity. This information does not constitute investment advice, nor is it an offer or a solicitation of an offer to buy or sell any security. This report should not be considered to be a recommendation by any individual affiliated with CFA Society of Orlando, CFA Institute or the CFA Institute Research Challenge with regard to this company’s stock.