SlideShare a Scribd company logo
MEMORANDUM
To: Credit Committee
From: Pawan N. Talreja
Date: May 12, 2016
Subject: New Limit– Bank of America Corporation (BAC)
PURPOSE
The purpose of the analysis is to establish a new investment limit equivalent to 10% of
Total Capital of Safra National Bank of New York (SNBNY) at Q1’2016 of $539.80MM or
$53.98MM (vs $41.15MM at 07/15), for investment in bonds with Bank of America
Corporation (BAC).
FITCH
As of July 31, 2016, Bank of America Corporation (BAC) was rated A/Stable by Fitch
ratings. BAC's core earnings performance, while well below that of peers, has improved.
Should BAC continue to narrow the earnings gap between itself and peer banks, and
should earnings begin to exceed BAC's cost of capital, there could be some upside to
ratings. Fitch Ratings believes additional expense management initiatives remain key
leverage points to help improve the company's long-term earnings power. These will
include process improvements, branch network optimization and some headcount
reductions. BAC indicates that its earnings are sensitive to higher short-term interest rates,
which Fitch believes is due to the company's sizable retail deposit base. BAC's retail deposit
base may re-price slower than banks with more commercial-focused deposits. Bank of
America, N.A.'s (BANA) IDR is rated 'A+'/Stable, reflecting expected implementation of
total loss absorbing capital (TLAC) requirements for U.S. G-SIBs and the presence of a
substantial debt buffer in the holding company. In order to exit parallel run, BAC had to
add to its risk weighted assets, pushing its pro forma Common Equity Tier I ratio below
peers. That said, there is some conservatism to capital ratios in this increase and large
component of operational risk RWA.BAC's liquidity position remains strong. It has an
1
abundance of low cost retail deposits, which are treated favorably under various regulatory
rules such as the LCR and SLR.
COMPANY OVERVIEW
Bank of America Corporation, incorporated on July 31, 1998, is a bank holding company
(BHC) and a financial holding company. The Company is a financial institution, serving
individual consumers, small- and middle-market businesses, institutional investors, corporations
2
and governments with a range of banking, investing, asset management and other financial and
risk management products and services. The Company's segments include Consumer Banking,
Global Wealth & Investment Management (GWIM), Global Banking, Global Markets, Legacy
Assets & Servicing (LAS) and All Other. Through its banking and various nonbank subsidiaries
throughout the United States and international markets, the Company provides a range of
banking and nonbank financial services and products.
Consumer Banking (37% of Net Revenues)
The Company's Consumer Banking segment offers a range of credit, banking and
investment products and services to consumers and small businesses. Consumer Banking
product offerings include traditional savings accounts, money market savings accounts,
certificate of deposits (CDs) and individual retirement accounts (IRAs), noninterest- and interest-
bearing checking accounts, investment accounts and products, as well as credit and debit cards,
residential mortgages and home equity loans, and direct and indirect loans to consumers and
small businesses in the United States. The franchise network includes approximately 4,700
financial centers, over 16,000 automated teller machines (ATMs), across the nation call centers,
and online and mobile platforms.
Global Wealth & Investment Management (22%)
The Company's GWIM segment provides tailored solutions for clients through a set of
investment management, brokerage, banking and retirement products. GWIM also provides
wealth management solutions, as well as customized solutions for clients' wealth structuring,
investment management, trust and banking needs, including specialty asset management
services.
Global Banking (20%)
The Company's Global Banking segment provides a range of lending-related products and
services, integrated working capital management and treasury solutions to clients, and
underwriting and advisory services through a network of offices and client relationship
teams. Global Banking's lending products and services include commercial loans, leases,
commitment facilities, trade finance, real estate lending and asset-based lending. Global
Banking's treasury solutions business includes treasury management, foreign exchange and
short-term investing options. Global Banking also provides investment banking products to
clients, such as debt and equity underwriting and distribution, and merger-related and other
advisory services.
Global Markets (18%)
The Company's Global Markets segment offers sales and trading services, including
research, to institutional clients across fixed-income, credit, currency, commodity and
equity businesses. Global Markets product coverage includes securities and derivative products
in both the primary and secondary markets. Global Markets provides market-making, financing,
securities clearing, settlement and custody services across the globe to institutional investor
clients in support of their investing and trading activities. Global Markets also works with
3
commercial and corporate clients to provide risk management products using interest rate, equity,
credit, currency and commodity derivatives, foreign exchange, fixed-income and mortgage-
related products. Global Markets also manages risk in a range of financial products, including
government securities, equity and equity-linked securities, high-grade and high-yield corporate
debt securities, syndicated loans, mortgage-backed securities (MBS), commodities and asset-
backed securities (ABS).
Legacy Assets & Servicing (4%)
The Company's LAS segment is engaged in providing mortgage servicing activities related
to residential first mortgage and home equity loans serviced for others and loans held by
the Company, including loans that have been designated as the LAS Portfolios, and
manages certain legacy exposures related to mortgage origination, sales and servicing
activities (litigation, representations and warranties). LAS segment also includes the results
of mortgage servicing rights (MSR) activities, including net hedge results.
All Other (-1%)
The Company's All Other operations consists of asset and liability management (ALM)
activities, equity investments, the international consumer card business, liquidating
businesses, residual expense allocations and other. ALM activities encompass certain
residential mortgages, debt securities, interest rate and foreign currency risk management
activities. Additionally, certain residential mortgage loans that are managed by LAS are held in
All Other segment.
4
As of 03/31/2016, total Assets under Management (AUM) was equal to $891BN (vs
$917BN), while total client balances, including Brokerage assets and assets under custody
(AUC), was equal to $2.46TN (vs $2.51TN).
MAJOR DEVELOPMENTS
On July 22, 2015, Chief Financial Officer (CFO) Bruce Thompson, decided to step down as
chief risk officer (CRO) and chief financial officer (CFO).
On March 5, 2015, New York state appeals approved Bank of America Corp's $8.5BN
settlement with mortgage securities investors in its entirety.
On March 11, 2015, Federal Reserve Board (Fed) informed the company that it completed
its 2015 Comprehensive Capital Analysis and Review (CCAR) and it did not object to the
company's capital plan for the period from the second quarter of 2015 through the second
quarter of 2016. This plan includes the $4BN stock repurchase program and maintaining the
common stock dividend at the current rate of $0.05 per share per quarter. Fed also asked
Bank of America to submit an additional capital plan by Sept. 30, addressing certain
weaknesses identified in the company's capital planning process. If Bank of America does
not make material progress in addressing these key weaknesses, the Fed may restrict the
company's capital distributions.
On May 20, 2015, four banks, including Bank of America Corporation (BAC) pleaded
guilty to trying to manipulate foreign exchange rates and, with two others, were fined
nearly $6 billion in another settlement in a global probe.
5
FINANCIALANALYSIS (DECEMBER 31, 2015 vs DECEMBER 31, 2014)
Bank of America Corporation ($ Millions) 12/31/2013 12/31/2014 12/31/2015 3/31
Total Assets $2,102,273.00 $2,104,534.00 $2,144,316.00 $2,143
Gross Loans $939,595.00 $894,227.00 $910,454.00 $887
Total Securities $762,761.00 $816,751.00 $826,004.00 $838
Net Income $11,431.00 $4,833.00 $15,888.00 $3,3
ROAA 0.53 0.23 0.74 0
ROAE 4.89 2.03 6.31 5
Growth of Gross Loans 1.33 -4.83 1.81 -0
Growth of Total Assets -4.87 0.11 1.89 1
Regulatory Tier 1 Capital $161,456.00 $168,973.00 $180,778.00 $173
Regulatory Tier 1 Ratio 12.44 13.40 12.90 1
Regulatory Total Capital $200,281.00 $208,670.00 $220,676.00 $214
Regulatory Total Capital Ratio 15.44 16.50 15.70 1
Net Loans / Deposits 82.39 78.63 75.02 7
Impaired Loans / Gross Loans 3.89 3.24 2.66 3
Reserves for Impaired Loans / Gross loans 1.85 1.61 1.34 1
Net Charge offs / Ave Gross Loans 0.86 0.57 0.58 0
Liquid Assets / Deposits and ST Funding 43.47 47.65 46.15 4
Net Interest Margin 1.95 1.86 1.82 1
Derivatives $37,407.00 $46,909.00 $38,450.00 $52,
Source: Fitch Peer Group Analysis
6
INCOME STATEMENT
For FY’15, Bank of America Corporation (BAC) reported net income of $15.89BN (vs
$4.83BN), an increase of 250%, over Revenues, net of interest expense, of $82.61BN (vs
7
$84.25BN), a decrease of only 2%. The increase in net income was mainly driven by a decline
other general operating expenses of $9.34BN (vs $25.30BN), as the category decreased by
$16.0BN, primarily due to a decrease of $15.2BN in litigation expense which was primarily
related to previously disclosed legacy mortgage-related matters and other litigation charges
in 2014, as well as other lower operating costs in Legacy Asset and Servicing (LAS)
business.
Major components of net revenues, relatively unchanged, were as follows:
-Net Interest Income of $39.26BN (vs $39.95BN) or 48% of Net Revenues.
-Investment and Brokerage Services Fees of $13.34BN (vs $13.28BN) or 16%.
-Other Non-Interest Income, including Service charges, Card income, Trading account profits,
Investment banking income and Mortgage banking income of $29.93BN (vs $30.92BN) or 36%.
Recurring fee-based and banking revenues comprised of approximately 77% of Total
Revenues and were mainly sourced from US (87% of Net Revenues).
Compensation expenses/Net revenues were equal to 39.77% (vs 40.09%), while Other Operating
Expenses/Net Revenues were equal to 29.44% (vs 49.06%), resulting in Cost-Efficiency ratio
of 69.21% (vs 89.15%), which is relatively high, mainly due to high operating expenses,
including legal expenses, while compensation ratio is average for a major diversified bank.
The firm has recently initiated a variety of employee costs cuts initiatives affecting global
technology, operations and some investment banking and trading groups, though the exact
future impact of costs cuts has not been disclosed. Net-Interest-Margin (NIM) ratio was
equal to 1.82% (vs 1.86%), which is average. ROAE was equal to 6.31% (vs 2.03 %), while
ROAA was equal to 0.74% (vs 0.23%), which is considered to be low.
8
BALANCE SHEET
As of 12/31/2015, total assets were equal to $2.14TN (vs $2.10TN), an increase of 2%, which
was mainly affected by increase in Cash & Cash equivalents of $159.36BN (vs $138.59BN),
Debt Securities of $407.00BN (vs $380.46BN), and Net Loans & Leases of $890.77BN (vs
$866.97BN). The balance sheet was mainly comprised of Net Loans & leases (42% of Total
Assets), Debt Securities (19%), Securities Borrowed & Reverse Repos (9%), Cash (8%),
and Trading Assets (8%). Impaired Loans/Gross Loans were equal to 2.66% (vs 3.24%),
while Reserves for Loans/Impaired Loans were equal to 50% (vs 50%), with net charge off
rate of 0.58% (vs 0.57%), which indicates the mediocre loan quality, with modest loan loss
coverage and charge offs rates, which are slightly above average, indicating the fairly
adequate quality of allowances realized on the balance sheet in relation to impaired loans.
9
The Gross Loans Portfolio of $903.00BN, was mainly comprised of Consumer Loans of
$466.17BN (52% of Loans) and Commercial Loans of $446.83BN (48%):
The commercial credit exposure by industry, is summarized below, and the largest exposure by
industry included the Energy sector commercial utilized credit exposure of $21.27BN (8% of
Total Equity) and $43.81BN commercial committed (17%), which has been volatile in the
past year.
10
Total debt securities of $406.43BN were mainly comprised of MBS (67% of Debt
Securities).
The Top 20 country exposures, is summarized below, with country exposure to Brazil of
$15.88BN (6% of Total Equity) and Italy of $7.10BN (3%):
11
Illiquid assets, including other assets, intangible asset and goodwill, Net PP&E, was equal
to $191.68BN or 9% of Total Assets.
Majority of the balance sheet continued to be financed by Deposits of $1.20TN (64% of
Total Liabilities), Federal Funds purchased and securities loaned or sold under repurchase
agreements of $174.29BN (9%), Accounts Payable and Other Liabilities of $146.29BN (8%),
and Trading Liabilities of $66.96BN (4%). Out of total deposits of $1.20TN, majority were
interest bearing deposits (64% of Total Deposits) and US deposits (94%). Net Loans-to-
Deposit ratio was 75.02% (vs 78.63%), while Liquid Assets/Deposits and Short Term
funding was 46.15% (vs 47.65%), which indicates the good level of wholesale funding &
short-term liquidity level for the bank.
12
CAPITAL, LIQUIDITY & LEVERAGE
As of 12/31/2015, liquidity profile was excellent with total long term capital (Equity +
Subordinated Debt +Long Term Debt) of $492.97BN (vs $486.61BN), which included
Equity Capital of $256.20BN (vs $243.47BN), that increased mainly due to positive
profitability of $15.88BN during FY’15 & issuance of preferred shares of $2.96BN, offset
by dividends of $3.57BN, and Long Term Debt of $236.76BN (vs $243.14BN), out of which
18% is due in 2016 (Less than 1YR), 17% in 2017 (Less than 2 YR), while the residual 65%
was due thereafter. Global excess liquidity sources, which was substantially comprised of
High Quality Liquid Assets (HQLA) was equal to $504BN (vs $439BN), adequate for more
than three years before required market funding.
The bank subsidiaries can also generate incremental liquidity by pledging a range of other
unencumbered loans and securities to certain Federal Home Loan Banks (FHLBs) and the
Federal Reserve Discount Window. The borrowing capacity against this pool of specifically-
identified eligible assets was $252 billion (vs $214 billion). Tier 1 Ratio was 12.90% (vs
13.40%), Total Capital Ratio was 15.70% (vs 16.50%), and Fully phased-in Supplementary
Leverage Ratio (SLR) was 6.4% (vs 5.9%), which makes the bank a “well capitalized”
bank under Basel III regulation. The bank is also qualified as a Global systemically
important bank (GSIB), which subjects the bank to Total Loss Absorption Capacity
(TLAC) requirements like other major global banks, which is expected to be implemented
by January 2019. Total Daily VAR using a 95% confidence interval was equal to $85MM (vs
$120MM) or 0.03% of Total Equity, which is very manageable.
13
BAC passed the 2015 bank stress test round after resubmitting its capital plan and persuading
the Federal Reserve it improved internal controls. The Fed advised BAC that: “The firm must
continue to make steady, demonstrable progress prior to the 2016 CCAR cycle toward
establishing and maintaining sound risk-management and capital-planning processes that are
commensurate with the size and complexity of its operations.”
OFF BALANCE SHEET
The off-balance sheet liabilities, including lending commitments, guarantees and other
indemnifications are summarized in table above with a major concentration in lending
related commitments of $859.85BN (336% of Total Equity). The notional amount of
unfunded legally binding lending commitments, net of amounts distributed (e.g., syndicated)
to other financial institutions was $14.3BN (vs $15.7BN) or 6% of Total Equity. The
additional reserve for unfunded lending commitment was $646MM, an increase of
$118MM mainly attributable to higher unfunded commitments. Litigation-related expenses
were equal to $1.2BN for FY’2015, compared to $16.4BN for 2014. Management currently
estimates the aggregate range of possible loss is $0 to $2.4 billion in excess of the accrued
14
liability (if any) related to legal proceedings. During FY’2014, 2013, and 2012, the firm
incurred $2.9BN, $11.1BN and $5.0BN, respectively, of legal expenses, partly due to legacy
Bear Stearns mortgage assets. JPM is on track to meet its mandate to provide billions of dollars
in consumer relief to struggling homeowners as part of a settlement it reached over bad
residential mortgage-backed securities it sold before the financial crisis. There was zero net
derivative liability. As of FYE’15, the impact on net interest income assuming a 100bps
increase in short-term interest rate, in the base case scenario, was equal to an incremental net
income of $4.30BN (vs $3.68BN) on the banking book. The additional potential stress
scenarios are delineated below:
INTERIM ANALYSIS (FIRST QUARTER 2016 ENDING MARCH 31, 2016)
INCOME STATEMENT (MARCH 31, 2016 vs March 31, 2015)
For the three months ended March 31, 2016, BAC reported net income of $2.68BN (vs
$3.10BN), a decrease of 14%, over revenues, net of interest expenses, of $19.51BN (vs
$20.91BN), a decrease of 7%. On an absolute basis, the overall level of profitability remained
practically unchanged. Majority of net revenues continued to stem from Net Interest Income of
$9.17BN (47% of Net Revenues) related to banking activities, Investment and Brokerage
services of $3.18BN (16%), and Other Non-Interest Income, including service charges, card
income, trading account profits and investment banking income of $7.16BN (37%). In addition,
contingent maximum legal expenses above existing provisions, related to mortgage
representation & warranties legal proceedings, continued to be upto $2BN. In addition, Asset
under management (AUM) declined to $890.66BN (vs $917.26BN) and total client balances,
including brokerage assets of $1.06TN (vs $1.08TN), declined to $2.46TN (vs $2.51TN), which
contributed to moderately lower profitability in the brokerage, wealth & investment management
and custody businesses, via lower operating leverage for the quarter.
Compensation expenses/Net Revenues was equal to 45% (vs 46%), while Operating
Expenses/Net Revenues was equal to 31% (vs 30%), resulting in Cost-Efficiency ratio of 76%
(vs 76%), which continues to remain relatively high, compared to industry average of 60%.
15
ROAE was equal to 4.14% (vs 5.54%), while ROAA was equal to 0.43% (vs 0.69%), which
is considered to be low.
BALANCE SHEET (MARCH 31, 2016 vs DECEMBER 31, 2015)
Total assets were equal to $2.18BN (vs $2.14BN at 12/31/2015), relatively unchanged. The
balance sheet continued to be mainly comprised of Net Loans & leases (41% of Total
Assets), Debt Securities (18%), Securities Borrowed & Reverse Repos (10%), Cash (8%),
and Trading Assets (8%). Impaired Loans/Gross Loans were equal to 2.49% (vs 2.66%),
while Reserves for Loans/Impaired Loans were equal to 53% (vs 50%), which indicates the
mediocre loan quality, with modest loan loss coverage. In addition, credit extension
commitments totaled $850.99BN (vs $856.87BN). Total Gross Loans & Leases of $901.11BN,
mainly included Commercial Loans (49% of Loans) and Core Residential mortgage portfolio
(16%).
Illiquid assets, including other assets, intangible asset and goodwill, Net PP&E, were equal to
$192.59BN or 9% of Total Assets, which is manageable.
Majority of the total liabilities of $1.92BN, continued to be financed by Deposits (64% of
Total Liabilities), Securities Loaned and Repos (10%), Accounts Payable and Other Liabilities
of (7%), Trading Account liabilities (4%) and Derivatives (2%). Short-term borrowings were
equal to only 2% of Liabilities, and considered to be very manageable. Net Loans-to-Deposit
16
ratio was 73.55% (vs 75.02%), while Liquid Assets/Deposits and Short Term funding was
45.45% (vs 46.15%), which indicates the good level of wholesale funding & short-term
liquidity level for the bank.
CAPITAL, LIQUIDITY & LEVERAGE (MARCH 31, 2016 vs DECEMBER 31, 2015)
As of 03/31/2016, liquidity profile was excellent with total long term capital (Equity +
Subordinated Debt +Long Term Debt) of $495.62BN (vs $492.96BN), which included
Equity Capital of $262.78BN (vs $256.20BN) and Long Term Debt of $232.85BN (vs
$236.76BN). Global excess liquidity sources were equal to $525BN (vs $504BN), which
were comprised of US agencies & MBS (61% of Excess Liquidity pool) and Cash (28%).
Tier 1 Ratio was 13.00% (vs 12.90%), Total Capital Ratio was 15.90% (vs 15.70%), and
Fully phased-in Supplementary Leverage Ratio (SLR) was 6.8% (vs 6.4%), which makes
the bank a “well capitalized” bank under Basel III regulation.
During the three months ended March 31, 2016, BAC returned $2.0BN in capital to
shareholders through common and preferred stock dividends and common stock
repurchases. BAC repurchased $800MM of common stock in connection with the 2015
Comprehensive Capital Analysis and Review (CCAR) capital plan, which included a
request to repurchase $4.0BN of common stock over five quarters beginning in the second
quarter of 2015, and to maintain the quarterly common stock dividend at the current rate
of $0.05 per share. Additionally, on March 18, 2016, the Corporation announced that the Board
of Directors (the Board) authorized additional repurchases of common stock up to $800 million
outside of the scope of the 2015 CCAR capital plan to offset the share count dilution resulting
from equity incentive compensation awarded to retirement-eligible employees, to which the
Federal Reserve did not object. In connection with the additional authorization, the Corporation
repurchased $200MM.
CONCLUSION
Bank of America Corporation (A/Stable by Fitch) with total assets of $2.14TN and total equity
of $256.20BN at 12/31/2015, makes it the 12th
largest bank in the word by size of total assets.
For FY’15, Bank of America Corporation (BAC) reported net income of $15.89BN (vs
$4.83BN), an increase of 250%, over Revenues, net of interest expense, of $82.51BN (vs
$84.25BN), a decrease of only 2%, subject to widening of interest rates in the US upto 2-
2.50%. For the three months ended March 31, 2016, BAC reported net income of $2.68BN (vs
$3.10BN), a decrease of 14%, over revenues, net of interest expenses, of $19.51BN (vs
$20.91BN), a decrease of 7%. On an absolute basis, the overall level of profitability
remained practically unchanged. The impact on net interest income assuming a 100bps
increase in short-term interest rate, in the base case scenario, was equal to an incremental net
income of $4.30BN (vs $3.68BN) on the banking book, excluding trading related net interest
income. Major components of net revenues were Net Interest Income (48% of Net
Revenues), Investment and Brokerage Services Fees (16%) and Other Non-Interest
Income, including Service charges, Card income, Trading account profits, Investment
banking income and Mortgage banking income (36%). As of 12/31/2015, total assets were
17
equal to $2.14TN (vs $2.10TN), an increase of 2%, mainly comprised of Net Loans & leases
(42% of Total Assets), Debt Securities (19%), Cash (8%), Securities Borrowed & Reverse
Repos (9%) and Trading Assets (8%). Impaired Loans/Gross Loans were equal to 2.66%
(vs 3.24%), while Reserves for Loans/Impaired Loans were equal to 50% (vs 50%), with
net charge off rate of 0.58% (vs 0.57%), which indicates the mediocre loan quality, with
modest loan loss coverage and charge offs rates indicating the fairly adequate quality of
allowances realized on the balance sheet in relation to impaired loans. The Top 20 country
exposures, included country exposure to Brazil of $15.88BN (6% of Total Equity) and Italy
of $7.10BN (3%). In addition, the bank estimates range of possible losses of $0 to $2.4BN in
excess of the accrued liability related to legal proceedings and notional amount of unfunded
legally binding lending commitments, net of amounts distributed (e.g., syndicated) to other
financial institutions was $14.3BN (vs $15.7BN) or 6% of Total Equity, which could draw
down additional liquidity.
As of 12/31/2015, liquidity profile was excellent with total long term capital (Equity +
Subordinated Debt +Long Term Debt) of $492.97BN (vs $486.61BN), which included
Equity Capital of $256.20BN (vs $243.47BN) and Long Term Debt of $236.76BN (vs
$243.14BN), out of which 18% is due in 2016 (Less than 1YR), with global excess liquidity
of $504BN (vs $439BN), adequate for more than three years before required market funding.
The firm has successfully passed 2015 Comprehensive Capital Analysis and Review
(CCAR) capital plan, which included a request to repurchase $4.0BN of common stock
over five quarters beginning in the second quarter of 2015. The bank is also qualified as a
Global systemically important bank (GSIBs), which subjects the bank to Total Loss Absorption
Capacity (TLAC) requirements like other major global banks, which is expected to be
implemented by January 2019. Government liquidity support is also waning for major US
banks in a potential crisis, hence lesser level of capital support is expected and higher
investment, capital & leverage restrictions are implemented from regulators, amidst Dodd
Frank bill, including Volcker rule, which restricts illiquid investments, and furthermore lack
of government initiative is expected to bailout larger US banks, post Lehman Brother
bankruptcy in 2008.
BAC meets the recommended SNBNY guidelines as stated below:
18
Bank of America Corporation
3/31/2016
Regulatory Tier 1 Ratio 13.00 8% (Minimum)
Regulatory Total Capital Ratio 15.90 10% (Minimum)
Impared Loans/Total Gross Loans 2.49 2.5% (Minimum)
Net Loans/Deposits 73.55 100% (Maximum)
Liquid Assets/Deposits + ST Funds 45.45 30% (Minimum)
Yearly Capital Decline Trigger Test (3 Years) Y Yes/No
3 Year Income Decline Trigger Test Y Yes/No
Over the past three (3) fiscal years BAC has:
-Passed the SNBNY CAGR test with a CAGR net income growth rate of 17.89% (SNBNY
proposed guideline of no greater than a cumulative decline of 10% over that 3 year period).
-Passed the regulatory capital test (guideline of maximum 5% decline for each year), as
regulatory capital has grown by 6% in FY’2015, 4% in 2014, and 2% in 2013, over the past
three years respectively.
BAC is rated “investment grade” and credit limits are recommended as presented based on the
above analysis.
19

More Related Content

What's hot

Corporate Presentation for Bladex - 4Q21
Corporate Presentation for Bladex - 4Q21Corporate Presentation for Bladex - 4Q21
Corporate Presentation for Bladex - 4Q21
Bladex
 
20170421 Gator Financial Industry Presentation
20170421 Gator Financial Industry Presentation20170421 Gator Financial Industry Presentation
20170421 Gator Financial Industry Presentation
Derek Pilecki
 
Bladex's investor presentation 3 q15
Bladex's investor presentation 3 q15Bladex's investor presentation 3 q15
Bladex's investor presentation 3 q15
Bladex
 
Bladex's Investor Presentation 4Q15
Bladex's Investor Presentation 4Q15Bladex's Investor Presentation 4Q15
Bladex's Investor Presentation 4Q15
Bladex
 
Blx webcast presentation 2 q19
Blx webcast presentation 2 q19Blx webcast presentation 2 q19
Blx webcast presentation 2 q19
Bladex
 
Bladex's investor presentation 2 q15
Bladex's investor presentation 2 q15Bladex's investor presentation 2 q15
Bladex's investor presentation 2 q15
Bladex
 
Banco Pine - Institutional Presentation 2Q12
Banco Pine - Institutional Presentation 2Q12Banco Pine - Institutional Presentation 2Q12
Banco Pine - Institutional Presentation 2Q12Banco Pine
 
Gator Capital: Beyond Banks Presentation
Gator Capital: Beyond Banks PresentationGator Capital: Beyond Banks Presentation
Gator Capital: Beyond Banks Presentation
Derek Pilecki
 
ameriprise 2Q08_Appendix
ameriprise 2Q08_Appendixameriprise 2Q08_Appendix
ameriprise 2Q08_Appendixfinance43
 
Webinar Slides: Consolidation Considerations - How to Apply the New Standards
Webinar Slides: Consolidation Considerations - How to Apply the New StandardsWebinar Slides: Consolidation Considerations - How to Apply the New Standards
Webinar Slides: Consolidation Considerations - How to Apply the New Standards
MHM (Mayer Hoffman McCann P.C.)
 
Investor presentation us$350 million bond issuance roadshow
Investor presentation   us$350 million bond issuance roadshowInvestor presentation   us$350 million bond issuance roadshow
Investor presentation us$350 million bond issuance roadshow
Bladex
 
Bladex Corporate Presentation 3Q2021
Bladex Corporate Presentation 3Q2021Bladex Corporate Presentation 3Q2021
Bladex Corporate Presentation 3Q2021
Bladex
 
Ideas conference, three part advisors, llc (chicago, illinois) corporate pres...
Ideas conference, three part advisors, llc (chicago, illinois) corporate pres...Ideas conference, three part advisors, llc (chicago, illinois) corporate pres...
Ideas conference, three part advisors, llc (chicago, illinois) corporate pres...
Bladex
 
2Q19 Investor Deck
2Q19 Investor Deck 2Q19 Investor Deck
2Q19 Investor Deck
BancofCalifornia
 
Presentacion corporativa 1 q21 ingles
Presentacion corporativa   1 q21 inglesPresentacion corporativa   1 q21 ingles
Presentacion corporativa 1 q21 ingles
Bladex
 

What's hot (16)

Corporate Presentation for Bladex - 4Q21
Corporate Presentation for Bladex - 4Q21Corporate Presentation for Bladex - 4Q21
Corporate Presentation for Bladex - 4Q21
 
20170421 Gator Financial Industry Presentation
20170421 Gator Financial Industry Presentation20170421 Gator Financial Industry Presentation
20170421 Gator Financial Industry Presentation
 
Bladex's investor presentation 3 q15
Bladex's investor presentation 3 q15Bladex's investor presentation 3 q15
Bladex's investor presentation 3 q15
 
Bladex's Investor Presentation 4Q15
Bladex's Investor Presentation 4Q15Bladex's Investor Presentation 4Q15
Bladex's Investor Presentation 4Q15
 
Blx webcast presentation 2 q19
Blx webcast presentation 2 q19Blx webcast presentation 2 q19
Blx webcast presentation 2 q19
 
Bladex's investor presentation 2 q15
Bladex's investor presentation 2 q15Bladex's investor presentation 2 q15
Bladex's investor presentation 2 q15
 
Banco Pine - Institutional Presentation 2Q12
Banco Pine - Institutional Presentation 2Q12Banco Pine - Institutional Presentation 2Q12
Banco Pine - Institutional Presentation 2Q12
 
Gator Capital: Beyond Banks Presentation
Gator Capital: Beyond Banks PresentationGator Capital: Beyond Banks Presentation
Gator Capital: Beyond Banks Presentation
 
ameriprise 2Q08_Appendix
ameriprise 2Q08_Appendixameriprise 2Q08_Appendix
ameriprise 2Q08_Appendix
 
Webinar Slides: Consolidation Considerations - How to Apply the New Standards
Webinar Slides: Consolidation Considerations - How to Apply the New StandardsWebinar Slides: Consolidation Considerations - How to Apply the New Standards
Webinar Slides: Consolidation Considerations - How to Apply the New Standards
 
Investor presentation us$350 million bond issuance roadshow
Investor presentation   us$350 million bond issuance roadshowInvestor presentation   us$350 million bond issuance roadshow
Investor presentation us$350 million bond issuance roadshow
 
Bladex Corporate Presentation 3Q2021
Bladex Corporate Presentation 3Q2021Bladex Corporate Presentation 3Q2021
Bladex Corporate Presentation 3Q2021
 
Ideas conference, three part advisors, llc (chicago, illinois) corporate pres...
Ideas conference, three part advisors, llc (chicago, illinois) corporate pres...Ideas conference, three part advisors, llc (chicago, illinois) corporate pres...
Ideas conference, three part advisors, llc (chicago, illinois) corporate pres...
 
3 q10 earnings_press_release
3 q10 earnings_press_release3 q10 earnings_press_release
3 q10 earnings_press_release
 
2Q19 Investor Deck
2Q19 Investor Deck 2Q19 Investor Deck
2Q19 Investor Deck
 
Presentacion corporativa 1 q21 ingles
Presentacion corporativa   1 q21 inglesPresentacion corporativa   1 q21 ingles
Presentacion corporativa 1 q21 ingles
 

Similar to BOA Credit Research (Financial Institutions) 2016

JPMorgan Chase Analysis Project_WC
JPMorgan Chase Analysis Project_WCJPMorgan Chase Analysis Project_WC
JPMorgan Chase Analysis Project_WCWyatt A. Chartrand
 
UST CASE STUDY
UST CASE STUDYUST CASE STUDY
UST CASE STUDY
Brooke Curtis
 
CFA final report SYBT
CFA final report SYBTCFA final report SYBT
CFA final report SYBT
Jinglin Li
 
CFA_Final Report_SYBT
CFA_Final Report_SYBTCFA_Final Report_SYBT
CFA_Final Report_SYBTHunter Willis
 
Blx corporate presentation 2 q17 english
Blx corporate presentation 2 q17 englishBlx corporate presentation 2 q17 english
Blx corporate presentation 2 q17 english
Bladex
 
Blx corporate presentation 1q17 bd conf london 3 4 may 17
Blx corporate presentation 1q17 bd conf london 3 4 may 17Blx corporate presentation 1q17 bd conf london 3 4 may 17
Blx corporate presentation 1q17 bd conf london 3 4 may 17
Bladex
 
Presentacion Corporativa - 1Q2022 ingles.pdf
Presentacion Corporativa - 1Q2022 ingles.pdfPresentacion Corporativa - 1Q2022 ingles.pdf
Presentacion Corporativa - 1Q2022 ingles.pdf
Bladex
 
Presentacion Corporativa - 1Q2022 ingles.pdf
Presentacion Corporativa - 1Q2022 ingles.pdfPresentacion Corporativa - 1Q2022 ingles.pdf
Presentacion Corporativa - 1Q2022 ingles.pdf
Bladex
 
Presentacion Corporativa - 1Q22 ingles.pdf
Presentacion Corporativa - 1Q22 ingles.pdfPresentacion Corporativa - 1Q22 ingles.pdf
Presentacion Corporativa - 1Q22 ingles.pdf
Bladex
 
Ideas conference, three part advisors, llc (chicago, illinois) presentación c...
Ideas conference, three part advisors, llc (chicago, illinois) presentación c...Ideas conference, three part advisors, llc (chicago, illinois) presentación c...
Ideas conference, three part advisors, llc (chicago, illinois) presentación c...
Bladex
 
Blx corporate presentation 1 q17 english
Blx corporate presentation 1 q17 englishBlx corporate presentation 1 q17 english
Blx corporate presentation 1 q17 english
Bladex
 
10th annual best of uncovered 2015, singular research (los angeles, californi...
10th annual best of uncovered 2015, singular research (los angeles, californi...10th annual best of uncovered 2015, singular research (los angeles, californi...
10th annual best of uncovered 2015, singular research (los angeles, californi...
Bladex
 
Bladex's Investor Presentation 1Q16 (english)
Bladex's Investor Presentation 1Q16 (english)Bladex's Investor Presentation 1Q16 (english)
Bladex's Investor Presentation 1Q16 (english)
Bladex
 
Presentacion Corporativa - 2Q22 ingles.pdf
Presentacion Corporativa - 2Q22 ingles.pdfPresentacion Corporativa - 2Q22 ingles.pdf
Presentacion Corporativa - 2Q22 ingles.pdf
Bladex
 
Blx corporate presentation 2 q16 english
Blx corporate presentation   2 q16 englishBlx corporate presentation   2 q16 english
Blx corporate presentation 2 q16 english
Bladex
 
Financial institutions and Markets Group Assignment 4.docx
Financial institutions and Markets Group Assignment 4.docxFinancial institutions and Markets Group Assignment 4.docx
Financial institutions and Markets Group Assignment 4.docx
YaminKyawLinLin
 
Npa
NpaNpa
Bladex Corporate Presentation 2Q16 english
Bladex Corporate Presentation  2Q16 englishBladex Corporate Presentation  2Q16 english
Bladex Corporate Presentation 2Q16 english
Bladex
 

Similar to BOA Credit Research (Financial Institutions) 2016 (20)

JPMorgan Chase Analysis Project_WC
JPMorgan Chase Analysis Project_WCJPMorgan Chase Analysis Project_WC
JPMorgan Chase Analysis Project_WC
 
UST CASE STUDY
UST CASE STUDYUST CASE STUDY
UST CASE STUDY
 
CFA final report SYBT
CFA final report SYBTCFA final report SYBT
CFA final report SYBT
 
CFA_Final Report_SYBT
CFA_Final Report_SYBTCFA_Final Report_SYBT
CFA_Final Report_SYBT
 
Blx corporate presentation 2 q17 english
Blx corporate presentation 2 q17 englishBlx corporate presentation 2 q17 english
Blx corporate presentation 2 q17 english
 
Blx corporate presentation 1q17 bd conf london 3 4 may 17
Blx corporate presentation 1q17 bd conf london 3 4 may 17Blx corporate presentation 1q17 bd conf london 3 4 may 17
Blx corporate presentation 1q17 bd conf london 3 4 may 17
 
Presentacion Corporativa - 1Q2022 ingles.pdf
Presentacion Corporativa - 1Q2022 ingles.pdfPresentacion Corporativa - 1Q2022 ingles.pdf
Presentacion Corporativa - 1Q2022 ingles.pdf
 
Presentacion Corporativa - 1Q2022 ingles.pdf
Presentacion Corporativa - 1Q2022 ingles.pdfPresentacion Corporativa - 1Q2022 ingles.pdf
Presentacion Corporativa - 1Q2022 ingles.pdf
 
Presentacion Corporativa - 1Q22 ingles.pdf
Presentacion Corporativa - 1Q22 ingles.pdfPresentacion Corporativa - 1Q22 ingles.pdf
Presentacion Corporativa - 1Q22 ingles.pdf
 
Ideas conference, three part advisors, llc (chicago, illinois) presentación c...
Ideas conference, three part advisors, llc (chicago, illinois) presentación c...Ideas conference, three part advisors, llc (chicago, illinois) presentación c...
Ideas conference, three part advisors, llc (chicago, illinois) presentación c...
 
Blx corporate presentation 1 q17 english
Blx corporate presentation 1 q17 englishBlx corporate presentation 1 q17 english
Blx corporate presentation 1 q17 english
 
AFP_Sept 2015_v3
AFP_Sept 2015_v3AFP_Sept 2015_v3
AFP_Sept 2015_v3
 
10th annual best of uncovered 2015, singular research (los angeles, californi...
10th annual best of uncovered 2015, singular research (los angeles, californi...10th annual best of uncovered 2015, singular research (los angeles, californi...
10th annual best of uncovered 2015, singular research (los angeles, californi...
 
Bladex's Investor Presentation 1Q16 (english)
Bladex's Investor Presentation 1Q16 (english)Bladex's Investor Presentation 1Q16 (english)
Bladex's Investor Presentation 1Q16 (english)
 
Presentacion Corporativa - 2Q22 ingles.pdf
Presentacion Corporativa - 2Q22 ingles.pdfPresentacion Corporativa - 2Q22 ingles.pdf
Presentacion Corporativa - 2Q22 ingles.pdf
 
Blx corporate presentation 2 q16 english
Blx corporate presentation   2 q16 englishBlx corporate presentation   2 q16 english
Blx corporate presentation 2 q16 english
 
Financial institutions and Markets Group Assignment 4.docx
Financial institutions and Markets Group Assignment 4.docxFinancial institutions and Markets Group Assignment 4.docx
Financial institutions and Markets Group Assignment 4.docx
 
SLAM brochure Dec 2016
SLAM brochure Dec 2016SLAM brochure Dec 2016
SLAM brochure Dec 2016
 
Npa
NpaNpa
Npa
 
Bladex Corporate Presentation 2Q16 english
Bladex Corporate Presentation  2Q16 englishBladex Corporate Presentation  2Q16 english
Bladex Corporate Presentation 2Q16 english
 

BOA Credit Research (Financial Institutions) 2016

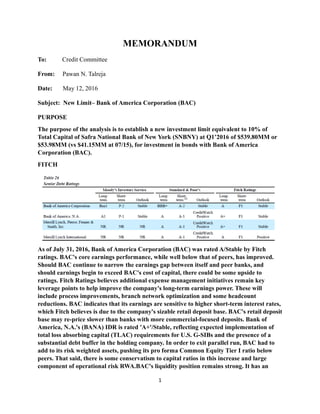
  • 1. MEMORANDUM To: Credit Committee From: Pawan N. Talreja Date: May 12, 2016 Subject: New Limit– Bank of America Corporation (BAC) PURPOSE The purpose of the analysis is to establish a new investment limit equivalent to 10% of Total Capital of Safra National Bank of New York (SNBNY) at Q1’2016 of $539.80MM or $53.98MM (vs $41.15MM at 07/15), for investment in bonds with Bank of America Corporation (BAC). FITCH As of July 31, 2016, Bank of America Corporation (BAC) was rated A/Stable by Fitch ratings. BAC's core earnings performance, while well below that of peers, has improved. Should BAC continue to narrow the earnings gap between itself and peer banks, and should earnings begin to exceed BAC's cost of capital, there could be some upside to ratings. Fitch Ratings believes additional expense management initiatives remain key leverage points to help improve the company's long-term earnings power. These will include process improvements, branch network optimization and some headcount reductions. BAC indicates that its earnings are sensitive to higher short-term interest rates, which Fitch believes is due to the company's sizable retail deposit base. BAC's retail deposit base may re-price slower than banks with more commercial-focused deposits. Bank of America, N.A.'s (BANA) IDR is rated 'A+'/Stable, reflecting expected implementation of total loss absorbing capital (TLAC) requirements for U.S. G-SIBs and the presence of a substantial debt buffer in the holding company. In order to exit parallel run, BAC had to add to its risk weighted assets, pushing its pro forma Common Equity Tier I ratio below peers. That said, there is some conservatism to capital ratios in this increase and large component of operational risk RWA.BAC's liquidity position remains strong. It has an 1
  • 2. abundance of low cost retail deposits, which are treated favorably under various regulatory rules such as the LCR and SLR. COMPANY OVERVIEW Bank of America Corporation, incorporated on July 31, 1998, is a bank holding company (BHC) and a financial holding company. The Company is a financial institution, serving individual consumers, small- and middle-market businesses, institutional investors, corporations 2
  • 3. and governments with a range of banking, investing, asset management and other financial and risk management products and services. The Company's segments include Consumer Banking, Global Wealth & Investment Management (GWIM), Global Banking, Global Markets, Legacy Assets & Servicing (LAS) and All Other. Through its banking and various nonbank subsidiaries throughout the United States and international markets, the Company provides a range of banking and nonbank financial services and products. Consumer Banking (37% of Net Revenues) The Company's Consumer Banking segment offers a range of credit, banking and investment products and services to consumers and small businesses. Consumer Banking product offerings include traditional savings accounts, money market savings accounts, certificate of deposits (CDs) and individual retirement accounts (IRAs), noninterest- and interest- bearing checking accounts, investment accounts and products, as well as credit and debit cards, residential mortgages and home equity loans, and direct and indirect loans to consumers and small businesses in the United States. The franchise network includes approximately 4,700 financial centers, over 16,000 automated teller machines (ATMs), across the nation call centers, and online and mobile platforms. Global Wealth & Investment Management (22%) The Company's GWIM segment provides tailored solutions for clients through a set of investment management, brokerage, banking and retirement products. GWIM also provides wealth management solutions, as well as customized solutions for clients' wealth structuring, investment management, trust and banking needs, including specialty asset management services. Global Banking (20%) The Company's Global Banking segment provides a range of lending-related products and services, integrated working capital management and treasury solutions to clients, and underwriting and advisory services through a network of offices and client relationship teams. Global Banking's lending products and services include commercial loans, leases, commitment facilities, trade finance, real estate lending and asset-based lending. Global Banking's treasury solutions business includes treasury management, foreign exchange and short-term investing options. Global Banking also provides investment banking products to clients, such as debt and equity underwriting and distribution, and merger-related and other advisory services. Global Markets (18%) The Company's Global Markets segment offers sales and trading services, including research, to institutional clients across fixed-income, credit, currency, commodity and equity businesses. Global Markets product coverage includes securities and derivative products in both the primary and secondary markets. Global Markets provides market-making, financing, securities clearing, settlement and custody services across the globe to institutional investor clients in support of their investing and trading activities. Global Markets also works with 3
  • 4. commercial and corporate clients to provide risk management products using interest rate, equity, credit, currency and commodity derivatives, foreign exchange, fixed-income and mortgage- related products. Global Markets also manages risk in a range of financial products, including government securities, equity and equity-linked securities, high-grade and high-yield corporate debt securities, syndicated loans, mortgage-backed securities (MBS), commodities and asset- backed securities (ABS). Legacy Assets & Servicing (4%) The Company's LAS segment is engaged in providing mortgage servicing activities related to residential first mortgage and home equity loans serviced for others and loans held by the Company, including loans that have been designated as the LAS Portfolios, and manages certain legacy exposures related to mortgage origination, sales and servicing activities (litigation, representations and warranties). LAS segment also includes the results of mortgage servicing rights (MSR) activities, including net hedge results. All Other (-1%) The Company's All Other operations consists of asset and liability management (ALM) activities, equity investments, the international consumer card business, liquidating businesses, residual expense allocations and other. ALM activities encompass certain residential mortgages, debt securities, interest rate and foreign currency risk management activities. Additionally, certain residential mortgage loans that are managed by LAS are held in All Other segment. 4
  • 5. As of 03/31/2016, total Assets under Management (AUM) was equal to $891BN (vs $917BN), while total client balances, including Brokerage assets and assets under custody (AUC), was equal to $2.46TN (vs $2.51TN). MAJOR DEVELOPMENTS On July 22, 2015, Chief Financial Officer (CFO) Bruce Thompson, decided to step down as chief risk officer (CRO) and chief financial officer (CFO). On March 5, 2015, New York state appeals approved Bank of America Corp's $8.5BN settlement with mortgage securities investors in its entirety. On March 11, 2015, Federal Reserve Board (Fed) informed the company that it completed its 2015 Comprehensive Capital Analysis and Review (CCAR) and it did not object to the company's capital plan for the period from the second quarter of 2015 through the second quarter of 2016. This plan includes the $4BN stock repurchase program and maintaining the common stock dividend at the current rate of $0.05 per share per quarter. Fed also asked Bank of America to submit an additional capital plan by Sept. 30, addressing certain weaknesses identified in the company's capital planning process. If Bank of America does not make material progress in addressing these key weaknesses, the Fed may restrict the company's capital distributions. On May 20, 2015, four banks, including Bank of America Corporation (BAC) pleaded guilty to trying to manipulate foreign exchange rates and, with two others, were fined nearly $6 billion in another settlement in a global probe. 5
  • 6. FINANCIALANALYSIS (DECEMBER 31, 2015 vs DECEMBER 31, 2014) Bank of America Corporation ($ Millions) 12/31/2013 12/31/2014 12/31/2015 3/31 Total Assets $2,102,273.00 $2,104,534.00 $2,144,316.00 $2,143 Gross Loans $939,595.00 $894,227.00 $910,454.00 $887 Total Securities $762,761.00 $816,751.00 $826,004.00 $838 Net Income $11,431.00 $4,833.00 $15,888.00 $3,3 ROAA 0.53 0.23 0.74 0 ROAE 4.89 2.03 6.31 5 Growth of Gross Loans 1.33 -4.83 1.81 -0 Growth of Total Assets -4.87 0.11 1.89 1 Regulatory Tier 1 Capital $161,456.00 $168,973.00 $180,778.00 $173 Regulatory Tier 1 Ratio 12.44 13.40 12.90 1 Regulatory Total Capital $200,281.00 $208,670.00 $220,676.00 $214 Regulatory Total Capital Ratio 15.44 16.50 15.70 1 Net Loans / Deposits 82.39 78.63 75.02 7 Impaired Loans / Gross Loans 3.89 3.24 2.66 3 Reserves for Impaired Loans / Gross loans 1.85 1.61 1.34 1 Net Charge offs / Ave Gross Loans 0.86 0.57 0.58 0 Liquid Assets / Deposits and ST Funding 43.47 47.65 46.15 4 Net Interest Margin 1.95 1.86 1.82 1 Derivatives $37,407.00 $46,909.00 $38,450.00 $52, Source: Fitch Peer Group Analysis 6
  • 7. INCOME STATEMENT For FY’15, Bank of America Corporation (BAC) reported net income of $15.89BN (vs $4.83BN), an increase of 250%, over Revenues, net of interest expense, of $82.61BN (vs 7
  • 8. $84.25BN), a decrease of only 2%. The increase in net income was mainly driven by a decline other general operating expenses of $9.34BN (vs $25.30BN), as the category decreased by $16.0BN, primarily due to a decrease of $15.2BN in litigation expense which was primarily related to previously disclosed legacy mortgage-related matters and other litigation charges in 2014, as well as other lower operating costs in Legacy Asset and Servicing (LAS) business. Major components of net revenues, relatively unchanged, were as follows: -Net Interest Income of $39.26BN (vs $39.95BN) or 48% of Net Revenues. -Investment and Brokerage Services Fees of $13.34BN (vs $13.28BN) or 16%. -Other Non-Interest Income, including Service charges, Card income, Trading account profits, Investment banking income and Mortgage banking income of $29.93BN (vs $30.92BN) or 36%. Recurring fee-based and banking revenues comprised of approximately 77% of Total Revenues and were mainly sourced from US (87% of Net Revenues). Compensation expenses/Net revenues were equal to 39.77% (vs 40.09%), while Other Operating Expenses/Net Revenues were equal to 29.44% (vs 49.06%), resulting in Cost-Efficiency ratio of 69.21% (vs 89.15%), which is relatively high, mainly due to high operating expenses, including legal expenses, while compensation ratio is average for a major diversified bank. The firm has recently initiated a variety of employee costs cuts initiatives affecting global technology, operations and some investment banking and trading groups, though the exact future impact of costs cuts has not been disclosed. Net-Interest-Margin (NIM) ratio was equal to 1.82% (vs 1.86%), which is average. ROAE was equal to 6.31% (vs 2.03 %), while ROAA was equal to 0.74% (vs 0.23%), which is considered to be low. 8
  • 9. BALANCE SHEET As of 12/31/2015, total assets were equal to $2.14TN (vs $2.10TN), an increase of 2%, which was mainly affected by increase in Cash & Cash equivalents of $159.36BN (vs $138.59BN), Debt Securities of $407.00BN (vs $380.46BN), and Net Loans & Leases of $890.77BN (vs $866.97BN). The balance sheet was mainly comprised of Net Loans & leases (42% of Total Assets), Debt Securities (19%), Securities Borrowed & Reverse Repos (9%), Cash (8%), and Trading Assets (8%). Impaired Loans/Gross Loans were equal to 2.66% (vs 3.24%), while Reserves for Loans/Impaired Loans were equal to 50% (vs 50%), with net charge off rate of 0.58% (vs 0.57%), which indicates the mediocre loan quality, with modest loan loss coverage and charge offs rates, which are slightly above average, indicating the fairly adequate quality of allowances realized on the balance sheet in relation to impaired loans. 9
  • 10. The Gross Loans Portfolio of $903.00BN, was mainly comprised of Consumer Loans of $466.17BN (52% of Loans) and Commercial Loans of $446.83BN (48%): The commercial credit exposure by industry, is summarized below, and the largest exposure by industry included the Energy sector commercial utilized credit exposure of $21.27BN (8% of Total Equity) and $43.81BN commercial committed (17%), which has been volatile in the past year. 10
  • 11. Total debt securities of $406.43BN were mainly comprised of MBS (67% of Debt Securities). The Top 20 country exposures, is summarized below, with country exposure to Brazil of $15.88BN (6% of Total Equity) and Italy of $7.10BN (3%): 11
  • 12. Illiquid assets, including other assets, intangible asset and goodwill, Net PP&E, was equal to $191.68BN or 9% of Total Assets. Majority of the balance sheet continued to be financed by Deposits of $1.20TN (64% of Total Liabilities), Federal Funds purchased and securities loaned or sold under repurchase agreements of $174.29BN (9%), Accounts Payable and Other Liabilities of $146.29BN (8%), and Trading Liabilities of $66.96BN (4%). Out of total deposits of $1.20TN, majority were interest bearing deposits (64% of Total Deposits) and US deposits (94%). Net Loans-to- Deposit ratio was 75.02% (vs 78.63%), while Liquid Assets/Deposits and Short Term funding was 46.15% (vs 47.65%), which indicates the good level of wholesale funding & short-term liquidity level for the bank. 12
  • 13. CAPITAL, LIQUIDITY & LEVERAGE As of 12/31/2015, liquidity profile was excellent with total long term capital (Equity + Subordinated Debt +Long Term Debt) of $492.97BN (vs $486.61BN), which included Equity Capital of $256.20BN (vs $243.47BN), that increased mainly due to positive profitability of $15.88BN during FY’15 & issuance of preferred shares of $2.96BN, offset by dividends of $3.57BN, and Long Term Debt of $236.76BN (vs $243.14BN), out of which 18% is due in 2016 (Less than 1YR), 17% in 2017 (Less than 2 YR), while the residual 65% was due thereafter. Global excess liquidity sources, which was substantially comprised of High Quality Liquid Assets (HQLA) was equal to $504BN (vs $439BN), adequate for more than three years before required market funding. The bank subsidiaries can also generate incremental liquidity by pledging a range of other unencumbered loans and securities to certain Federal Home Loan Banks (FHLBs) and the Federal Reserve Discount Window. The borrowing capacity against this pool of specifically- identified eligible assets was $252 billion (vs $214 billion). Tier 1 Ratio was 12.90% (vs 13.40%), Total Capital Ratio was 15.70% (vs 16.50%), and Fully phased-in Supplementary Leverage Ratio (SLR) was 6.4% (vs 5.9%), which makes the bank a “well capitalized” bank under Basel III regulation. The bank is also qualified as a Global systemically important bank (GSIB), which subjects the bank to Total Loss Absorption Capacity (TLAC) requirements like other major global banks, which is expected to be implemented by January 2019. Total Daily VAR using a 95% confidence interval was equal to $85MM (vs $120MM) or 0.03% of Total Equity, which is very manageable. 13
  • 14. BAC passed the 2015 bank stress test round after resubmitting its capital plan and persuading the Federal Reserve it improved internal controls. The Fed advised BAC that: “The firm must continue to make steady, demonstrable progress prior to the 2016 CCAR cycle toward establishing and maintaining sound risk-management and capital-planning processes that are commensurate with the size and complexity of its operations.” OFF BALANCE SHEET The off-balance sheet liabilities, including lending commitments, guarantees and other indemnifications are summarized in table above with a major concentration in lending related commitments of $859.85BN (336% of Total Equity). The notional amount of unfunded legally binding lending commitments, net of amounts distributed (e.g., syndicated) to other financial institutions was $14.3BN (vs $15.7BN) or 6% of Total Equity. The additional reserve for unfunded lending commitment was $646MM, an increase of $118MM mainly attributable to higher unfunded commitments. Litigation-related expenses were equal to $1.2BN for FY’2015, compared to $16.4BN for 2014. Management currently estimates the aggregate range of possible loss is $0 to $2.4 billion in excess of the accrued 14
  • 15. liability (if any) related to legal proceedings. During FY’2014, 2013, and 2012, the firm incurred $2.9BN, $11.1BN and $5.0BN, respectively, of legal expenses, partly due to legacy Bear Stearns mortgage assets. JPM is on track to meet its mandate to provide billions of dollars in consumer relief to struggling homeowners as part of a settlement it reached over bad residential mortgage-backed securities it sold before the financial crisis. There was zero net derivative liability. As of FYE’15, the impact on net interest income assuming a 100bps increase in short-term interest rate, in the base case scenario, was equal to an incremental net income of $4.30BN (vs $3.68BN) on the banking book. The additional potential stress scenarios are delineated below: INTERIM ANALYSIS (FIRST QUARTER 2016 ENDING MARCH 31, 2016) INCOME STATEMENT (MARCH 31, 2016 vs March 31, 2015) For the three months ended March 31, 2016, BAC reported net income of $2.68BN (vs $3.10BN), a decrease of 14%, over revenues, net of interest expenses, of $19.51BN (vs $20.91BN), a decrease of 7%. On an absolute basis, the overall level of profitability remained practically unchanged. Majority of net revenues continued to stem from Net Interest Income of $9.17BN (47% of Net Revenues) related to banking activities, Investment and Brokerage services of $3.18BN (16%), and Other Non-Interest Income, including service charges, card income, trading account profits and investment banking income of $7.16BN (37%). In addition, contingent maximum legal expenses above existing provisions, related to mortgage representation & warranties legal proceedings, continued to be upto $2BN. In addition, Asset under management (AUM) declined to $890.66BN (vs $917.26BN) and total client balances, including brokerage assets of $1.06TN (vs $1.08TN), declined to $2.46TN (vs $2.51TN), which contributed to moderately lower profitability in the brokerage, wealth & investment management and custody businesses, via lower operating leverage for the quarter. Compensation expenses/Net Revenues was equal to 45% (vs 46%), while Operating Expenses/Net Revenues was equal to 31% (vs 30%), resulting in Cost-Efficiency ratio of 76% (vs 76%), which continues to remain relatively high, compared to industry average of 60%. 15
  • 16. ROAE was equal to 4.14% (vs 5.54%), while ROAA was equal to 0.43% (vs 0.69%), which is considered to be low. BALANCE SHEET (MARCH 31, 2016 vs DECEMBER 31, 2015) Total assets were equal to $2.18BN (vs $2.14BN at 12/31/2015), relatively unchanged. The balance sheet continued to be mainly comprised of Net Loans & leases (41% of Total Assets), Debt Securities (18%), Securities Borrowed & Reverse Repos (10%), Cash (8%), and Trading Assets (8%). Impaired Loans/Gross Loans were equal to 2.49% (vs 2.66%), while Reserves for Loans/Impaired Loans were equal to 53% (vs 50%), which indicates the mediocre loan quality, with modest loan loss coverage. In addition, credit extension commitments totaled $850.99BN (vs $856.87BN). Total Gross Loans & Leases of $901.11BN, mainly included Commercial Loans (49% of Loans) and Core Residential mortgage portfolio (16%). Illiquid assets, including other assets, intangible asset and goodwill, Net PP&E, were equal to $192.59BN or 9% of Total Assets, which is manageable. Majority of the total liabilities of $1.92BN, continued to be financed by Deposits (64% of Total Liabilities), Securities Loaned and Repos (10%), Accounts Payable and Other Liabilities of (7%), Trading Account liabilities (4%) and Derivatives (2%). Short-term borrowings were equal to only 2% of Liabilities, and considered to be very manageable. Net Loans-to-Deposit 16
  • 17. ratio was 73.55% (vs 75.02%), while Liquid Assets/Deposits and Short Term funding was 45.45% (vs 46.15%), which indicates the good level of wholesale funding & short-term liquidity level for the bank. CAPITAL, LIQUIDITY & LEVERAGE (MARCH 31, 2016 vs DECEMBER 31, 2015) As of 03/31/2016, liquidity profile was excellent with total long term capital (Equity + Subordinated Debt +Long Term Debt) of $495.62BN (vs $492.96BN), which included Equity Capital of $262.78BN (vs $256.20BN) and Long Term Debt of $232.85BN (vs $236.76BN). Global excess liquidity sources were equal to $525BN (vs $504BN), which were comprised of US agencies & MBS (61% of Excess Liquidity pool) and Cash (28%). Tier 1 Ratio was 13.00% (vs 12.90%), Total Capital Ratio was 15.90% (vs 15.70%), and Fully phased-in Supplementary Leverage Ratio (SLR) was 6.8% (vs 6.4%), which makes the bank a “well capitalized” bank under Basel III regulation. During the three months ended March 31, 2016, BAC returned $2.0BN in capital to shareholders through common and preferred stock dividends and common stock repurchases. BAC repurchased $800MM of common stock in connection with the 2015 Comprehensive Capital Analysis and Review (CCAR) capital plan, which included a request to repurchase $4.0BN of common stock over five quarters beginning in the second quarter of 2015, and to maintain the quarterly common stock dividend at the current rate of $0.05 per share. Additionally, on March 18, 2016, the Corporation announced that the Board of Directors (the Board) authorized additional repurchases of common stock up to $800 million outside of the scope of the 2015 CCAR capital plan to offset the share count dilution resulting from equity incentive compensation awarded to retirement-eligible employees, to which the Federal Reserve did not object. In connection with the additional authorization, the Corporation repurchased $200MM. CONCLUSION Bank of America Corporation (A/Stable by Fitch) with total assets of $2.14TN and total equity of $256.20BN at 12/31/2015, makes it the 12th largest bank in the word by size of total assets. For FY’15, Bank of America Corporation (BAC) reported net income of $15.89BN (vs $4.83BN), an increase of 250%, over Revenues, net of interest expense, of $82.51BN (vs $84.25BN), a decrease of only 2%, subject to widening of interest rates in the US upto 2- 2.50%. For the three months ended March 31, 2016, BAC reported net income of $2.68BN (vs $3.10BN), a decrease of 14%, over revenues, net of interest expenses, of $19.51BN (vs $20.91BN), a decrease of 7%. On an absolute basis, the overall level of profitability remained practically unchanged. The impact on net interest income assuming a 100bps increase in short-term interest rate, in the base case scenario, was equal to an incremental net income of $4.30BN (vs $3.68BN) on the banking book, excluding trading related net interest income. Major components of net revenues were Net Interest Income (48% of Net Revenues), Investment and Brokerage Services Fees (16%) and Other Non-Interest Income, including Service charges, Card income, Trading account profits, Investment banking income and Mortgage banking income (36%). As of 12/31/2015, total assets were 17
  • 18. equal to $2.14TN (vs $2.10TN), an increase of 2%, mainly comprised of Net Loans & leases (42% of Total Assets), Debt Securities (19%), Cash (8%), Securities Borrowed & Reverse Repos (9%) and Trading Assets (8%). Impaired Loans/Gross Loans were equal to 2.66% (vs 3.24%), while Reserves for Loans/Impaired Loans were equal to 50% (vs 50%), with net charge off rate of 0.58% (vs 0.57%), which indicates the mediocre loan quality, with modest loan loss coverage and charge offs rates indicating the fairly adequate quality of allowances realized on the balance sheet in relation to impaired loans. The Top 20 country exposures, included country exposure to Brazil of $15.88BN (6% of Total Equity) and Italy of $7.10BN (3%). In addition, the bank estimates range of possible losses of $0 to $2.4BN in excess of the accrued liability related to legal proceedings and notional amount of unfunded legally binding lending commitments, net of amounts distributed (e.g., syndicated) to other financial institutions was $14.3BN (vs $15.7BN) or 6% of Total Equity, which could draw down additional liquidity. As of 12/31/2015, liquidity profile was excellent with total long term capital (Equity + Subordinated Debt +Long Term Debt) of $492.97BN (vs $486.61BN), which included Equity Capital of $256.20BN (vs $243.47BN) and Long Term Debt of $236.76BN (vs $243.14BN), out of which 18% is due in 2016 (Less than 1YR), with global excess liquidity of $504BN (vs $439BN), adequate for more than three years before required market funding. The firm has successfully passed 2015 Comprehensive Capital Analysis and Review (CCAR) capital plan, which included a request to repurchase $4.0BN of common stock over five quarters beginning in the second quarter of 2015. The bank is also qualified as a Global systemically important bank (GSIBs), which subjects the bank to Total Loss Absorption Capacity (TLAC) requirements like other major global banks, which is expected to be implemented by January 2019. Government liquidity support is also waning for major US banks in a potential crisis, hence lesser level of capital support is expected and higher investment, capital & leverage restrictions are implemented from regulators, amidst Dodd Frank bill, including Volcker rule, which restricts illiquid investments, and furthermore lack of government initiative is expected to bailout larger US banks, post Lehman Brother bankruptcy in 2008. BAC meets the recommended SNBNY guidelines as stated below: 18
  • 19. Bank of America Corporation 3/31/2016 Regulatory Tier 1 Ratio 13.00 8% (Minimum) Regulatory Total Capital Ratio 15.90 10% (Minimum) Impared Loans/Total Gross Loans 2.49 2.5% (Minimum) Net Loans/Deposits 73.55 100% (Maximum) Liquid Assets/Deposits + ST Funds 45.45 30% (Minimum) Yearly Capital Decline Trigger Test (3 Years) Y Yes/No 3 Year Income Decline Trigger Test Y Yes/No Over the past three (3) fiscal years BAC has: -Passed the SNBNY CAGR test with a CAGR net income growth rate of 17.89% (SNBNY proposed guideline of no greater than a cumulative decline of 10% over that 3 year period). -Passed the regulatory capital test (guideline of maximum 5% decline for each year), as regulatory capital has grown by 6% in FY’2015, 4% in 2014, and 2% in 2013, over the past three years respectively. BAC is rated “investment grade” and credit limits are recommended as presented based on the above analysis. 19